Abstract
Blasting in the ocean tunnel has a great impact on Marine life and seabed vegetation, so it is necessary to control the impact of blasting vibration on the surrounding Marine environment. In this paper, taking Xiamen Tunnel as an example, the blasting vibration response characteristics of undersea tunnel are studied, and the velocity attenuation rules of tunnel structure in different directions are obtained. The grey correlation theory is innovatively applied to analyze the correlation degree of factors affecting the blasting vibration effect of the undersea tunnel, and the key factors and secondary factors affecting the blasting vibration effect of the tunnel are determined. The grey correlation theory is used to analyze the correlation degree between the blasting vibration effect of the cross-tunnel, which is conducive to improving the safety and stability of tunnel construction. It provides a new idea and method for vibration control of similar projects.
Highlights
- Attenuation law of blasting in undersea tunnel is analyzed
- Grey correlation degree of vibration effect of underwater tunnel is analyzed
- Control measures to reduce the blasting vibration effect are put forward
1. Introduction
At present, cross-harbour tunnels have also seen rapid development. This is due to the many advantages of cross-harbor tunnels, including the fact that they do not impede the navigation of ships on the water and are not disturbed by extreme weather conditions. In the excavation of hard rock tunnel, the main method is generally blasting. Because in the process of tunnel excavation, blasting will produce seismic waves, which can cause irreversible damage to Marine animals and plants. The current engineering construction mainly needs to avoid the impact on the surrounding ecological environment. Therefore, it is necessary to study the impact of tunnel blasting on the surrounding environment and organisms, to ensure safe and efficient tunnel construction, and also to understand the vibration effects generated by tunnel blasting.
Recently, there have been more and more underwater engineering blasting projects, and the ecological environment of the ocean is receiving increasing attention. For example, Su Xin [1] conducted on-site monitoring of shock waves generated by underwater blasting in Xiamen waters and obtained the relationship between the intensity of underwater blasting shock waves and distance by statistical analysis; Tao Ming [2] studied the attenuation law of water shock waves of underwater borehole blasting by combining theoretical analysis and on-site actual measurement data; Si Jianfeng [3] studied the characteristics and attenuation law of water shock waves of underwater engineering blasting under different conditions and gave the Wang [4] carried out a study on the damage control criteria for fish by blasting water shock waves with the help of experimental data. Underwater drilling blasting will produce seismic waves, underwater tunnel blasting will also produce seismic waves, but there are huge differences between the two. Regarding the impact of blasting vibration generated by underwater tunnel blasting, a lot of work has been carried out at home and abroad, but mostly focused on the structural dynamic response of the adjacent tunnel under the influence of blasting vibration, and few studies have focused on the damage of blasting vibration to marine organisms. For example, Li Bing [5] studied the analysis and control of engineering safety risks during the construction period of drilling and blasting cross-harbour tunnels; Zhong [6] investigated the effects of blasting on existing tunnels using a combination of wave function expansion and numerical simulations. Xu W. [7] studied the seismic effects of a sub-sea tunnel in a ruptured fracture zone under two-way seismic action. Chen Guoxing [8] studied the non-linear response of sub-sea shield tunnels under strong earthquakes using theoretical and numerical simulations and proposed corresponding measures to protect existing tunnel [9-11].
Both underwater tunnel blasting and conventional tunnel blasting produce vibration, but the vibration they produce is different in the following points [12-15]. (1) Propagation medium: the vibration of underwater tunnel blasting is propagated through water, while the vibration of conventional tunnel blasting is propagated through soil or rock. (2) Propagation characteristics: the water body has high damping, so that the propagation of underwater blasting vibration in the water will be attenuated. While the damping of soil or rock is lower, the propagation of conventional tunnel blasting vibration in soil or rock may be more lasting [16-19]. (3) Influencing factors: underwater tunnel blasting vibration is affected by water depth, water pressure, water quality and other factors, while conventional tunnel blasting vibration is affected by soil or rock physical properties, geological structure and other factors. (4) Safety assessment: The impact of vibration caused by underwater tunnel blasting on the surrounding environment requires a more rigorous safety assessment to ensure that there is no adverse impact on the ecology of the surrounding waters and ship traffic. The vibration generated by conventional tunnel blasting can be evaluated for safety according to specific needs. In short, although underwater tunnel blasting and conventional tunnel blasting both produce vibration, the vibration produced by them is different in the aspects of propagation medium, propagation characteristics, influencing factors, monitoring methods and safety assessment [20-21]. In practical application, appropriate monitoring methods and safety assessment means should be selected according to specific conditions to ensure the safety and reliability of tunnel construction.
The existing research on underwater blasting prediction mainly has the following shortcomings:
(1) The accuracy and reliability of the prediction model need to be improved. Although some prediction models of underwater blasting have been established, the prediction accuracy and reliability of these models are still insufficient, especially in the complex underwater environment. Lack of in-depth knowledge of the underwater blasting process. Underwater blasting involves complex physical and chemical processes, including the detonation of explosives, the formation and movement of bubbles, and the pressure and shock waves generated by blasting. A deep understanding of these processes is the basis for building accurate predictive models, but research in this area is limited.
(2) The environmental factors of underwater blasting are not considered. The environmental factors of underwater blasting such as water depth, water pressure and water quality have influence on the blasting effect and the accuracy of prediction model. However, the existing forecasting models often ignore the influence of these environmental factors, leading to the deviation of the forecast results.
(3) Lack of effective real-time monitoring and feedback control means. The monitoring and feedback control of underwater blasting is an important means to improve the accuracy and reliability of prediction. However, the existing monitoring means and feedback control technology still have many limitations, which cannot meet the needs of real-time monitoring and fast feedback control [21].
In order to solve these problems, it is necessary to further study the physical and chemical processes of underwater blasting, explore more accurate prediction models and methods, and develop more advanced real-time monitoring and feedback control technology to improve the safety and reliability of underwater blasting. The application of grey correlation theory to the analysis of blasting vibration effect of cross-port tunnel can better understand the interaction and influence between various factors, and provide scientific basis for optimizing blasting scheme and controlling blasting vibration. Through grey correlation analysis, the key factors and secondary factors affecting the blasting vibration effect of cross-port tunnel can be determined, so as to provide more targeted guidance for the actual construction. It can evaluate the advantages and disadvantages of each scheme and potential risks, so as to choose a more safe, economic and feasible scheme. The innovation lies in the application of grey correlation theory to the analysis of tunnel blasting vibration effect, which not only enriches the theory and method system of tunnel blasting research, but also provides a new idea and reference for vibration control of similar projects. At the same time, the grey correlation analysis method has the advantages of easy to use, strong operability and so on, and can be widely used in other fields of engineering practice. In short, using grey correlation theory to analyze the correlation degree between blasting vibration effects of cross-port tunnel is helpful to improve the safety and stability of tunnel construction, and provide new ideas and methods for vibration control of similar projects.
Based on the Xiamen sub-sea tunnel project (Section 2), the propagation law of seismic waves generated during tunnel blasting has been studied. (Section 3). Based on this, the impact of vibration response on the safety and stability of tunnels was studied. and the propagation and attenuation of blasting vibration along the tunnel profile are studied (Section 4). The analysis of grey correlation theory was used to determine the degree of correlation between the vibration effects of blasting in cross-harbour tunnels.
2. Introduction to submarine tunnel engineering
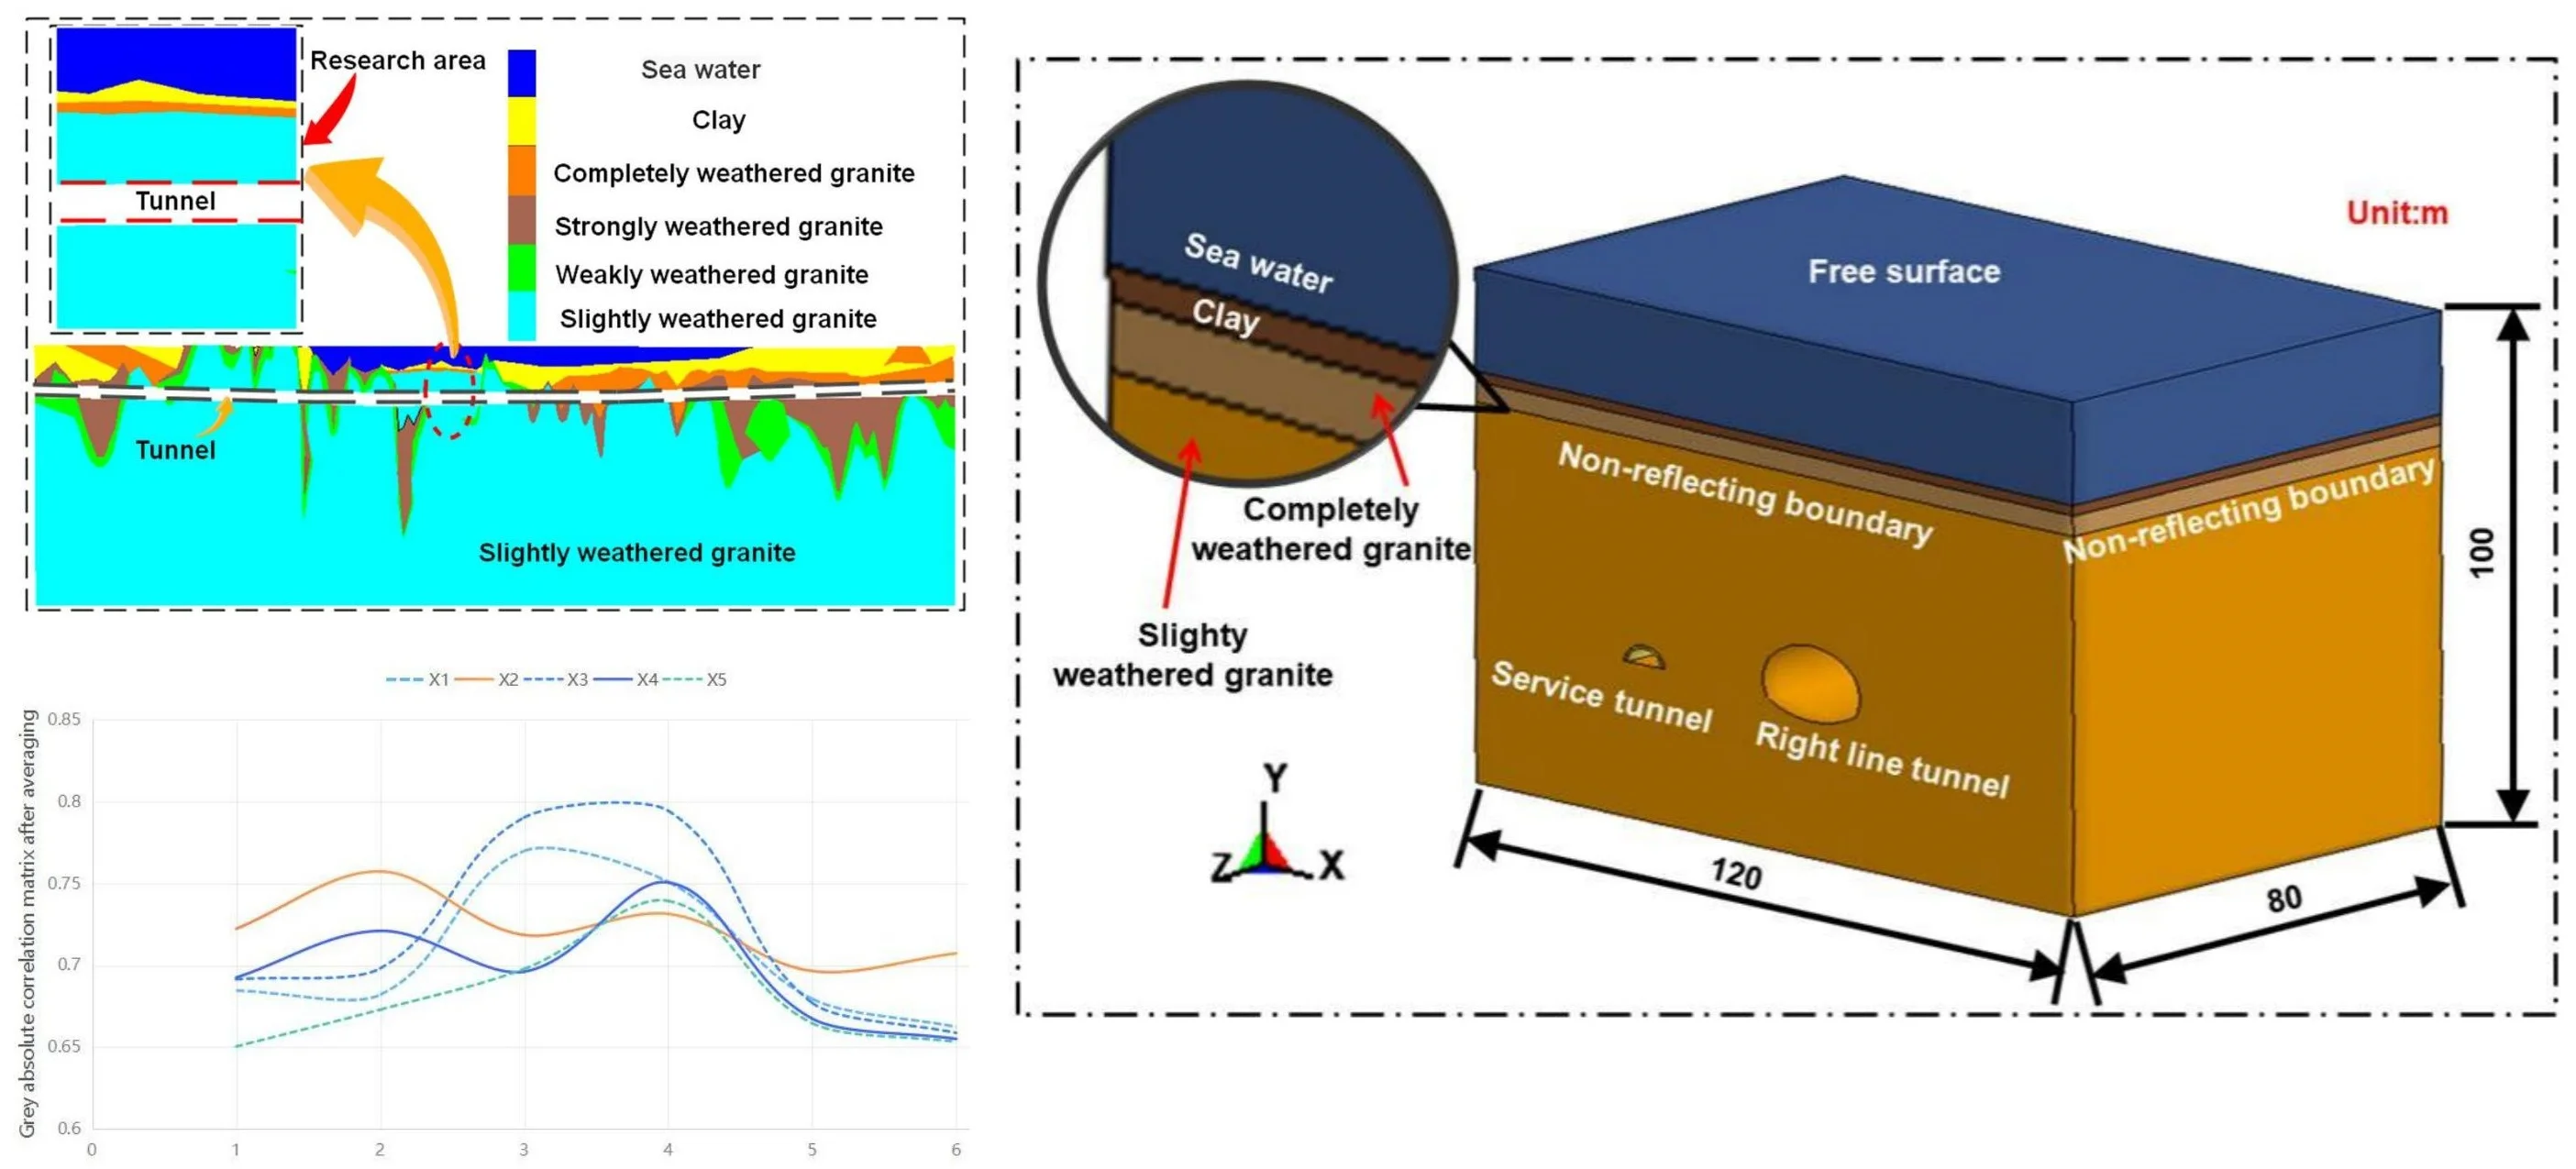
2.1. Geology of subsea tunnels
The Xiamen Submarine Tunnel is a tunnel that crosses the seabed, with a total length of 6.05 kilometers, a height of 9.7 meters, and a width of 7.92 meters. The cross-sectional view of the tunnel is shown in Fig. 1.
The main rock of Xiamen subsea tunnel is slightly weathered granite, which is mainly constructed using blasting method, from the perspective of the whole line, the grade I and grade II rocks account for 46 %, grade III and grade IV rocks account for 13 % and grade V rocks account for 41 %. Different construction methods should be used for different sections of the surrounding rocks. In order to ensure the construction safety and environmental safety of white dolphins, the method of controlled blasting is used to analyze the impact of rock blasting on the surrounding environment, and the research results can reduce the adverse impact of white dolphins.
2.2. Tunnel blasting technical options
This tunnel is designed to blast Class I surrounding rocks according to bare-face blasting, using No. 2 rock emulsion explosives, continuous charging in wedge-shaped hollowing shell holes, spaced charging using bamboo pieces in the peripheral eyes, and a plastic detonator tube detonation network. The blasting layout of the tunnel is shown in Fig. 2, and the main parameters of the blasting are shown in Table 1 [10], so the blasting effect of trenching eyes is particularly important to obtain good blasting results. The subsequent research process mainly focuses on the effects caused by trench-hole blasting, because the blasting vibration caused by the largest single explosive is the largest.
3. On site testing of blasting vibration
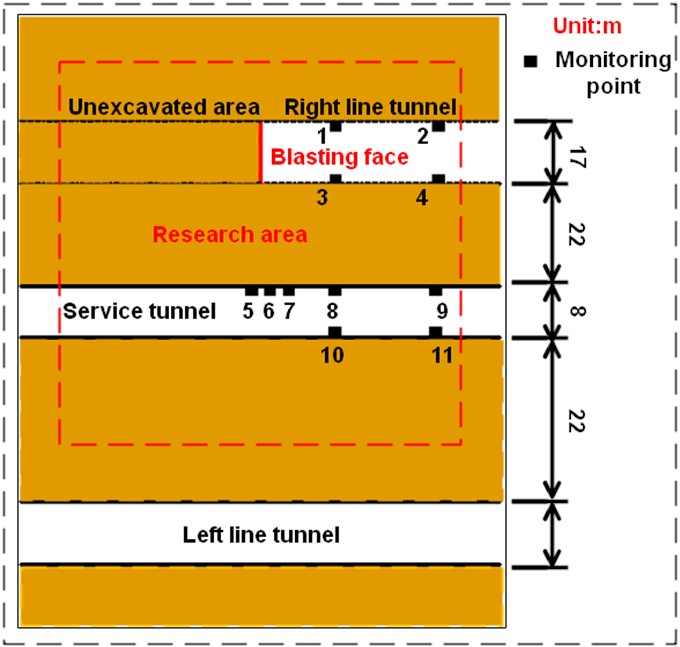
To gain a comprehensive understanding of the propagation of seismic waves during the blast monitoring process, we collected axial and radial data of the tunnel at the Xiamen subsea tunnel, while the radial direction of the test is more difficult due to space constraints, for this reason, we make full use of the main cavern and service cavern adjacent to this condition, when the main cavern palm face blasting construction, vibration testing in the service cavern, the specific vibration test test point layout is shown in Fig. 3.
Fig. 1Cross-sectional layout of the tunnel
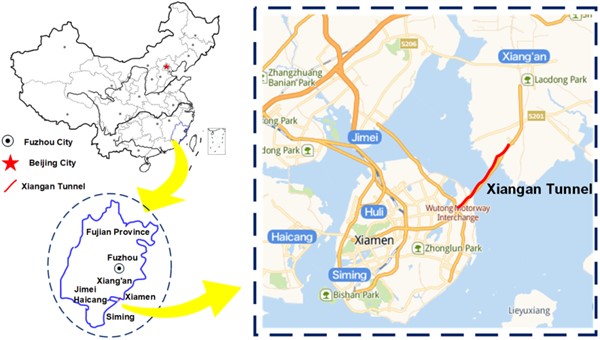
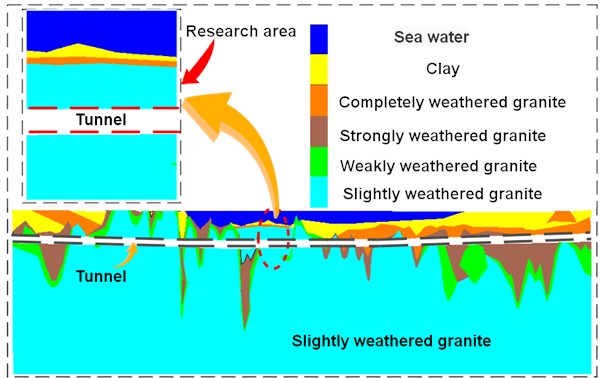
Fig. 2Full section excavation shell hole layout
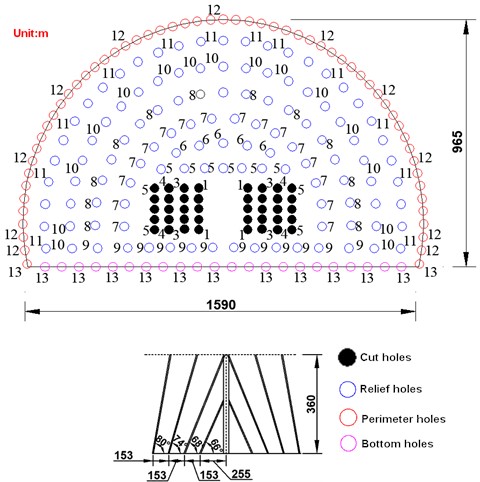
Table 1Table of full-section loading parameters
Type of hole | Depth / m | Number of holes | Charge length / m | Single hole charge / Kg | Line charge density / (Kg/m) | Total charge / Kg | Detonator section number |
Grooved eyelets | 2.2 | 10 | 2.0 | 3.0 | 1.36 | 30.0 | 1 |
Grooved eyelets | 4.0 | 10 | 3.6 | 5.4 | 1.35 | 54.0 | 3 |
Grooved eyelets | 4.0 | 10 | 3.2 | 4.8 | 1.20 | 48.0 | 4 |
Grooved eyelets | 4.0 | 17 | 2.8 | 4.2 | 1.05 | 71.4 | 5 |
Trenching eye | 3.6 | 5 | 2.0 | 3.0 | 0.83 | 15.0 | 6 |
Trenching eye | 3.6 | 16 | 2.0 | 3.0 | 0.83 | 48.0 | 7 |
Trenching eye | 3.6 | 19 | 2.0 | 3.0 | 0.83 | 57.0 | 8 |
Trenching eye | 3.6 | 12 | 2.0 | 3.0 | 0.83 | 36.0 | 9 |
Trenching eye | 3.6 | 25 | 1.8 | 2.7 | 0.75 | 67.5 | 10 |
Inner rim eye | 3.6 | 29 | 1.6 | 2.4 | 0.66 | 69.6 | 11 |
Peripheral eyes | 3.6 | 55 | 1.2 | 1.08 | 0.30 | 59.4 | 12 |
Undercutting eyes | 3.6 | 24 | 2.8 | 2.52 | 0.70 | 60.5 | 13 |
Total | 232 | 616.4 |
Fig. 3Layout of the specific vibration test point: 1, 2, 3, 4 – axial vibration measurement points in the main tunnel; 5, 6, 7 – radial vibration measurement points in the main tunnel; 8, 9 – axial vibration measurement points in the service tunnel
Vibration monitoring data from the main tunnel and service caverns were counted and analyzed by regressing blast vibration test data from multiple cycles on site, based on the empirical formula for the peak of a mass point velocity (PPV) proposed by Soviet academic Sadovsky. The regression equation for the service cavern vibration data is Eq. (1):
The regression equation for the main cave vibration data is Eq. (2):
where: is the seismic safe PPV, cm/s; is maximum single segment explosive quantity, kg.
As can be seen from the above equation, the PPV gradually increases as the distance to the tunnel palm face decreases.
4. Numerical simulation analysis
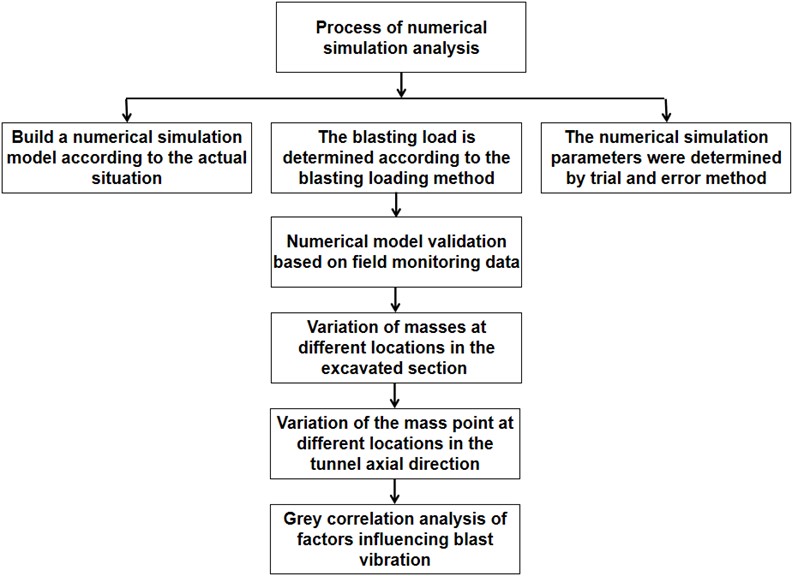
In this paper, a numerical model is established based on the actual field conditions, and compared with the actual field monitoring situation, and the numerical model after verification is simulated. The relevant analysis process is shown in Fig. 4.
Fig. 4Process of numerical simulation analysis
4.1. Blast loading methods
In recent years, the pressure process of blast holes has been a research focus of scholars [22-26], with one being exponential decay load [27] and the other being triangular load [28-29]. Based on experience, this article adopts triangular loads, so we need determine the peak explosive load, i.e. determine the peak pressure of the explosive gas acting on the borehole wall. According to the C-J theory of cohesive explosive blast waves, the average explosive blast pressure for a columnar package with a small decoupling factor is the initial average pressure in the hole [30-34]:
where: is the explosive blast pressure; is the explosive density; is the explosive blast speed; is the isentropic index of explosives. Approximate values are taken 2-3, this paper takes 3, respectively, , db the diameter of the charge roll, and the diameter of the hole.
If it is a group hole detonation, when the load around all detonation holes is:
where: 10; , , are relevant parameters, this paper takes , ; 0.25 is the rock Poisson’s ratio [35-38].
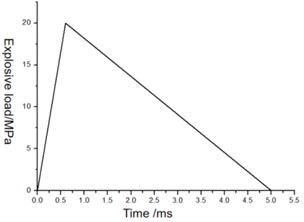
By calculating the above formula and referring to existing literature [39-41], the peak value of the blasting load is less than 20 MPa, as shown in Fig. 5.
Fig. 5Curve of equivalent blast impact load loading
4.2. Numeric calculation model
4.2.1. Model dimensions
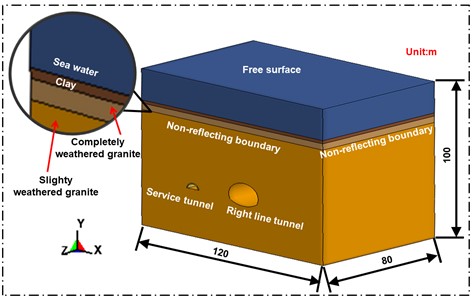
Numerical simulation software ANSYS/LS-DYNA was used to simulate the blasting vibration of underwater tunnels, with a numerical model size of 120 m × 80 m × 99.65 m, the grid in the numerical model adopts 8-node SOLID164 solid element, and the numerical calculation model is shown in Fig. 6.
The relevant physical and mechanical parameters of the numerical calculation model were obtained in the laboratory based on conventional experimental research, as shown in Table 2. At the same time, * MAT was used for the soil in the numerical model_ SOIL_ AND_ FOAM material model, rock using MAT_ PLASTIC_ KINEMATIC material model.
Table 2Physical and mechanical parameters of material model
Parameter | Unit | Type of rock | |||
Water | Silt Soil | Fully weathered rock | Slightly weathered rock | ||
Density | g / cm3 | 1 | 1.4 | 2.2 | 2.6 |
Modulus of elasticity | GPa | – | 0.02 | 0.1 | 0.45 |
Shear modulus | MPa | – | 38.5 | 39.06 | 187.5 |
Poisson’s ratio | – | – | 0.3 | 0.28 | 0.2 |
Cohesion | MPa | – | 0.02 | 10 | 15 |
Friction angle | ° | – | 20 | 22 | 45 |
Compressive strength | MPa | – | – | 130 | 150 |
Yield strength | MPa | – | 0.016 | 0.4 | 0.8 |
Water usage keyword * MAT in the model_ NULL definition, the state equation is Eq. (5):
where is the density of the water after disturbance, is the initial density of water, is the specific internal energy, is the GRUNEISEN factor, and , and , are slope factor of VS-VP [40-41].
Fig. 6Numerical model dimensions and boundary conditions
a) Numerical calculation model
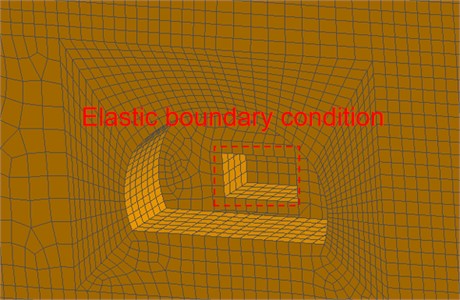
b) Boundary conditions
4.2.2. Reliability verification of numerical models
According to the actual needs on site, the layout diagram of monitoring points is shown in Fig. 3, and the measured data and numerical simulation data are compared and analyzed, as shown in Fig. 7. Table 3 shows the comparison diagram of numerical simulation data for each monitoring point and the comparison diagram of on-site measured data. From Fig. 7 and Table 3, it cannot be seen that the trend of variation between the on-site measured data and the numerical simulation curve is similar, and the difference is not significant. Moreover, the maximum difference between the on-site measured data and the numerical simulation data is only 9.62 %. This is because in the field measurement process, there are a lot of joint cracks in the soil, resulting in the superposition of seismic waves. It can be seen from the maximum error rate that the numerical simulation parameters can be used to study the effect of blasting vibration on tunnel structure.
Fig. 7Numerical simulation of PPV as a function of time at monitoring point 1
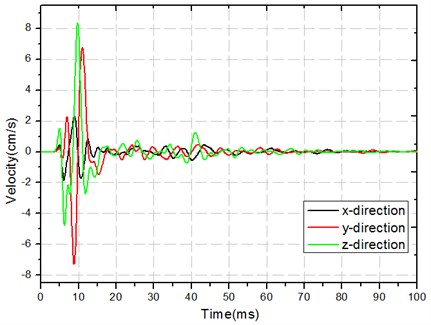
Table 3Peak velocities from numerical simulations and in situ monitoring
Monitoring sites | Numerical simulation (cm/s) | On-site measurements (cm/s) | Percentage of combined PPV error | ||||||
X | Y | Z | Combined PPV | X | Y | Z | Combined PPV | ||
1# | 2.312 | 7.354 | 8.372 | 8.773 | 2.1 | 7.825 | 8.571 | 8.372 | 4.57 |
2# | 1.132 | 2.931 | 3.812 | 4.128 | 1.123 | 2.534 | 3.742 | 4.123 | 0.12 |
3# | 3.523 | 7.985 | 8.985 | 9.175 | 3.2 | 6.975 | 8.924 | 9.157 | 0.20 |
4# | 1.255 | 2.672 | 3.187 | 4.187 | 1.264 | 2.615 | 3.167 | 3.921 | 6.35 |
5# | 2.412 | 7.567 | 9.685 | 10.657 | 2.6 | 7.846 | 9.323 | 9.632 | 9.62 |
4.3. Variation of masses at different locations in the excavated section
In order to analyze the vibration characteristics of tunnel rock particles caused by blasting seismic waves at different distances from the tunnel face, the vibration distribution of the surrounding rock at 1 m, 5 m, and 30 m of the tunnel profile was selected, as shown in Fig. 8.
It is not difficult to see from Fig. 8 that the direction of the tunnel (vertical direction of the tunnel) is larger than the direction (radius direction of the tunnel) and the direction (axial direction of the tunnel), which is because the direction where the free surface of the tunnel face is located is the direction, so most of the energy in this direction is dissipated in the form of air shock wave, and the direction is the vibration caused by blasting vibration wave. At the same time, the vibration superposition caused by the unloading rebound of the tunnel leads to the increase of vibration intensity.
Upon careful observation of Fig. 8(a), it is not difficult to find that the vibration velocity of the upper part of the tunnel structure is low, while the vibration velocity of the lower part is high. The same situation occurs in Fig. 8(b), which is caused by high ground stress. At the same time, as the arch foot is the main point of force, it may also experience high vibration velocity due to stress concentration.
4.4. Variation of the mass point at different locations in the tunnel axial direction
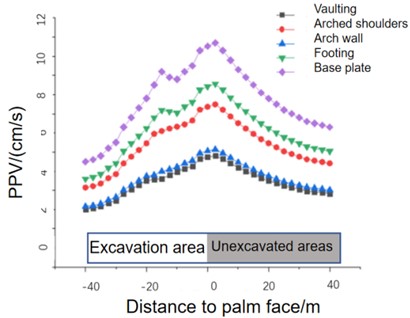
Statistical analysis shows the distribution of vibration velocity at different distances in front of and behind the tunnel face, as shown in Fig. 9. Upon closer observation, it is not difficult to find that the PPV of the unexcavated area of the tunnel is greater than that of the excavated area. This is because a portion of the energy generated by blasting in the excavated area of the tunnel face is dissipated by air shock waves, while the unexcavated area has better transmissibility due to the integrity of the rock mass.
Fig. 8Distribution of PPV in tunnel excavation section: a) X direction; b) Y direction; c) Z direction
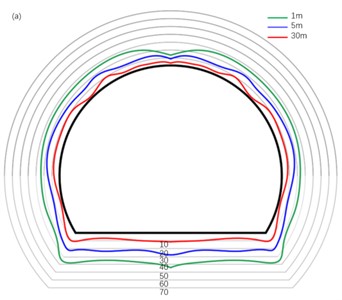
a)
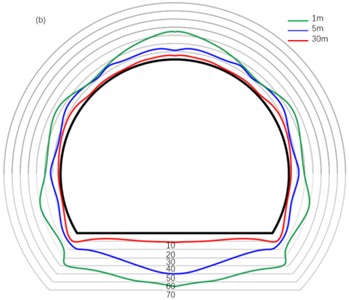
b)
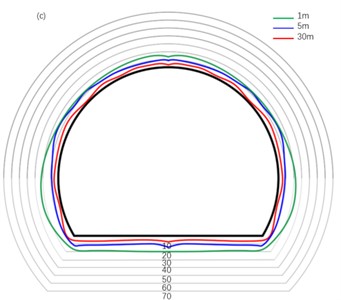
c)
On the other hand, the peak vibration velocity of the tunnel is the largest in the tunnel unexcavated area 1-1.5 times away from the working face. This is because in the unexcavated area of the tunnel, the attenuation of blasting vibration is small, while the attenuation of energy generated by blasting in the excavated area is large, so the peak value of blasting vibration appears in the unexcavated area of the tunnel.
Fig. 9Distribution characteristics of the PPV in the axial direction of the tunnel
5. Grey correlation analysis of factors influencing blast vibration
5.1. Principles of grey correlation analysis methods
Correlation analysis is essentially an analytical comparison of the geometry of curves, i.e. the closer the geometry, the closer the trend of development. The grey correlation analysis method to calculate the grey correlation between the data series of the characteristic variables of the system and the series of the relevant factor variables, to build up a grey correlation matrix, and to use the principle of dominance analysis to derive the order of each influencing factor, and finally to determine the main influencing factor.
When determining the main factors affecting rockburst vibration by grey correlation analysis, it is not necessary to consider the change rate of each measured value in the variable series relative to the starting point. This also effectively avoids the calculation problems arising in the correlation calculation due to the selection of the discriminant coefficient. In this paper, grey absolute correlation is used as the basis of grey correlation analysis.
If n trials are used to determine the main factors, then the data measured in each trial for each of the system characteristic variables and the associated factor variables form the corresponding sequence of system characteristic variable and associated factor variable data, i.e:
where and denote the data measured at the th trial for the th system characteristic variable and the th correlated factor variable, respectively.
As the units of the data series of each variable are not uniform, the data series of each variable must be standardized to ensure the accuracy of the calculated correlations. The mean image of the series of each variable is first obtained by the action of the homogenization operator D1, whose algorithm is as follows:
where: , .
Again, a zero-image calculation of Eq. (8) for the starting point:
According to the definition of grey correlation, it is obtained:
where is the absolute grey correlation between the th system characteristic variable and the th factor of interest, where:
The absolute grey correlation is calculated according to Eq. (13) to obtain the absolute grey correlation matrix:
If , , , then factor is considered superior to factor .
If there is no optimal factor, there must be satisfaction that , , , then factor is quasi superior to factor . If for any (1, 2, 3,..., ; ), is superior to , then is said to be a quasi-optimal factor. The optimal and quasi-optimal factors are collectively referred to in engineering as the dominant factors.
5.2. Grey correlation calculation
Depending on the specific circumstances of the tunnel, the factors affecting the effect of blast vibration are: blast centre distance, total charge, maximum charge in a single section, number of sections, and the height difference between the measurement point and the blast source (hereafter referred to as height difference), defined as the correlation coefficient variable (). The blast vibration effect is the result of the combined effect of PPV, blast vibration main frequency and blast vibration duration. Therefore, in this paper, the six factors of mass horizontal and vertical PPV, main vibration frequency, and vibration duration are used as variables of the system characteristics (). The specific calculation process of the grey correlation degree of each factor is as follows:
The mean bishop of each variable series is calculated as shown in Table 4 and Fig. 10.
Fig. 10Mean bishop of the series of each variable
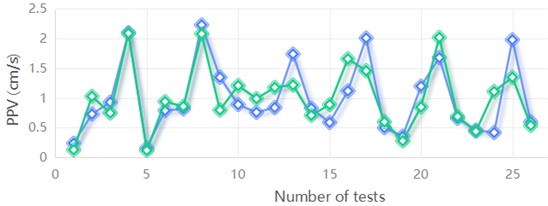
a) PPV
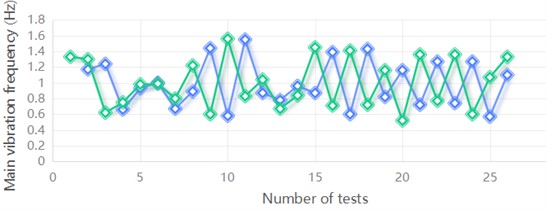
b) Main vibration frequency
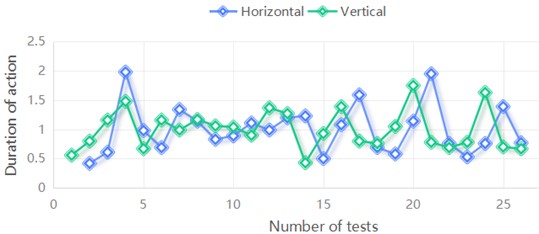
c) Duration of action
Table 4Mean bishop of the series of each variable
Measurement point number | Number of tests | Associated factor variable () | ||||
Total charge (kg) | Maximum charge in a single section (kg) | Number of sections | Distance between bursts (m) | Difference in elevation (m) | ||
ZC1 | NO.1 | 0.93 | 1.11 | 1.18 | 1.57 | 1.43 |
NO.2 | 1.49 | 0.82 | 2.12 | 1.43 | 1.61 | |
NO.3 | 0.65 | 1.05 | 0.47 | 0.67 | 0.69 | |
NO.4 | 0.92 | 1.03 | 0.24 | 0.34 | 0.27 | |
ZC2 | NO.5 | 0.93 | 1.11 | 1.18 | 1.63 | 1.43 |
NO.6 | 1.49 | 0.82 | 2.12 | 1.49 | 1.62 | |
NO.7 | 0.65 | 1.05 | 0.47 | 0.57 | 0.69 | |
NO.8 | 0.92 | 1.03 | 0.24 | 0.31 | 0.27 | |
ZC3 | NO.9 | 0.93 | 1.11 | 1.18 | 0.57 | 0.45 |
NO.10 | 1.49 | 0.82 | 2.12 | 1.23 | 2.19 | |
NO.11 | 0.65 | 1.05 | 0.47 | 1.20 | 0.36 | |
ZC4 | NO.12 | 0.93 | 1.11 | 1.18 | 1.07 | 1.11 |
NO.13 | 1.49 | 0.82 | 2.12 | 0.61 | 0.05 | |
NO.14 | 0.65 | 1.05 | 0.47 | 1.04 | 1.17 | |
NO.15 | 0.92 | 1.03 | 0.24 | 1.29 | 1.67 | |
ZC5 | NO.16 | 0.93 | 1.11 | 1.18 | 0.78 | 1.10 |
NO.17 | 1.49 | 0.82 | 2.12 | 0.48 | 0.13 | |
NO.18 | 0.65 | 1.05 | 0.47 | 1.25 | 1.15 | |
NO.19 | 0.92 | 1.03 | 0.24 | 1.49 | 1.62 | |
ZC6 | NO.20 | 0.93 | 1.11 | 1.18 | 0.85 | 1.12 |
NO.21 | 1.49 | 0.82 | 2.12 | 0.46 | 0.01 | |
NO.22 | 0.65 | 1.05 | 0.47 | 1.22 | 1.17 | |
NO.23 | 0.92 | 1.03 | 0.24 | 1.47 | 1.70 | |
ZC7 | NO.24 | 0.93 | 1.11 | 1.18 | 1.17 | 1.16 |
NO.25 | 1.49 | 0.82 | 2.12 | 0.57 | 0.12 | |
NO.26 | 0.92 | 1.03 | 0.24 | 1.26 | 1.71 | |
The calculation of the zero symbol for the starting point is shown in Table 5 and Fig. 11.
The grey absolute correlation is calculated as shown in Table 6 and Fig. 12.
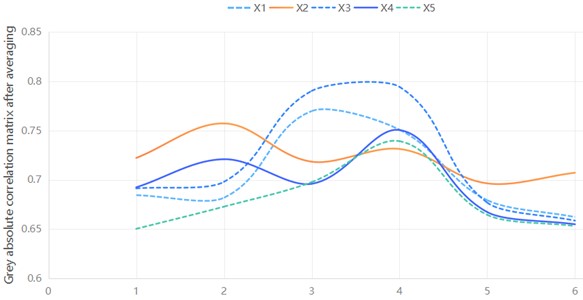
The grey correlations of the relevant factors for each measurement point were averaged to be worth Table 7 and Fig. 13.
Table 5Zero-imagination of start points for each variable sequence
Measurement point number | Number of tests | Associated factor variable () | ||||
Total charge (kg) | Maximum charge in a single section (kg) | Number of sections | Distance between bursts (m) | Difference in elevation (m) | ||
ZC1 | NO.1 | 0.00 | 0.00 | 0.00 | 0.00 | 0.00 |
NO.2 | 0.56 | –0.28 | 0.94 | –0.14 | 0.19 | |
NO.3 | –0.28 | –0.06 | –0.71 | –0.90 | –0.74 | |
NO.4 | –0.01 | –0.08 | –0.94 | –1.23 | –1.16 | |
ZC2 | NO.5 | 0.00 | 0.00 | 0.00 | 0.00 | 0.00 |
NO.6 | 0.56 | –0.28 | 0.94 | –0.15 | 0.19 | |
NO.7 | –0.28 | –0.06 | –0.71 | –1.06 | –0.74 | |
NO.8 | -0.01 | –0.08 | –0.94 | –1.32 | –1.16 | |
ZC3 | NO.9 | 0.00 | 0.00 | 0.00 | 0.00 | 0.00 |
NO.10 | 0.56 | –0.28 | 0.94 | 0.67 | 1.74 | |
NO.11 | –0.28 | –0.06 | –0.71 | 0.63 | –0.09 | |
ZC4 | NO.12 | 0.00 | 0.00 | 0.00 | 0.00 | 0.00 |
NO.13 | 0.56 | –0.28 | 0.94 | –0.46 | –1.06 | |
NO.14 | –0.28 | –0.06 | –0.71 | –0.03 | 0.06 | |
NO.15 | -0.01 | –0.08 | –0.94 | 0.22 | 0.56 | |
ZC5 | NO.16 | 0.00 | 0.00 | 0.00 | 0.00 | 0.00 |
NO.17 | 0.56 | –0.28 | 0.94 | –0.30 | –0.97 | |
NO.18 | –0.28 | –0.06 | –0.71 | 0.47 | 0.05 | |
NO.19 | –0.01 | –0.08 | –0.94 | 0.71 | 0.51 | |
ZC6 | NO.20 | 0.00 | 0.00 | 0.00 | 0.00 | 0.00 |
NO.21 | 0.56 | –0.28 | 0.94 | –0.40 | –1.10 | |
NO.22 | –0.28 | –0.06 | –0.71 | 0.37 | 0.06 | |
NO.23 | –0.01 | –0.08 | –0.94 | 0.61 | 0.58 | |
ZC7 | NO.24 | 0.00 | 0.00 | 0.00 | 0.00 | 0.00 |
NO.25 | 0.56 | –0.28 | 0.94 | –0.60 | –1.04 | |
NO.26 | –0.01 | –0.08 | –0.94 | 0.09 | 0.55 | |
Fig. 11Zero-imagination of start points for each variable sequence
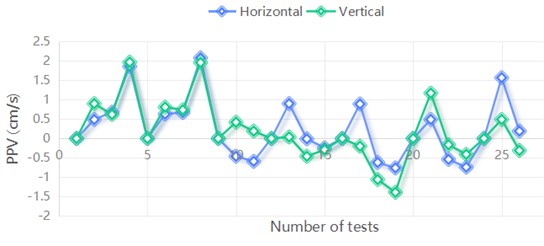
a) PPV
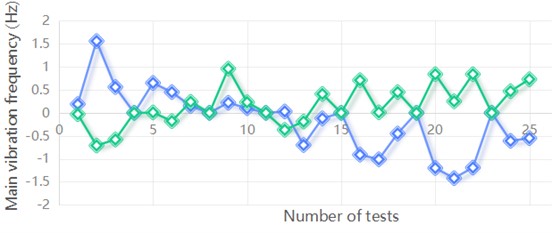
b) Main vibration frequency
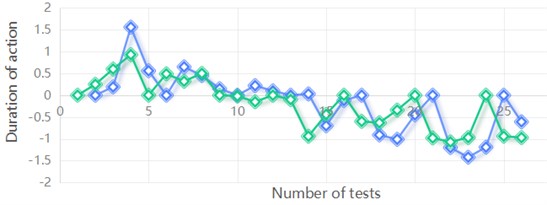
c) Duration of action
Table 6Grey absolute correlation matrix for each measurement point
Measurement point number | Number of tests | Correlation matrix | |||||
ZC1 | NO.1 | 0.6486 | 0.5838 | 0.5882 | 0.5588 | 0.5669 | |
NO.2 | 0.6228 | 0.5739 | 0.5773 | 0.5538 | 0.5604 | ||
NO.3 | 0.6875 | 0.9157 | 0.8467 | 0.7467 | 0.8239 | ||
NO.4 | 0.6392 | 0.7894 | 0.7414 | 0.8544 | 0.9652 | ||
NO.5 | 0.6525 | 0.5857 | 0.5902 | 0.5597 | 0.5681 | ||
NO.6 | 0.7197 | 0.6168 | 0.6354 | 0.5734 | 0.5863 | ||
ZC2 | NO.7 | 0.6361 | 0.5776 | 0.5813 | 0.5531 | 0.5629 | |
NO.8 | 0.6274 | 0.5732 | 0.5765 | 0.5510 | 0.5600 | ||
NO.9 | 0.7552 | 0.9074 | 0.9885 | 0.6516 | 0.7194 | ||
NO.10 | 0.8014 | 0.8157 | 0.8786 | 0.6175 | 0.6700 | ||
NO.11 | 0.7303 | 0.6214 | 0.6307 | 0.5705 | 0.5888 | ||
NO.12 | 0.7484 | 0.6291 | 0.6396 | 0.5730 | 0.5929 | ||
ZC3 | NO.13 | 0.6494 | 0.824 | 0.6356 | 0.6219 | 0.5847 | |
NO.14 | 0.7302 | 0.9541 | 0.6887 | 0.9646 | 0.6415 | ||
NO.15 | 0.7848 | 0.6298 | 0.8375 | 0.6056 | 0.8670 | ||
NO.16 | 0.7903 | 0.6319 | 0.8440 | 0.6070 | 0.8600 | ||
NO.17 | 0.9190 | 0.7308 | 0.8536 | 0.6639 | 0.6752 | ||
NO.18 | 0.7472 | 0.8645 | 0.7117 | 0.7362 | 0.6092 | ||
ZC4 | NO.19 | 0.6511 | 0.6507 | 0.6653 | 0.8026 | 0.6248 | |
NO.20 | 0.6869 | 0.9140 | 0.8453 | 0.9122 | 0.9340 | ||
NO.21 | 0.8361 | 0.6729 | 0.6924 | 0.6734 | 0.6396 | ||
NO.22 | 0.7204 | 0.9885 | 0.9268 | 0.9906 | 0.8511 | ||
NO.23 | 0.6669 | 0.8598 | 0.80000 | 0.8583 | 0.7995 | ||
NO.24 | 0.6230 | 0.7505 | 0.7089 | 0.7494 | 0.6484 | ||
ZC5 | NO.25 | 0.7853 | 0.8422 | 0.9104 | 0.7212 | 0.7587 | |
NO.26 | 0.5914 | 0.6791 | 0.6494 | 0.5837 | 0.7370 | ||
NO.27 | 0.7105 | 0.6128 | 0.6208 | 0.7798 | 0.5999 | ||
NO.28 | 0.7681 | 0.6372 | 0.6491 | 0.8563 | 0.6186 | ||
NO.29 | 0.5856 | 0.6665 | 0.6389 | 0.5787 | 0.6203 | ||
NO.30 | 0.6152 | 0.7323 | 0.6937 | 0.6031 | 0.8074 | ||
ZC6 | NO.31 | 0.7086 | 0.9762 | 0.8971 | 0.7067 | 0.8687 | |
NO.32 | 0.7969 | 0.6485 | 0.6627 | 0.8010 | 0.6215 | ||
NO.33 | 0.7883 | 0.6452 | 0.6587 | 0.7923 | 0.7194 | ||
NO.34 | 0.6921 | 0.6045 | 0.6113 | 0.6948 | 0.5904 | ||
NO.35 | 0.5627 | 0.6186 | 0.5989 | 0.5625 | 0.6689 | ||
NO.36 | 0.5757 | 0.6454 | 0.6213 | 0.5754 | 0.7071 | ||
ZC7 | NO.37 | 0.7126 | 0.6011 | 0.7519 | 0.6922 | 0.5853 | |
NO.38 | 0.7167 | 0.9574 | 0.886 | 0.6797 | 0.6554 | ||
NO.39 | 0.8264 | 0.6453 | 0.8867 | 0.6227 | 0.6149 | ||
NO.40 | 0.8450 | 0.6520 | 0.9088 | 0.6329 | 0.6190 | ||
NO.41 | 0.6381 | 0.7923 | 0.6263 | 0.8775 | 0.7306 | ||
NO.42 | 0.6069 | 0.7119 | 0.5997 | 0.7737 | 0.6206 |
Fig. 12Grey absolute correlation matrix for each measurement point
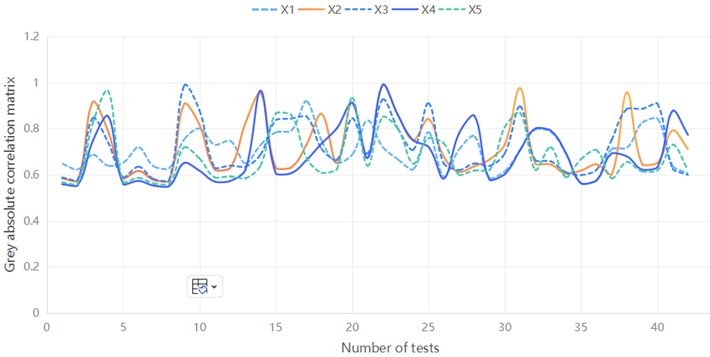
Table 7Grey absolute correlation matrix after averaging
Correlation Matrix | |||||
0.6845 | 0.7222 | 0.6913 | 0.6924 | 0.6503 | |
0.6818 | 0.7572 | 0.6980 | 0.7209 | 0.6728 | |
0.7698 | 0.7184 | 0.7902 | 0.6960 | 0.6977 | |
0.7509 | 0.7313 | 0.7943 | 0.7505 | 0.7392 | |
0.6793 | 0.6964 | 0.6769 | 0.6673 | 0.6645 | |
0.6623 | 0.7072 | 0.6586 | 0.6549 | 0.6531 | |
4.2286 | 4.3328 | 4.3094 | 4.1820 | 4.0776 |
(1) It can be seen from the grey correlation calculation results that the maximum charge used in a single section is the largest, and the elevation angle difference is the smallest, in terms of the influence of each factor on PPV in the horizontal direction. In terms of the influence of various factors on the main frequency of vibration, the ratio of the number of segments is the largest, and the maximum amount of a single segment is the smallest.
(2) Through grey correlation analysis, the key factors and secondary factors affecting the blasting vibration effect of cross-port tunnel can be determined, and the pros and cons and potential risks of each scheme can be evaluated, so as to choose a safer, economic and feasible scheme. This application has not only enriched the theory and method system of tunnel blasting research, but also has the advantages of simple and easy to use, strong operability and so on, which can be widely used in other fields of engineering practice. In short, using grey correlation theory to analyze the correlation degree between blasting vibration effects of cross-port tunnel is helpful to improve the safety and stability of tunnel construction, and provide new ideas and methods for vibration control of similar projects.
Fig. 13Grey absolute correlation matrix after averaging
6. Conclusions
1) The direction of the tunnel (the vertical direction of the tunnel) is larger than the direction (the radius direction of the tunnel) and the direction (the axial direction of the tunnel), and the vibration speed of the upper part of the tunnel structure is lower, while the vibration speed of the lower part is higher.
2) The peak vibration velocity of the tunnel is the largest in the unexcavated area 1-1.5 times from the tunnel working face. In the tunnel non-excavation area, the attenuation of blasting vibration is small, while in the excavation area, the attenuation of blasting energy is large.
3) Maximum charge used in a single section and the number of segments have little influence on PPV (horizontal and vertical), while the main vibration frequency (horizontal and vertical) and vibration duration (horizontal and vertical) have greater influence. The order of influence of the two factors on blasting vibration effect is correspondingly higher.
4) The research method in this paper is suitable for the study of the influence of underwater tunnel blasting on tunnel structure. In order to control the damage of blasting vibration to the surrounding rock of excavation engineering, it is necessary to take corresponding control measures according to the sequence of influencing factors of blasting vibration. Through grey correlation analysis, the key factors and secondary factors affecting the blasting vibration effect of cross-port tunnel can be determined, and the pros and cons and potential risks of each scheme can be evaluated, so as to choose a safer, economic and feasible scheme.
References
-
X. Su, X., and M. Xu, “Monitoring and analysis of shock waves in underwater blasting in Xiamen waters,” (in Chinese), Journal of Xiamen University (Natural Science Edition), Vol. 46, pp. 1–12, 2007.
-
M. Tao, “Research on the attenuation of water shock waves in underwater drilling and blasting,” (in Chinese), Wuhan University of Technology, Vol. 1, No. 3, pp. 1–14, 2009.
-
Y. Wan, W. Li, H. Du, and X. Yang, “Investigation of shock wave pressure transmission patterns and influencing factors caused by underwater drilling blasting,” Water, Vol. 14, No. 18, p. 2837, Sep. 2022, https://doi.org/10.3390/w14182837
-
D. Wang et al., “Tailoring the mechanical properties of Al4Ca intermetallic by doping M (M = Cu, Zn, Mg, Fe and Mn) from DFT calculations,” Journal of Materials Science, Vol. 58, No. 17, pp. 7347–7361, Apr. 2023, https://doi.org/10.1007/s10853-023-08429-z
-
G. Zhao, C. Q. Wu, W., and H. Wang, “Study on the damage of fish by blasting water shock waves,” (in Chinese), Engineering Blasting, Vol. 17, No. 4, pp. 103–105, 2011.
-
D. W. Zhong, L. Wu, G. Yu, and N. L. Wang, “Study on effect of tunnelling blasting on existing adjacent tunnel,” Materials Research Innovations, Vol. 15, No. sup1, pp. s513–s516, Nov. 2013, https://doi.org/10.1179/143307511x12858957676272
-
X. Cheng, W. Xu, C. Yue, X. Du, and C. H. Dowding, “Seismic response of fluid-structure interaction of undersea tunnel during bidirectional earthquake,” Ocean Engineering, Vol. 75, No. 2, pp. 64–70, Jan. 2014, https://doi.org/10.1016/j.oceaneng.2013.11.017
-
G. Chen et al., “Nonlinear response characteristics of undersea shield tunnel subjected to strong earthquake motions,” Journal of Earthquake Engineering, Vol. 24, No. 3, pp. 351–380, Mar. 2020, https://doi.org/10.1080/13632469.2018.1453416
-
J. A. Sharpe, “The production of elastic waves by explosion pressures. I. Theoretical and empirical field observations,” GEOPHYSICS, Vol. 7, No. 2, pp. 144–154, Apr. 1942, https://doi.org/10.1190/1.1445002
-
W. I. Duvall, “Strain-wave shapes in rock near explosions,” Geophysics, Vol. 18, No. 2, pp. 310–323, Apr. 1953, https://doi.org/10.1190/1.1437875
-
B. Zakrisson, B. Wikman, and H.-Häggblad, “Numerical simulations of blast loads and structural deformation from near-field explosions in air,” International Journal of Impact Engineering, Vol. 38, No. 7, pp. 597–612, Jul. 2011, https://doi.org/10.1016/j.ijimpeng.2011.02.005
-
S. Sezen and M. Atlar, “Marine propeller underwater radiated noise prediction with the FWH acoustic analogy Part 2: Assessment of model scale propeller hydroacoustic performance under non-uniform flow conditions,” Ocean Engineering, Vol. 270, No. 3, p. 113443, Feb. 2023, https://doi.org/10.1016/j.oceaneng.2022.113443
-
Z. Sun, D. Zhang, Q. Fang, J. Wang, Z. Chu, and Y. Hou, “Analysis of interaction between tunnel support system and surrounding rock for underwater mined tunnels considering the combined effect of blasting damage and seepage pressure,” Tunnelling and Underground Space Technology, Vol. 141, No. 3, p. 105314, Nov. 2023, https://doi.org/10.1016/j.tust.2023.105314
-
D. B. Barker, W. Fourney, and J. W. Dally, “Fracture control in tunnel blasting,” (in Chinese), Transportation Research Record Journal of the Transportation Research Board, Vol. 1, No. 3, pp. 8–14, 1978.
-
S. Sahoo and P. C. Jena, Advances in Modelling and Optimization of Manufacturing and Industrial Systems. Singapore: Springer Nature Singapore, 2023, https://doi.org/10.1007/978-981-19-6107-6
-
B. B. V. L. Deepak, D. R. K. Parhi, B. B. Biswal, and C. Pankaj, Lecture Notes in Mechanical Engineering. Singapore: Springer Nature Singapore, 2022, pp. 1–14, https://doi.org/10.1007/978-981-19-0296-3
-
B. B. V. L. Deepak, R. Dayal, and J. Charan, Lecture Notes in Mechanical Engineering. Singapore: Springer Singapore, 2020, https://doi.org/10.1007/978-981-15-2696-1
-
S. Sahoo, S. P. Parida, and P. C. Jena, “Dynamic response of a laminated hybrid composite cantilever beam with multiple cracks and moving mass,” Structural Engineering and Mechanics, Vol. 87, No. 6, pp. 529–540, Sep. 2023, https://doi.org/10.12989/sem.2023.87.6.529
-
P. Charan Jena, “Identification of crack in SiC composite polymer beam using vibration signature,” (in Chinese), Materials Today: Proceedings, Vol. 5, No. 9, pp. 19693–19702, Jan. 2018, https://doi.org/10.1016/j.matpr.2018.06.331
-
P. C. Jena, D. R. Parhi, and G. Pohit, “Dynamic investigation of FRP cracked beam using neural network technique,” Journal of Vibration Engineering and Technologies, Vol. 7, No. 6, pp. 647–661, Jul. 2019, https://doi.org/10.1007/s42417-019-00158-5
-
K. B. Saurav, Pp. C. Jena, and R. Dayal, “Design and analysis of a novel concept-based six-wheels rocker-bogie robot,” (in Chinese), Journal of Huazhong University of Science and Technology, Vol. 50, No. 4, pp. 1–20, 2021.
-
W. B. Lu and Z. Y. Tao, “Theoretical analysis of the pressure change history in pre-cracking blasting,” Tunnelling and Underground Space Technology, Vol. 1, No. 2, pp. 1–12, 1994.
-
J. C. Gao, “Theoretical and experimental study on the propagation of stress waves induced by blasting loads in rock masses,” (in Chinese), China University of Mining and Technology, Xuzhou, 1987.
-
P. Yan, T. Li, and W. B. Lu, “Characteristics of damage to surrounding rock induced by blasting excavation load in deep buried tunnels,” (in Chinese), Geotechnics, Vol. 34, pp. 451–457, 2013.
-
L. Haibo, X. Xiang, L. Jianchun, Z. Jian, L. Bo, and L. Yaqun, “Rock damage control in bedrock blasting excavation for a nuclear power plant,” International Journal of Rock Mechanics and Mining Sciences, Vol. 48, No. 2, pp. 210–218, Feb. 2011, https://doi.org/10.1016/j.ijrmms.2010.11.016
-
J. H. Yang, W. B. Lu, and M. Chen, “Equivalent simulation method for rock blasting excavation-induced vibration,” (in Chinese), Blast and Impact, Vol. 32, No. 2, pp. 157–163, 2012, https://doi.org/10.1088/1742-6596/1325/1/012140/pdf
-
X. P. P. Li, J. H. Chen, and Y. H. Li, “Study on the seismic effects of blasting in underground cavern groups of Xiluodu Power Station,” (in Chinese), Journal of Rock Mechanics and Engineering, Vol. 29, No. 3, pp. 494–500, 2010, https://doi.org/10.1007/s11771-023-5259-y.pdf
-
M. Y. Wang, H. M. Deng, and Q. H. Qian, “A study on the near-zone problem of intrusion and explosion in rocks,” (in Chinese), Journal of Rock Mechanics and Engineering, Vol. 24, No. 16, pp. 2859–2863, 2005.
-
S. Esen, I. Onederra, and H. A. Bilgin, “Modelling the size of the crushed zone around a blasthole,” International Journal of Rock Mechanics and Mining Sciences, Vol. 40, No. 4, pp. 485–495, Jun. 2003, https://doi.org/10.1016/s1365-1609(03)00018-2
-
M. Karuppiah, X. Li, and S. Ashraf Chaudhry, “Guest editorial of the special issue “remote sensing in water management and hydrology”,” European Journal of Remote Sensing, Vol. 54, pp. 1–5, Mar. 2021, https://doi.org/10.1080/22797254.2021.1892335
-
J. Du, T. He, Y. Xiong, and R. Zheng, “Numerical simulation of damage characteristics of jointed rock under blasting load,” (in Chinese), IOP Conference Series: Earth and Environmental Science, Vol. 861, No. 7, p. 072136, Oct. 2021, https://doi.org/10.1088/1755-1315/861/7/072136
-
S. G. Chen, J. Zhao, and Y. X. Zhou, “UDEC modeling of a field explosion test,” Fragblast, Vol. 4, No. 2, pp. 149–163, Jun. 2000, https://doi.org/10.1076/frag.4.2.149.7451
-
P. Wang, T. Zhou, and X. F. Geng, “Numerical simulation study on the formation mechanism of multi-pore homogenous blast funnel,” Geotechnics, Vol. 1, No. 31, pp. 12–36, 2010, https://doi.org/10.3390/pr12020362
-
M. B. Liu, G. R. Liu, and K. Y. Lam, “Investigations into water mitigation using a meshless particle method,” Shock Waves, Vol. 12, No. 3, pp. 181–195, Nov. 2002, https://doi.org/10.1007/s00193-002-0163-0
-
D. Y. Shi, Y. C. Li, and S. M. Zhang, Explicit dynamic analysis based on ANSYS/LS-DYNA 8.1. (in Chinese), Tsinghua University Press, 2005, pp. 181–195.
-
J. P. P. Xu, “On a Kind of Introduction to General.,” (in Chinese), System, Vol. 7, No. 2, pp. 111–130, 1995.
-
L. H. Wen and C. Z. Huang, “System advantage analysis based on grey correlation analysis,” (in Chinese), Journal of Heilongjiang Engineering College, Vol. 17, No. 2, pp. 41–43, 2003, https://doi.org/10.1007/978-981-19-6160-1_2
-
J. L. Deng, Basic Methods of Grey Systems. (in Chinese), Wuhan: Huazhong University of Science and Technology Press, 2005, https://doi.org/10.1007/978-981-19-6160-1
-
S. Sahoo and P. C. Jena, “Effect of lamina orientation, crack severity, and fillers on dynamic parameters of hybrid composite cantilever beam with double transverse cracks,” Materialwissenschaft und Werkstofftechnik, Vol. 54, No. 6, pp. 737–750, Jun. 2023, https://doi.org/10.1002/mawe.202200205
-
T.-Y. Wu, N. Jiang, C.-B. Zhou, Y.-Q. Xia, Y.-Q. Zhang, and B. Zhu, “Analysis model for deformation mechanism of strip foundation of building: Considering shear effect of down-crossing tunnel under excavation,” (in Chinese), Journal of Central South University, Vol. 28, No. 8, pp. 2556–2573, Sep. 2021, https://doi.org/10.1007/s11771-021-4786-7
-
T. Wu, N. Jiang, C. Zhou, X. Luo, H. Li, and Y. Zhang, “Experimental and numerical investigations on damage assessment of high-density polyethylene pipe subjected to blast loads,” Engineering Failure Analysis, Vol. 131, p. 105856, Jan. 2022, https://doi.org/10.1016/j.engfailanal.2021.105856
About this article

The authors have not disclosed any funding.
The authors would like to thank the following people, who were of great support in carrying out this study: Tingting Ling, Bolun Ding, Tingyao Wu have all made important contributions to the paper, and we would like to thank them for their great help in the process of writing the manuscript.
The datasets generated during and/or analyzed during the current study are available from the corresponding author on reasonable request.
Tingting Ling, Bolun Ding carried out the main part of the field study, data analyses, figures elaboration and manuscript writing. Tingyao Wu participated in field study, data interpretation and discussion, and conclusion elaboration. Tingting Leng, Tingyao Wu contributed in the data processing and interpretation. All authors read and approved the final version of the manuscript.
The authors declare that they have no conflict of interest.
