Abstract
Construction blasting in a tunnel in deep-buried soft rock will undoubtedly influence the cross section of the tunnel. Taking the deep-buried soft rock tunnel as the research background, a field monitoring experiment of the tunnel blast-induced vibrations is carried out. The cross section was established using 5 monitoring points to collect the peak particle velocity (PPV) data and frequency spectrum data. The results show that the maximum horizontal radial component of the blast-induced vibration velocity is greater than the maximum vertical component in the deep soft rock tunnel, and the maximum vertical component is greater than the horizontal tangential component. Due to the presence of an inclined shaft, the high domain frequencies have an amplification effect on the tunnel, while low frequencies do not exhibit significant amplification effects.
Highlights
- The radial direction is the largest of the 3 directions, the horizontal tangential is the second largest, and the vertical vibration velocity is the smallest.
- We should pay attention to controlling the dosage and reducing the impact of the blast-induced vibration on the surrounding rock of the tunnel
- There are 2 distinct sub bands in the blast-induced vibrations, which are mainly concentrated in 50-100 Hz and 150 Hz. These occupy 80% of the total energy.
- The high-frequency partial seismic wave energy loss is greater, and the attenuation is fast. However, the low-frequency part of the energy loss is smaller, and the attenuation is slow.
1. Introduction
In recent years, with the gradual advance of infrastructure construction, tunnel construction has extended from plain areas to mountainous areas. In the process of tunnel excavation, drilling and blasting is the most widely used technique. The dynamic load of the tunnel excavation inevitably influences the surrounding rock.
Some research results on tunnel blast-induced vibrations have been obtained both at home and abroad. Xie et al. (2013) used a dynamic finite element method to establish a three-dimensional model and obtained the dynamic response of an existing tunnel that is above the new tunnel under different spacings, different lengths and different loads [1]. Li et al. (2008) carried out a series of studies on tunnel blasting construction and provided a reference for similar projects [2-4]. Fu et al (2011) studied the blast-induced vibration rules of the arch crown and upper and side surrounding rocks behind the tunnel face and provided three empirical formulas [5]. Shin et al. (2011) identified the effect of blast-induced vibrations on adjacent tunnels and proposed a preliminary guideline for evaluating the protection zone for the blast vibrations that is based on a parametric study of the blast location, tunnel depth, and amount of explosives [6]. Yu et al. (2014) monitored blast-induced vibrations in a tunnel, and established a 3D numerical model using ABAQUS to develop safety criteria [7]. Lamis et al. (2014) compared finite element model results with in situ measurements and made some recommendations [8]. Nateghi et al. (2011) analysed the influence of blasting in different rock formations using different detonation methods [9]. Lee et al. (2016) used UDEC to model the tunnel blasting procedure and investigated the attenuation of the wave propagation induced by the tunnel blasting [10]. Kim et al. (2015) adopted experimental and numerical methods to assess the controlling effect of abrasive water jet cutting on blast-induced ground vibrations during tunnel excavation. The results show that the abrasive water jet cutting method reduced the blast-induced ground vibrations and was more effective than the conventional drilling and blasting method in tunnel excavation [11].
Previous studies have focused on the blast-induced vibration effects on tunnels, without considering the blast-induced vibration of the cross section of a tunnel in soft rock, neither in the amplitude domain nor in the frequency domain. In transportation construction in the middle and western parts of China, the majority of the tunnels are soft rock tunnels. Due to the requirements of construction and aeration, the tunnel needs to contain an inclined shaft, and the cross section of the inclined shaft is particularly prone to damage and thus requires special attention. In this paper, field tests were carried out to analyse the soft rock tunnel blast-induced vibration effects and provide a reference for the future blasting of deep soft rock tunnels.
2. Tunnel geological conditions and field monitoring system
Majiashan tunnel is located on the left bank of the river in the northwest side of Hadapu town. The mileage of the centre of the tunnel is DK243+414, and the monitoring ranges from DK239+696 to DK247+132, 7436 m long. The maximum depth of the tunnel is 494 m, and the minimum depth is 42 m. The entrance and exit of the tunnel are located in the bedrock weathering layer, and the natural slope of the tunnel outlet is approximately 40°-60°. The tunnel passes through a stratum that is mainly carbonaceous phyllite with a valley and a slope, and its crest is covered with a quaternary Holocene slope area of sandy loess, diluvial macadam soil, and alluvial gravel soil on the slope surface of the inclined shaft import. The lithology of tunnel face is phyllite and flaggy structure, and is characterized by developed joints and fissures, fractured rock formations and very poor stability (Fig. 1).
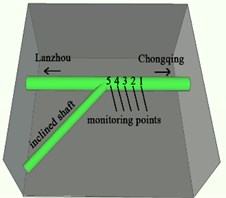
Referring to the arrangement of the monitoring system of Wang et al. [12], the monitoring system is arranged at the bottom of the tunnel with 5 monitoring points (Fig. 2). The distance between adjacent monitoring points is 90 m. Among them, the No. 5 monitoring point is the closest to the cross section of the tunnel, and the No. 1 monitoring point is the farthest. The monitoring time duration was half a month, and the monitoring frequency was once per day. The blasting excavation uses wedge cutting. The depth of the cutting hole (vertical depth) is 2.5-2.6 m. The diameter of the hole is 40 mm, and it holds a 35 mm×200 mm×240 g Explosive volume. The number of circulation blast holes is 84, and the circulating consumption of explosives is 40 kg. The maximum single detonation charge is 12-17 kg.
Fig. 1Surrounding rock of tunnel face
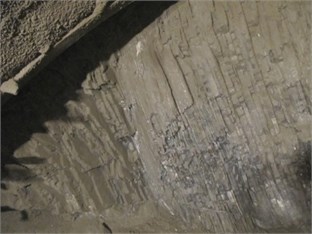
Fig. 2Layout of monitoring points
3. Monitoring data analysis
Based on the measured data, the linear correlation between the blast-induced vibration velocity and the core distance is established. Using the least squares method, the parameters used in the regression analysis are shown in Table 1.
Zhang et al. (2008) [13] studied the vibration characteristics and variation of the partition wall and the blasting face of the small-pitch tunnel. Lai et al. (2016) [14] studied the characteristics and diffusion law of vibration response of subway tunnel structures. Xu et al. (2017) [15] used wireless network systems to monitor the effects of train-induced vibration on slope stability. Combining these research results, the monitoring data were analysed and compared, and several groups with better correlation are shown in Table 2 and Figs. 3-6.
Table 1Blasting regression parameter table
Date | Monitoring point | ||||||||
Aug. 25 | 1 | 40 | 2180 | 2.17 | –2.80 | 0.34 | 7.86 | 0.11 | –0.94 |
2 | 40 | 2270 | 2.28 | –2.82 | 0.36 | 7.96 | 0.13 | –1.01 | |
3 | 40 | 2360 | 2.33 | –2.84 | 0.37 | 8.06 | 0.13 | –1.04 | |
4 | 40 | 2450 | 2.22 | –2.86 | 0.35 | 8.15 | 0.12 | –0.99 | |
5 | 40 | 2540 | 2.51 | –2.87 | 0.40 | 8.24 | 0.16 | –1.15 | |
Aug. 27 | 1 | 40 | 2190 | 2.32 | –2.81 | 0.36 | 7.88 | 0.13 | –1.02 |
2 | 40 | 2280 | 2.29 | –2.82 | 0.36 | 7.97 | 0.13 | –1.01 | |
3 | 40 | 2370 | 2.30 | –2.84 | 0.36 | 8.07 | 0.13 | –1.03 | |
4 | 40 | 2460 | 2.25 | –2.86 | 0.35 | 8.16 | 0.12 | –1.00 | |
5 | 40 | 2550 | 2.43 | –2.87 | 0.38 | 8.25 | 0.15 | –1.11 | |
Aug. 28 | 1 | 40 | 2195 | 2.22 | –2.81 | 0.35 | 7.88 | 0.12 | –0.97 |
2 | 40 | 2285 | 2.25 | –2.82 | 0.35 | 7.98 | 0.12 | –0.99 | |
3 | 40 | 2375 | 2.28 | –2.84 | 0.36 | 8.07 | 0.13 | –1.02 | |
4 | 40 | 2465 | 2.31 | –2.86 | 0.36 | 8.17 | 0.13 | –1.04 | |
5 | 40 | 2555 | 2.50 | –2.87 | 0.40 | 8.26 | 0.16 | –1.14 | |
Aug. 29 | 1 | 40 | 2200 | 2.20 | –2.81 | 0.34 | 7.89 | 0.12 | –0.96 |
2 | 40 | 2290 | 2.26 | –2.83 | 0.35 | 7.99 | 0.13 | –1.00 | |
3 | 40 | 2380 | 2.32 | –2.84 | 0.37 | 8.08 | 0.13 | –1.04 | |
4 | 40 | 2470 | 2.31 | –2.86 | 0.36 | 8.17 | 0.13 | –1.04 | |
5 | 40 | 2560 | 2.44 | –2.87 | 0.39 | 8.26 | 0.15 | –1.11 |
Table 2Blasting parameters and vibration monitoring results
Date | Monitoring point | Horizontal distance between blasting centre and measuring point / m | Blasting parameters | Vibration velocity | |||
Total assembly charge / kg | Charge quantity per detonation period / kg | Maximum horizontal radial component / cm⋅s-1 | Maximum horizontal tangential component / cm⋅s-1 | Maximum vertical component / cm⋅s-1 | |||
Aug. 25 | 1 | 2180 | 96 | 40 | 1.354 | 1.148 | 1.248 |
2 | 2270 | 96 | 40 | 1.347 | 1.295 | 1.310 | |
3 | 2360 | 96 | 40 | 1.446 | 1.242 | 1.339 | |
4 | 2450 | 96 | 40 | 1.348 | 1.208 | 1.285 | |
5 | 2540 | 96 | 40 | 1.490 | 1.398 | 1.460 | |
Aug. 27 | 1 | 2190 | 96 | 40 | 1.394 | 1.297 | 1.320 |
2 | 2280 | 96 | 40 | 1.383 | 1.234 | 1.340 | |
3 | 2370 | 96 | 40 | 1.386 | 1.264 | 1.330 | |
4 | 2460 | 96 | 40 | 1.374 | 1.239 | 1.272 | |
5 | 2550 | 96 | 40 | 1.473 | 1.304 | 1.420 | |
Aug. 28 | 1 | 2195 | 96 | 40 | 1.310 | 1.239 | 1.300 |
2 | 2285 | 96 | 40 | 1.330 | 1.236 | 1.329 | |
3 | 2375 | 96 | 40 | 1.375 | 1.229 | 1.349 | |
4 | 2465 | 96 | 40 | 1.389 | 1.285 | 1.328 | |
5 | 2555 | 96 | 40 | 1.494 | 1.364 | 1.470 | |
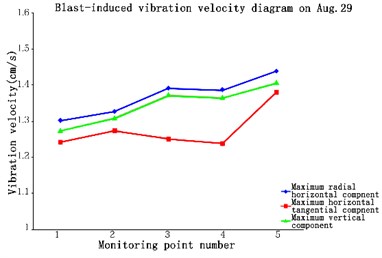
Aug. 29 | 1 | 2200 | 96 | 40 | 1.301 | 1.242 | 1.274 |
2 | 2290 | 96 | 40 | 1.327 | 1.274 | 1.309 | |
3 | 2380 | 96 | 40 | 1.392 | 1.250 | 1.373 | |
4 | 2470 | 96 | 40 | 1.386 | 1.238 | 1.365 | |
5 | 2560 | 96 | 40 | 1.439 | 1.380 | 1.407 | |
From Figs. 3-6, we can see that in the tunnel blasting test, there are 3 direction components for the blast-induced vibration velocity. The maximum horizontal radial component is greater than the maximum vertical component, and the maximum vertical component is greater than the maximum horizontal tangential component. The radial and tangential velocities have a direct impact on the surrounding rock and the initial support, so the horizontal radial velocity can be used as the safety evaluation index of the tunnel blast-induced vibration. In addition, the blast-induced vibration velocity of the No. 5 monitoring point is greater than that of all the other monitoring points in the 3 direction components. Some reports in the literature also present this phenomenon. Lai et al. (2015) [16] studied the effects of vibrations caused by explosions on existing tunnel structures. As the No. 5 measuring point position is along an inclined shaft, the first direct wave encounters the inclined shaft and produces reflection, which leads to the reflected wave and the subsequent arrival of the seismic wave to form a superposition, resulting in an amplification effect at the No. 5 monitoring point.
Fig. 3Blast-induced vibration velocity diagram on Aug 25
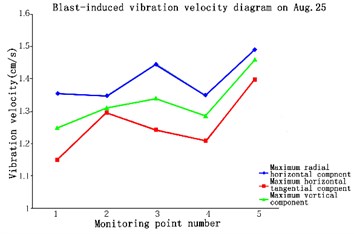
Fig. 4Blast-induced vibration velocity diagram on Aug 27
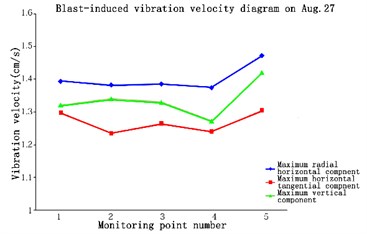
Fig. 5Blast-induced vibration velocity diagram on Aug 28
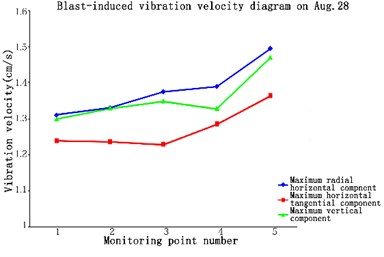
Fig. 6Blast-induced vibration velocity diagram on Aug 29
Referring to the literature of Zhang et al. (2008) [17], the power spectrum analysis extracts the frequency domain characteristics of the signal according to the energy of the different frequencies, determining the frequency in response to the main energy of the vibration signal to scientifically carry out the design, determine the amount of the section, select an appropriate blasting method and calculate the safety distance from the blast-induced vibration.
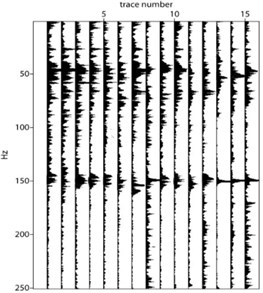
In Fig. 7, the blast-induced vibrations are mainly distributed at 80 Hz and 110 Hz. In Fig. 8, the blast-induced vibrations are mainly distributed at 50-100 Hz and 150 Hz; In Fig. 9, the blast-induced vibrations are mainly distributed in 50-100 Hz. In Fig. 10, the blast-induced vibrations are mainly distributed at 50-100 Hz and 150 Hz. In Fig. 11 the blast-induced vibrations are mainly distributed at 60 Hz and 120 Hz. In Fig. 12, the blast-induced vibrations are mainly distributed at 50 Hz and 150 Hz.
Through the analysis and comparison of these spectra, we can obtain a regular pattern:
1. There are 2 distinct sub bands in the blast-induced vibrations that are mainly concentrated in 50-100 Hz and 150 Hz. They occupy 80 % of the total energy.
2. Figs. 7-12 show that the high-frequency partial seismic wave energy loss is great and the attenuation is fast. However, the low-frequency part of the energy loss is smaller, and the attenuation is slow.
Fig. 7Chongqing direction spectrum on August 15th
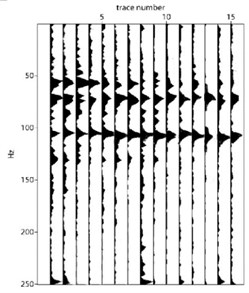
Fig. 8Chongqing direction spectrum on August 17th
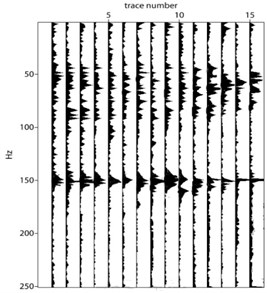
Fig. 9Chongqing direction spectrum on August 19th
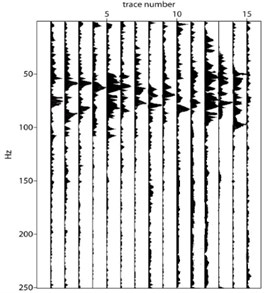
Fig. 10Chongqing direction spectrum on August 25th
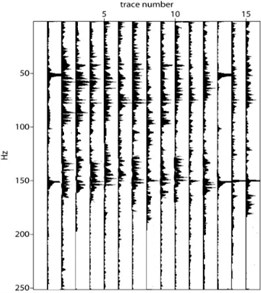
Fig. 11Chongqing direction spectrum on August 27th
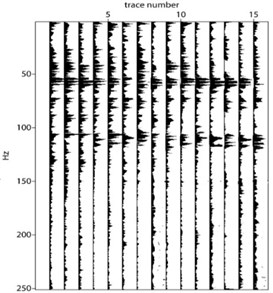
Fig. 12Chongqing direction spectrum on August 29th
4. Conclusions
1. The blast-induced vibration test results show that the radial direction is the largest of the 3 directions, the horizontal tangential is the second largest, and the vertical vibration velocity is the smallest. Therefore, it is suggested that the horizontal radial velocity can be used as the safety evaluation index of the tunnel blast-induced vibration.
2. Due to the existence of an inclined shaft, the blast-induced vibration has an amplification effect in the cross section. Therefore, in the cross section of the blasting construction, we should pay attention to controlling the dosage and reducing the impact of the blast-induced vibration on the surrounding rock of the tunnel.
3. There are 2 distinct sub bands in the blast-induced vibrations, which are mainly concentrated in 50-100 Hz and 150 Hz. These occupy 80 % of the total energy.
4. The high-frequency partial seismic wave energy loss is greater, and the attenuation is fast. However, the low-frequency part of the energy loss is smaller, and the attenuation is slow.
References
-
Xie X. F., et al. Study on the influence of blast-induced vibration on the existing tunnel under the crossing of the tunnel. Journal of China and Foreign Highway, Vol. 33, 2013, p. 208-212.
-
Li L. P., et al. Monitoring blasting excavation of shallow-buried large-span tunnel and vibration reduction technology. Rock and Soil Mechanics, Vol. 29, Issue 8, 2008, p. 2292-2296.
-
Li L. P., et al. Rock stability analysis and site monitoring of mechanical behavior for excavation of closely adjacent tunnels. Rock and Soil Mechanics, Vol. 27, 2006, p. 333-338.
-
Li L. P., et al. Analysis of dynamic response on blasting excavation of close-spaced tunnel. Journal of Highway and Transportation Research and Development, Vol. 27, 2008, p. 333-338.
-
Fu H. X., et al. Study of blasting vibration test of area near tunnel blasting source. Chinese Journal of Rock Mechanics and Engineering, Vol. 30, 2011, p. 335-340.
-
Shin J. H., et al. Effect of blast-induced vibration on existing tunnels in soft rocks. Tunnelling and Underground Space Technology, Vol. 26, 2011, p. 51-61.
-
Yu H. T., et al. Evaluation of influence of vibrations generated by blasting construction on an existing tunnel in soft soils. Tunnelling and Underground Space Technology, Vol. 43, 2014, p. 59-66.
-
Lamis A., et al. Vibration vulnerability of shotcrete on tunnel walls during construction blasting. Tunnelling and Underground Space Technology, Vol. 42, 2014, p. 105-111.
-
Nateghi R. Prediction of ground vibration level induced by blasting at different rock units. International Journal of Rock Mechanics and Mining Sciences, Vol. 48, 2011, p. 899-908.
-
Lee J. S., et al. Attenuation of blast vibration in tunneling using a pre-cut discontinuity. Tunnelling and Underground Space Technology, Vol. 52, 2016, p. 30-37.
-
Kim J. G., et al. Abrasive water jet cutting methods for reducing blast-induced ground vibration in tunnel excavation. International Journal of Rock Mechanics and mining Sciences, Vol. 75, 2015, p. 147-158.
-
Wang H. B., et al. Study of blasting vibration character of soft rock roadway excavation in coalmine. Yanshilixue Yu Gongcheng Xuebao/Chinese Journal of Rock Mechanics and Engineering, Vol. 31, Issue 2, 2012, p. 3876-3881.
-
Zhang Q. S., et al. Experimental study of blasting dynamic vibration of closely adjacent tunnels. Rock and Soil Mechanics, Vol. 29, 2008, p. 2655-2666.
-
Lai J. X., et al. Vibration response characteristics of the cross tunnel structure. Shock and Vibration, Vol. 2016, 2016, p. 9524206.
-
Xu J. B., et al. Monitoring of train-induced vibrations on rock slopes. International Journal of Distributed Sensor Networks, Vol. 13, Issue 1, 2017, https://doi.org/10.1177/1550147716687557.
-
Lai J. X., et al. Blasting vibration monitoring of undercrossing railway tunnel using wireless sensor network. International Journal of Distributed Sensor Networks, Vol. 11, Issue 6, 2015, https://doi.org/10.1155/2015/703980.
-
Zhang X. M., et al. Study on blasting seismic dynamic effect for tunnels with close interval in bedded rock mass. Journal of Human University of Science and Technology (Natural Science Edition), Vol. 21, 2006, p. 70-74.
About this article

This work was partially supported by the National Key R&D Program of China (Nos. 2016YFC0802203), Project Mechanism of mega loess slope sliding and catastrophic effect on land reclamation project by gully-hill controlling supported by “National Natural Science Foundation of China” (No. 41790443), Guangxi Key Laboratory of Geomechanics and Geotechnical Engineering (15-KF-05), Zhejiang Collaborative Innovation Center for Prevention and Control of Mountain Geologic Hazards (PCMGH-2017-Z-01).
