Abstract
Maintaining the newness of a vehicle is currently significant concern for users and vehicle companies. The gap difference between interior and exterior trims plays a crucial role in the overall appearance of vehicles. Over time, the gap and flush parameters of these trims may change due to the movement of components, putting forward higher requirements for the assembly accuracy and reliability design of automotive products. This article presents a study where a test car is subjected to endurance vibration on a wheel-coupled vibration bench. Through measuring the changes in gaps and flushes between the exterior trim parts at different endurance mileage intervals, the variation patterns are obtained. Using dimensional engineering technology, the effects of durable vibration on the gaps and flushes of the vehicle's exterior trim parts were determined. This study provides a foundation for the design of new interior and exterior decoration parts in automobiles. It also offers valuable insights for product design, development, and quality improvement. Problems can be predicted in advance in the early stage of design, and closely coordinate various aspects of production and manufacturing to obtain products with higher standards, requirements, and quality.
1. Introduction
Currently, the automobile industry is developing towards interconnectivity, intelligence, and production automation. How to improve the market competitiveness of its products based on intuitive perception of the entire vehicle, while maintaining good quality throughout the entire life cycle of the product is an important issue for manufacturers and consumers. Then the high demands are put forward for the initial design and assembly quality and novelty of the product. Not only do we need to design a positioning reference system for the product and strictly control the consistency of production, but also need to evaluate the matching accuracy of each component during the lifecycle of the product. Improving the newness of a product can effectively ensure its quality throughout its lifecycle, and is also an important aspect of improving the product's resale value [1, 2].
This article focuses on the perception of the entire vehicle, starting from the most intuitive perspective of gaps and flushes, to study how to improve the perceived quality of the product throughout its entire life cycle, thereby enhancing the novelty of the product. Specifically, this study explains the impact of vehicle vibration durability on gaps and flushes between components from the perspectives of design and materials.
2. Materials and methods
2.1. Dimensional engineering technology
Dimensional Technical Specification (DTS) refers to the design requirements for the fit clearance and flush of exterior parts of a vehicle. With the continuous upgrading and iteration of automobile industry, automobile companies are paying more and more attention to vehicle DTS. DTS includes the requirements for gap, flush and tolerance. The angle is related to the gap, the alignment is related to the flush, and the parallelism and symmetry are related to the tolerance requirements [3, 4].
2.2. Gap definition
When the vehicle is fully assembled, the gap formed between two parts with a visually visible assembly relationship is called a gap. The gap is usually measured by a gap gauge and a feeler gauge [5].
2.3. Flush definition
When the vehicle is fully assembled, the height difference between the surfaces of two parts with a visually visible assembly relationship is called the flush. The measuring equipment is a differential ruler.
2.4. Vehicle DTS design
Vehicle DTS design is an important aspect of dimensional engineering technology. DTS is mainly used to describe the gaps, flushes or mutual relationships between the interior and exterior parts of a vehicle. It is a technical specification for the appearance quality of vehicles. It is usually expressed as: the design nominal value of the gap (or flush) and the tolerance requirement of the gap (or flush). It is an important indicator to measure the manufacturing quality of automobile appearance and also a reflection of the of vehicle dimensional engineering quality. In design and production, each vehicle manufacturer will propose its own standard value of clearance and flush based on its own design concept and manufacturing level [6]. Without the support of suppliers, it is impossible to achieve the quality requirements of external decorative components and the goals of vehicle DTS. In particular, the impact of large exterior decoration parts on vehicle DTS is significant, with front and rear lights and interior and exterior decoration systems being the most important [7].
Table 1 shows the reference values for the clearance design of the exterior components (mudguards) involved in this article. There is no unified reference value for component flush in the industry, and the corresponding reference value is not given here [8].
For models of the same level, the median value of the gap is related to the design and shape of the vehicle model, and is not the focus of evaluation. The amplitude of change is generally used as a standard to evaluate whether a test meets the requirements. Based on the current manufacturing capabilities of mainstream OEMs, combined with their own R&D and manufacturing capabilities and room for improvement, product design and R&D personnel can design a DTS that meets the company's characteristics, further improving the perception level of the vehicle and final assembly.
Table 1Passenger car fender clearance reference value (unit: mm)
Datum part | Related parts | A-class car | B-class car | C-class car | D-segment car |
Fender | Engine compartment cover | 5±1.5 | 4±1.5 | 3.51, 0 | 31, 0 |
Fender | Headlamp | 3±1.5 | 2±1.5 | 2±0.8 | 1±0.5 |
Fender | Front bumper | 1.50.7, 0 | 10.6, 0 | 0.50.5, 0 | 0.50.4, 0 |
Fender | Front door outer panel | 5±1.2 | 4.5±1 | 4±0.8 | 3.5±0.75 |
2.5. Test bench of wheel-coupled road simulation
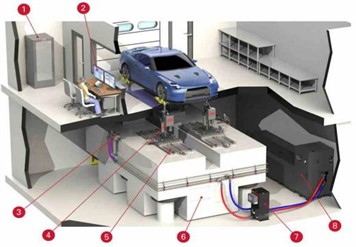
The test bench system (shown in Fig. 1) consists of a control system (controller, control computer), actuator (hydraulic actuator, etc.), and oil source system (hydraulic pump station, oil separator, etc.). In the test, the four wheels of the vehicle are carried by pallets mounted on the actuator, and the actuator provides a vertical load, which reproduces the load of the vehicle on the actual road surface in the vertical direction. The wheel-coupled road simulation test bench can reproduce the motion characteristics of the entire vehicle on actual roads and is widely used in reliability and durability verification, NVH. It has the characteristics of good reproducibility and is not affected by environmental and human factors [10, 11].
Fig. 1Schematic diagram of wheel couple test rig
2.6. Process of wheel-coupled road simulation test
2.6.1. Target signal collection and processing
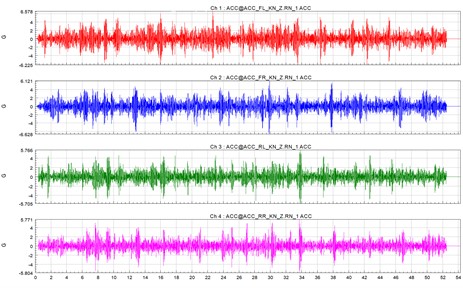
Four acceleration sensors are installed on the axle head of an A-class vehicle, and the vehicle is weighted according to test standards. After the signals collected at the test site are processed by de-drift, deburring, and filtering, the target signal that needs to be iterated is obtained. Fig. 2 only shows the axle head acceleration target signal on Belgian road surfaces.
Fig. 2Signal of Belgian road surfaces
2.6.2. Drive file development
To ensure that the final generated driving signal is relatively stable, the target signal is repeated multiple times.
For the system composed of actuator, suspension assembly and test bench, its transfer function has to be calculated. Then a random white noise signal is created first and the above signal has sufficient amplitude for each frequency to characterize the test system response . The parameters that need to be considered include the spectral amplitude of the signal. The white noise signal must be strong enough to excite the test system without damaging suspension assembly components. The system is excited by white noise signals and obtains the force value at the loading point from the actuator force sensor. The frequency response function using test bench system tools is calculated as follows:
Calculate the starting drive signal: use the test bench control software to perform a convolution operation on the inverse frequency response function () and the target road signal (). The result is the driving signal for the start of the iterative process:
Run the start drive signal and obtain the actuator response, and the measured value is defined as the output response .
Calculate the response error: the difference between the target load data and the output response is defined as the response error:
Calculate drive correction: the response error and the inverse function of the frequency response function are convolved to obtain the correction value of the drive signal. Before calculating the drive correction, the gain needs to be multiplied by the response error. There is also instability in the iterative process, and the gain is generally less than 1:
Calculate the next drive signal: add the drive correction value to the last drive signal to obtain the next drive signal:
The iterative process continues until the target loading curve is well reproduced on the bench.
3. Results and analysis
3.1. Durability test setup
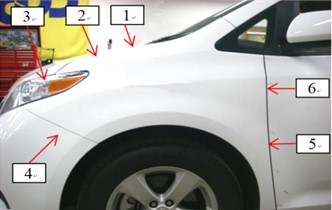
According to the proving ground road test standards, the drive file is played for 125 hours, and the corresponding bad road mileage is 8,000 kilometers, and the corresponding user road mileage is 300,000 kilometers. Therefore, the durable conditions of the vehicle throughout its life cycle can be effectively simulated. During the test, the gaps and flushes of the fender and its related components were measured every 25 hours, and the curve below was obtained. As shown in Fig. 3, we measured the flushes and gaps of the six points on fender.
Fig. 3Points measured on fender
3.2. Test results
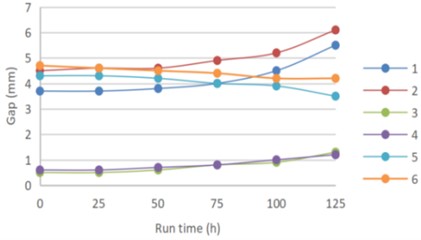
It can be seen from Fig. 4 that: (1) the vibration durability of the entire vehicle has an impact on the gaps between vehicle components. The gaps at different positions will increase or decrease with the vibration; (2) in durability of the vehicle, the gap changes between the reference fender, front hood and headlight is basically within the range of the design value, with little change amplitude. Referring to the gap variation range of the A-class vehicles, the gap change value is basically within the range of ±1.5 mm; (3) it is worth noting that as the durable vibration process progresses, the gaps at points 5 and 6 decreases. Combined with the gap changes of other related parts, it can be seen that the overall trend of the fender is decreasing and retreating; (4) it is recommended to add positioning buckles at the front to reduce the overall sinking trend of the fender.
Fig. 4Results of the flush data
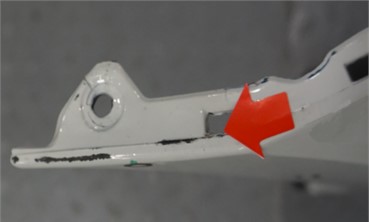
The parts to be inspected have been removed. The wear of the internal installation positions of the parts is shown in Fig. 5. It can be found that the internal buckle position is severely worn. Due to the wear of the buckle position, the gap between the parts will change. Before disassembling the, measurements were taken on the mounting bolts of the wheel cover and fender, it is found that the bolt torque decreased by 45 %. From this, it can be seen that this is also one of the reasons why the fender sank.
Fig. 5Details of wear at the buckle position
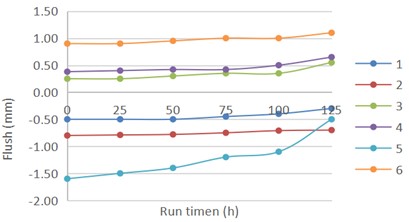
It can be seen from Fig. 5 that the vibration endurance process of the entire vehicle has a small impact on the flush, and the flush value generally increases.
4. Conclusions
The vibration durability of the entire vehicle will wear the contact surface between the connecting buckle and the parts, thereby affecting the gap and flush between the parts. Therefore, a reasonable buckle design can effectively improve the quality of products throughout their lifecycle and enhance their novelty.
Components involving bolt positioning or connection will experience torque attenuation during vibration. Controlling the torque attenuation of bolts during the vibration resistance process plays a certain role in effectively maintaining component gap and flush. Therefore, in the verification of interior and exterior products, bolt torque should also be a key inspection item for testing.
In fact, in the field of unified certification of automotive performance, we have durability testing and photo aging testing, but few researchers have studied the combination of these two tests and the mutual influence between them. The above studies attempted to search in relevant fields and completed validation tests.
References
-
K. Long, Q. Xie, D. Lu, Q. Wu, Y. Liu, and J. Wang, “Aircraft skin gap and flush measurement based on seam region extraction from 3D point cloud,” Measurement, Vol. 176, p. 109169, May 2021, https://doi.org/10.1016/j.measurement.2021.109169
-
E. K. Ishengoma and G. Gabriel, “Factors influencing the payment of costs of converting oil-to CNG-fuelled cars in a market dominated by used-cars,” Energy Policy, Vol. 156, No. 3, p. 112368, Sep. 2021, https://doi.org/10.1016/j.enpol.2021.112368
-
Y. Xue, “Research on optimization of vehicle interior and exterior decoration matching scheme of FAW Jilin Automobile Company,” Jilin University, 2023.
-
X. N. Liang, Z. B. Huang, Q. G. Pan, H. L. Zeng, and B. W. Tang, “Research on visual gap evaluation method of automobile static perception quality,” (in Chinese), Sci-Tech and Development of Enterprise, Vol. 12, pp. 42–44, 2020.
-
G. D. ’Emilia, A. Gaspari, C. Iavicoli, and E. Natale, “Measurement uncertainty estimation of gap and profile in the automotive sector,” Journal of Physics: Conference Series, Vol. 1589, No. 1, p. 012017, Jul. 2020, https://doi.org/10.1088/1742-6596/1589/1/012017
-
D. M. Chen, “Vehicle appearance DTS design and control analysis,” Automobiles and Accessories, Vol. 16, pp. 72–73, 2019.
-
X. H. Wang et al., “Engineering control scheme and application of vehicle front face sensing size,” Mechanical and Electrical Engineering Technology, Vol. 48, No. 3, 2019, https://doi.org/10.3969/j.issn.1009-9492.2019.03.009
-
S. B. Hu, Y. Y. Ma, and H. J. Wei, “Product quality control based on dimensional engineering,” Times Automobile, No. 10, 2021.
-
C. Du, “Design and evaluation of automobile static perception quality,” Machinery Industry Press, 2019.
-
Y. N. Wang, “Research on rectangular control strategy for wheel-coupled road simulation,” Harbin Institute of Technology, 2018.
-
V. P. Dhote, M. M. Lokhande, and S. C. Gupta, “Test bench setup for emulating electric vehicle on-road conditions,” Energy Reports, Vol. 9, pp. 218–227, Oct. 2023, https://doi.org/10.1016/j.egyr.2023.05.145.
About this article

The authors have not disclosed any funding.
The datasets generated during and/or analyzed during the current study are available from the corresponding author on reasonable request.
The authors declare that they have no conflict of interest.
