Abstract
For an in-wheel-motor drive electric vehicle, the driving motors are directly mounted in the wheels. Using this chassis structure, the road excitation can cause a magnet gap deformation in the motor. The magnet gap deformation will lead to magnetic force which not only has a negative impact on vehicle dynamics but also affects the magnet gap deformation in turn. To further analyze the impact of the road and the magnetic force on the motor magnet gap, a test platform was built, and used to simulate cases of road and composite excitation. The results show that 1) road excitation can cause motor magnet gap deformation, and when the excitation frequency is increased for a constant amplitude, the deformation degree also increases. 2) For the same road excitation frequency, the deformation degree increases with the motor speed. This not only proves the existence of the magnetic force but also indicates that the size of the magnetic force is related to the motor rotating frequency. 3) A comparison between the simulated and experimental results not only confirms the validity of the theoretical derivation and analysis but also lays the foundation for subsequent vibration control of in-wheel-motor drive electric vehicles.
1. Introduction
A distributed in-wheel-motor (IWM) drive system is an important development in the field of electric vehicle (EV) technology. In terms of dynamics, the differences between IWM drive EVs and conventional vehicles is summarized in four aspects:
1) With the removal of the mechanical differential, a control system is required to address the problem of speed differences between the wheels [1-3];
2) The rotational speed and torque of the wheels are independent of each other, which is radically different from a vehicle receiving its drive force distribution using a traditional mechanical transmission [4-7];
3) An IWM drive vehicle generally uses an independent suspension system. The vehicle’s vibration amplitude is increased in the vertical direction due to the increase in its unsprung mass, which affects tire adhesion. This not only affects vehicle control negatively but also decreases the vehicle smoothness and comfort [8-10];
4) Under normal conditions, with the IWM integrated inside the wheel, the IWM stator is fixed on the hub axle, the IWM rotor is supported on the axle by the bearings, and the rotor drives the vehicle via a speed reducer or is directly connected to the wheel rim [11-13]. Theoretically, the geometric centre of the stator and rotor should be the same as that of the wheel. However, the IWM magnet gap is usually unevenly distributed around the circumference due to the road surface roughness (RSR) excitations, uneven loads, and other reasons [14, 15]. The magnet gap deformation (MGD) can cause unbalanced magnetic force (UMF), which can not only be transmitted to the wheel and vehicle body but also further affects the magnet gap deformation, which has a negative impact on vehicle dynamics in turn.
Presently, the research on the IWM driven EVs is still in its infancy. The first and second aspects described above are fairly healthy research areas. However, there has been less research on the third aspect mentioned above, whereas the fourth issue has not been fully noted in the research field. Additionally, there is only limited literature on the problem of an uneven motor magnet gap. In [16], elastic components are considered for placement between the IWM rotor and wheel rim to reduce the effect of the RSR excitation on the IWM. Unfortunately, only a few possible structures are proposed, and no specific analysis is provided. In [17], the problem of the motor MGD caused by the RSR excitation is preliminary analysed based on a special operation condition in the time domain using a B class road displacement spectrum when the vehicle speed is 60 km/h. However, the results indicate that the maximum motor MGD can reach 0.2 mm (the nominal motor magnet gap here is 1.5 mm), and the UMF caused by the MGD causes the root mean square (RMS) of the body vertical acceleration and tire dynamic load to increase by 1.07 % and 42.7 % respectively. As seen above, the motor UMF from the road excitation can affect the vehicle ride comfort and running safety significantly. However, the previous study uses only simulations for special excitation. To determine the impact that the rules of the excitation from the RSR and the UMF have on the motor magnet gap, further studies should be performed by using both theoretical analysis and experimental testing.
To focus on the issue above, a test platform was built that includes a prototype IWM drive system. This platform was used to simulate the cases of road and composite excitations (RSR and UMF) for undertake a theoretical analysis and experimental testing of the MGD. This paper is structured as follows. In Part 1, the theory of Maxwell stress tensor is used as a basis to derive the mathematical model for the magnetic force describing an IWM for even and uneven magnet gap conditions. In Part 2, an experimental test system is constructed to establish a vibration analysis model. In Part 3, these models are used with further studies on the effect that the road and composite excitations have on the motor magnet gap in a theoretical analysis and using bench-top test. Finally, Part 4 presents the conclusions.
2. Mathematical model of the UMF
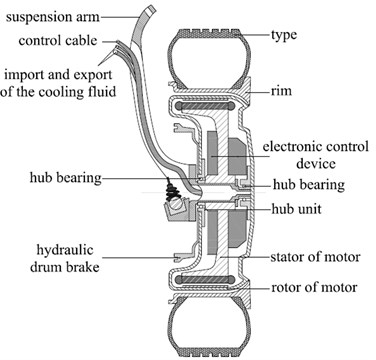
The basic structure of the IWM system is shown in Fig. 1 and it is composed of the IWM, rim, tire, brakes, hub bearing, etc. The IWM has an outer rotor and an inner stator. The rotor connects the rim to drive the vehicle, and the inner stator is fixed to the hub.
Fig. 1Basic structure of the electric wheel
2.1. The structure of the IWM
The IWM used in this paper is the permanent magnet synchronous motor (PMSM). The basic structure of the IWM is shown in Fig. 2. The insulation level of the IWM is . The IWM parameters are listed in Table 1. The stator winding is a three-phase Y-type, with 6 coils in series per phase, 31 turns per coil. The coils are in signal-layer chain connection.
Fig. 2The structure of the IWM
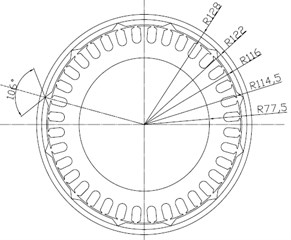
Table 1IWM parameters
Item | Symbol | Value |
Magnet gap thickness / (mm) | 1.5 | |
Rotor inner radius / (mm) | 229 | |
Constant magnet thickness / (mm) | 6 | |
Remanence / (T) | 0.98 | |
Slot number | 36 | |
Magnetic polar number | 6 |
2.2. Mathematical model of the UMF
When the impact of the core reluctance and the saturation effect are not taken into consideration in a sine-wave powered PMSM, the flux density can be expressed as [18, 19]:
where is the magnetomotive force (MMF); is the magnet gap permeance.
In order to obtain the flux density B, the following magnet gap permeance and the MMF must firstly be derived, as considered below.
2.2.1. Relative magnet gap permeance
For ideal motor operating conditions, the geometric centre of the rotor magnetic pole and the stator core should be the same, meaning that the length of the magnet gap is uniformly distributed along the circumference. However, in actual motor operations, the relative positions of the stator and rotor deviate from the ideal state due to factors such as manufacture installation and processing errors, shaft bending, relative rotor run-out, and bearing wear, which causes magnet gap deformation along the circumferential and axial directions. The IWM is a three-dimension object. Fig. 3 shows the circumference distribution of the length of the magnet gap in any one of the cross-sections ( plane) along the axial direction after the MGD is produced. As shown, the motor magnet gap is no longer distributed uniformly along the circumferential direction.
The function in Fig. 3 shows that the length of the even/uneven magnet gap of the motor at time can be specifically expressed as:
where is the nominal gap thickness; is the gap eccentricity in axial direction cross-section; is the motor mechanical rotating speed; is the rotor initial position.
The Fourier series of the magnet gap permeance during eccentricity is expressed as:
where is the air permeability; is the Fourier coefficient; is the Fourier series.
The Fourier coefficient in Eq. (4) is calculated by:
Then the relation curve between and can be obtained according to the above equations as shown in Fig. 4.
Fig. 3Motor MGD
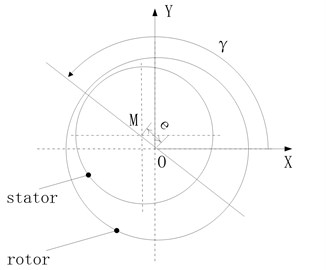
Fig. 4Relation between ε and Λλ'
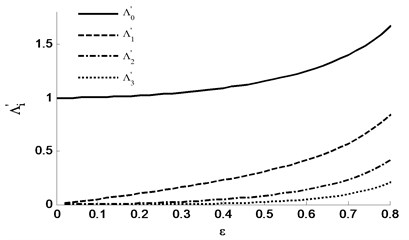
The above figure shows the change of each magnet gap permeance Fourier coefficient with the gap eccentricity in Eq. (5). As shown, all the coefficients increase with the motor eccentricity. And the coefficients decrease with the order under the same motor eccentricity . When is relatively small, the Fourier coefficient in each order can be expressed using the following equation:
After substitution of Eq. (6) into Eq. (4), the magnet gap permeance is expressed as:
2.2.2. Magnetomotive force of the IWM
2.2.2.1. Magnetomotive force of the permanent magnet
Based on the PMSM magnetic circuit analysis principle, a permanent magnet may be regarded as a constant source of MMF. The MMF of a rotor can be expressed as:
where is the thickness of the PM in the magnetization direction; is the amplitude of the order MMF.
2.2.2.2. Magnetomotive force of the stator winding
Based on motor theory, for motors driven by a three-phase sinusoidal current, the single-phase-winding fundamental magnet gap MMF can be expressed as:
where is the number of turns in series per phase; is the current effective value; is the winding factor of the first harmonic MMF.
The so-called fundamental wave with number of waves means that the number of other order harmonics correspondingly increases by times. The order harmonic of a single-phase winding MMF is expressed as:
where is the winding factor of the order harmonic MMF; is the winding pitch factor; is the winding distribution factor; is the winding pitch; is the polar distance; is the number of the slots per pole in one phase.
When a three-phase winding flows through a symmetrical three-phase current, then the three-phase winding MMF is superimposed to obtain the stator winding MMF via fundamental wave synthesis as:
The MMF synthesized by the order harmonic of a three-phase winding is:
The stator harmonic magnetic field contains an odd-order harmonic magnetic field when the slot number of per pole is an integer, that is, , where is the phase number of the IWM, 0, ±1, ±2, ±3…. For a three-phase winding ( 3), the harmonic order ( 1, 3, 5,…).
Then the MMF of the IWM can be synthesized as:
2.2.3. UMF models
After substitution of Eq. (7) and (18) into Eq. (1), the flux density is derived as:
Based on the Maxwell magnet stress tensor theory in 2D magnetic field, the radial and tangential magnetic force density under polar coordinate can be calculated by [20-22]:
where and are the radial and tangential magnet flux density on the gap circumference respectively.
Transforming the above magnetic force from polar coordinate to Cartesian coordinate, and taking account of the total axial magnetic force distribution, the force acting on the stator and rotor in y direction can be deduced by integrating on IWM axial gap length as:
where is the motor axial gap length and is the integral radius.
3. Test platform and vibration model
3.1. Test platform
An electric-wheel-based vibration performance test platform, as shown in Fig. 5, was built to simulate RSR and composite excitations to test the IWM MGD. An in-depth analysis of the rules describing the effect these excitations have on the magnet gap is investigated by using this platform.
3.2. Vibration model of the test system
Ignoring the influence of the bearing free gap and the lubricant membrane, and the bearing is taken as an equivalent spring-damper system in the vertical direction. Then the vibration model of the test system is constructed as shown in Fig. 6.
Fig. 5Test platform
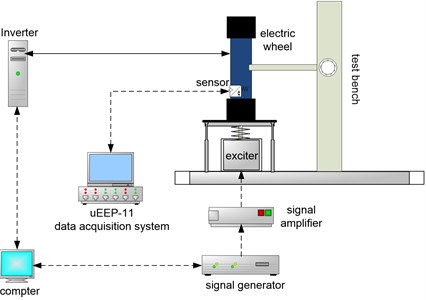
a) Schematic diagram of experiment set-up
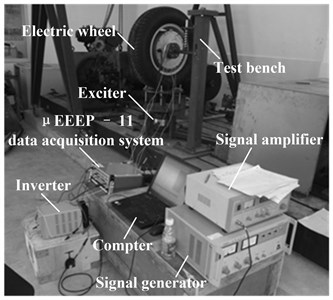
b) Experimental set-up
Fig. 6The system model
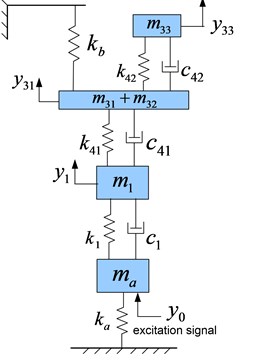
In Fig. 6, is the unsprung mass of the wheel; is the total mass of the knighthead and the hub; is the mass of stator and shell. is the mass of the rotor; is the mass of the wheel support disk; is the excitation single. is the corresponding vertical displacement of the masses, 1, 31, 33; is the stiffness of the tyre and the bearing respectively, 1, 4 ( 1, 2); is the damping of the tyre and the bearing respectively, 1, 4 ( 1, 2); and are the stiffness of the bench springs.
The vibration equation of the test system is:
where , , and are the mass matrix, mechanical damping matrix, mechanical stiffness matrix and external excitation force matrix.
The test system parameters are shown in Table 2.
Table 2System parameters
Variable | Value | Variable | Value |
/ (Kg) | 12.5 | / (N/m) | 70000 |
/ (Kg) | 4 | / (N/m) | 70000 |
/ (Kg) | 4 | / (N/m) | 7000000 |
/ (Kg) | 60.28 | / (N/(m/s)) | 0 |
/ (Kg) | 17.99 | / (N/m) | 15000000 |
/ (N/m) | 800000 | / (N/(m/s)) | 0 |
/ (N/(m/s)) | 100 |
4. Impact of the RSR and UMF on the motor magnet gap
The experiment was divided into two parts. In the first part, a vibration exciter was used to exert an exciting force on the wheel to simulate RSR. In the second part, during the no-load operation of the motor, the excitation signal from the vibration exciter was added to the supporting shaft of the motor to simulate a situation when RSR and UMF excitations occur simultaneously.
4.1. Impact of road excitation on the motor MGD
The vibration exciter was set at different frequencies with the same amplitude to perform sinusoidal excitations on the IWM drive system. Taking into account that the frequency range of the actual road excitation is generally stays within 35 Hz, the excitation frequency was set to be 2 Hz, 3 Hz, 4 Hz, 5 Hz, 6 Hz, 7 Hz, 8Hz, 12 Hz, 16 Hz, 20 Hz, 24 Hz, 28 Hz, 30 Hz, 35 Hz and 45 Hz to test the motor MGD and the vibration acceleration of the test bench, wheel rim, and stator [23]. Fig. 7 shows the collected signal from the MGD (relative displacement of the stator and rotor), the test bench vibration acceleration (TBVA), the rim vibration acceleration (RVA) and the stator vibration acceleration (SVA) in the time domain when the excitation frequency was 8 Hz (for the sake of brevity, the vibration signals from each component generated from the other excitation frequencies are not presented here). To clearly display each vibration signal, the time-domain waveform displays the results only for a section of the test period, with the actual test period lasting 30 s.
The time-domain signals in Fig. 7 show that the vibration acceleration from the test bench produces a large shock. As seen in Fig. 6, this is mainly due to the test bench is contacted with the exciter head. Here, the bench spring is always in contact with the test bench, and the tire is always in contact with the test bench. This is because of the preloaded bench spring. Only the exciter head simulating the road excitation may be separated from the test bench. This situation (where the exciter head separates from the test bench) simulates how the tire loses contact with the ground during driving. The difference is that the tire is flexible, but the test bench is rigid. Therefore, a large shock is produced when the exciter head contacts the test bench. The impact energy is absorbed by the tire once the vibration energy has been transmitted through the tire to the rim, with the vibration at the rim forming a regular sine wave. We used the amount of displacement at the rim as the input and the motor MGD as the output to examine the transmission characteristics of the system.
A Fourier transform was applied to each vibration response signal to obtain the amplitude-frequency characteristics of each vibration at the different excitation frequencies. In addition, during measurements of the IWM drive system vibrations, a non-contact displacement sensor was used to directly measure the relative displacement response of the stator and rotor of the motor, whereas a contact acceleration sensor was used to measure the vibration response of the test bench, wheel rim, and motor stator. The two frequency transformation relationships are:
where is the displacement response, is the acceleration response, and is the response frequency.
Fig. 7The test result in time domain
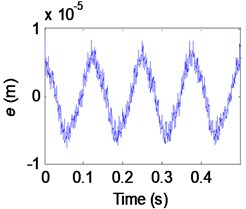
a) Magnet gap deformation
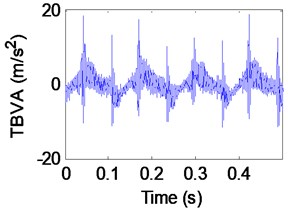
b) Test bench acceleration
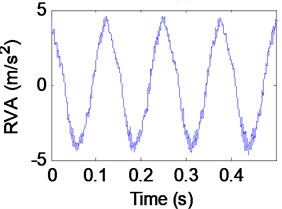
c) Rim vibration acceleration
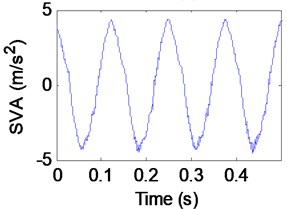
d) Stator vibration acceleration
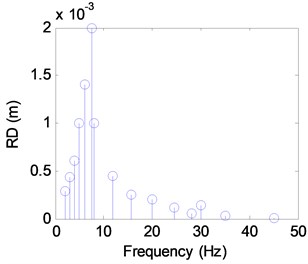
Since the signal obtained in the experiment inevitably contains noise, it is necessary to correct the discrete frequency spectrum obtained after the Fourier transformation. We used a four-point energy centrobaric correction method to correct the frequency and amplitude of each vibration response [24-25]. The obtained discrete frequency spectrum of the motor MGD and the rim displacement (RD) are shown in Figs. 8 and 9.
Fig. 8The discrete spectra of e
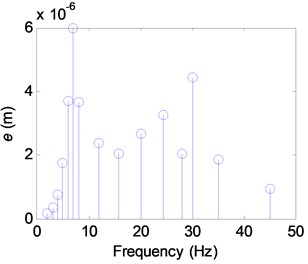
Fig. 9The discrete spectra of RD
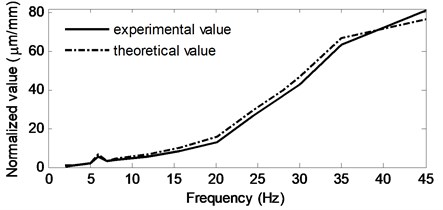
The actual detected excitation amplitude and the set value are not completely consistent in most cases, as there are various uncertainties in the experiment. Therefore, normalization of the motor MGD and the RD is performed. Simultaneously, to test the accuracy of the theory, the excitation signals were substituted into the system vibration equation in Section 2.2 to produce a simulated calculation. Normalized results from a comparison between the obtained from the simulation and the experiment are shown in Table 3 and Fig. 10.
From Table 3 and Fig. 10, some conclusions can be ascertained: 1) Although uncertainties in the experimental process led to some disagreement between the theoretical and experimental values, similar trends were observed in the theoretical and experimental results for the normalized values within the frequency range examined by the experiment, indicating that the theory is valid. 2) The normalized value increases with the excitation frequency, indicating that a higher excitation frequency at same amplitude causes a larger motor MGD. 3) At 6 Hz, the normalization trends upward in a similar way as the adjacent frequencies. We can preliminarily conclude that the excitation frequency is close to the natural frequency of the experimental IWM drive system. To verify this inference, the natural frequency of the IWM drive system at each order was calculated and found to be 5.9, 71.4, 132 and 169.1 Hz, respectively, meaning that frequency resonance does occur in the system for first-order frequencies.
Table 3Theoretical and experimental result under RSR
Excitation frequency / (Hz) | Normalized value | Excitation frequency / (Hz) | Normalized value | ||
Theoretical value | Experimental value | Theoretical value | Experimental value | ||
2 | 0.621 | 0.552 | 16 | 9.915 | 8.26 |
3 | 0.743 | 0.83 | 20 | 15.541 | 13.185 |
4 | 1.414 | 1.258 | 24 | 29.769 | 26.698 |
5 | 2.063 | 1.748 | 28 | 39.642 | 36.71 |
6 | 2.848 | 2.646 | 30 | 46.964 | 42.607 |
7 | 3.27 | 2.993 | 35 | 66.78 | 63.511 |
8 | 4.452 | 3.663 | 45 | 75.826 | 80.97 |
12 | 6.574 | 5.308 | |||
Fig. 10Theoretical and experimental results
4.2. Impact of composite excitation on the motor MGD
The actual vehicle uses an IWM for driving. As seen in the derivation in Section 1.2, the magnetic force of the IWM is related not only to factors such as its structure and rotation speed but also to the shape of the IWM system and its installation method, which can cause motor MGD. When a UMF caused by the MGD acts on the stator, rotor and associated components, it further increases the degree of the MGD, resulting in adverse effects on vehicle dynamics. Based on the first experiment, we examine the change seen in an IWM magnet gap for RSR and UMF excitations. The goal of this effort is to conduct a preliminary study on the impact that a composite excitation has on the magnet gap and simultaneously verify the results obtained by using the theory.
In this experiment, the IWM electric wheel was rotated, as the road excitation cannot be exerted directly on the tire due to experimental limitations. However, previous studies have shown that the maximum support shaft displacement can still reach as much as 0.0307 m for a B class RSR excitation when the vehicle speed is 60 km/h. Moreover, the excitation magnitude was 1 mm in this experiment. Therefore, our study simulated the loading signals from road was applied directly to the motor support shaft using the platform to lift the IWM drive system. In addition, there was no load applied on the IWM in this experiment. In reality, the IWM operates under a certain load. For a larger motor load, a stronger magnetic field is produced by the stator current to maintain a constant motor speed. Put another way, for the same MGD, the UMF of the motor load is larger than without according to Eqs. (1)-(22). Therefore, the impact with/without the load should be the same, even if the amplitude may be different. For the purposes of this experiment, this assumption is reasonable.
The control excitation frequencies for the vibration exciter were set to 2 Hz, 4 Hz, 8 Hz, 12 Hz, 16 Hz, 24 Hz, 28 Hz, 35 Hz and 45 Hz, respectively. For each excitation frequency, the motor was allowed to operate at 200 rpm and 800 rpm to measure the MGD, support shaft vibration acceleration (SSVA), SVA and exciter vibration acceleration (EVA). Figs. 11-14 show the measured signals when the excitation frequency was 8 Hz (for the sake of brevity, the vibration signals from each component generated by the other excitation frequencies are not presented here). To clearly present each vibration signal, the time-domain waveform shows only a section of the test period, with the actual test period lasting 30 s.
Fig. 11Test result of the magnet gap deformation
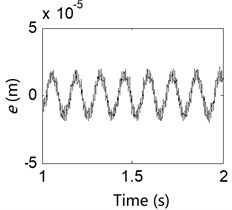
a) 200 rpm
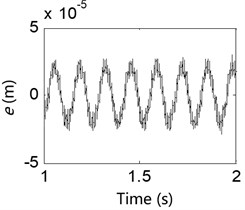
b) 800 rpm
Fig. 12Test result of the support shaft vibration acceleration
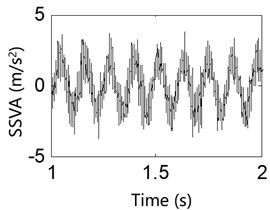
a) 200 rpm
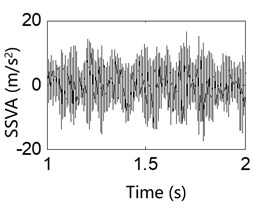
b) 800 rpm
Results from the 8 Hz excitation frequency test for various IWM rotation speeds are shown in Figs. 11-14 and indicate the followings: 1) The collected signals from the motor MGD show that an uneven magnet gap exists when the IWM is running, and the degree of unevenness in the magnet gap increases with the motor speed. This result shows that electromagnetic excitation created during operation of the IWM leads to the deterioration of the MGD. 2) Observations of various vibration signals from the system for the same excitation frequency show the followings: (i) When the IWM speed increases, the amount of vibration from the system components also increases, verifying that the electromagnetic excitation from the IWM is related to its rotation frequency. A greater rotation frequency causes an increased MGD. (ii) Under these two rotation speeds, the exciter acceleration signal contains many glitches, with the degree of vibration acceleration at 800 rpm being significantly larger than that at 200 rpm, indicating that the magnetic excitation is transmitted via the motor-supporting components and the wheel-rim transfer to the vibration exciter. This shows that for a vehicle operating in a real-world situation, the RSR will not only cause IWM MGD, but the UMF caused by the MGD will be transmitted to the wheel rim in turn, resulting in a negative impact on vehicle dynamics.
Fig. 13Test result of the stator vibration acceleration
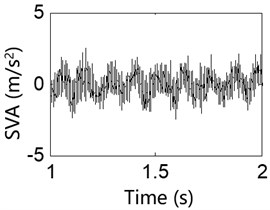
a) 200 rpm
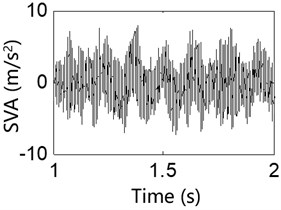
b) 800 rpm
Fig. 14Test result of the exciter vibration acceleration
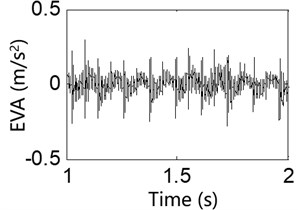
a) 200 rpm
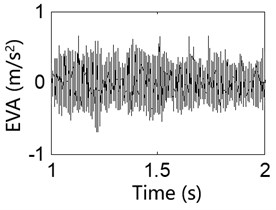
b) 800 rpm
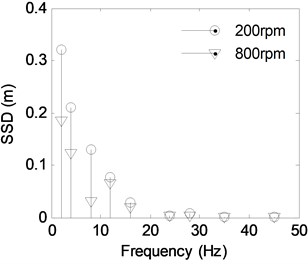
In order to obtain additional visually intuitive characteristic from the time-domain waveform, a similar spectral analysis was performed on the time domain signals collected from the various composite excitations. The corrected discrete amplitude spectrums from the MGD for various motor rotation speeds, and from the supporting shaft displacement (SSD), are shown in Figs. 15 and 16 for each excitation frequency of the IWM drive system.
Fig. 15The discrete spectra of e
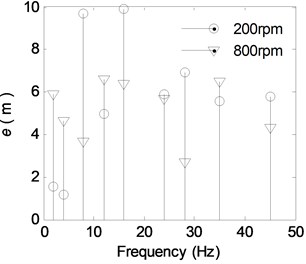
Fig. 16The discrete spectra of SSD
Normalization of the motor MGD and SSD are performed for comparisons. Simultaneously, the excitation signals are substituted into the system vibration equation in Section 2.2 to provide a simulated calculation. The normalized results from a comparison between the obtained transmission characteristics from the simulation and those from the experiment are shown in Table 4. The normalized experimental results for the different IWM speeds are shown in Fig. 17.
As seen in Fig. 17, the normalized value increases with the motor speed for the same RSR excitation frequency, indicating that a higher motor speed causes a larger motor MGD. The results not only confirm the existence of the UMF but also indicate the size of the UMF excitation is related to the rotation frequency of the IWM. Based on Eqs. (1)-(22), the UMF for the different motor speeds are calculated to be time-variable. However, the mean value of the UMF is proportional to its rotation speed, which has been verified by many studies [26].
Table 4Theoretical and experimental result under RSR and UMF with different IWM speed
Excitation frequency / (Hz) | Normalized value | |||
200 rpm | 800 rpm | |||
Theoretical value | Experimental value | Theoretical value | Experimental value | |
2 | 5.221 | 4.88 | 33.16 | 31.6 |
4 | 6.315 | 5.667 | 40.03 | 38.11 |
8 | 73.22 | 74.46 | 120.8 | 122.7 |
12 | 60.59 | 64.34 | 98.91 | 100.5 |
16 | 340.7 | 331.8 | 342.4 | 336.9 |
24 | 1468 | 1439 | 1875 | 1868 |
28 | 765.3 | 758 | 768.7 | 758.8 |
35 | 2622 | 2668 | 3647 | 3684 |
45 | 3092 | 3130 | 3294 | 3331 |
Fig. 17Experimental results with different IWM speed
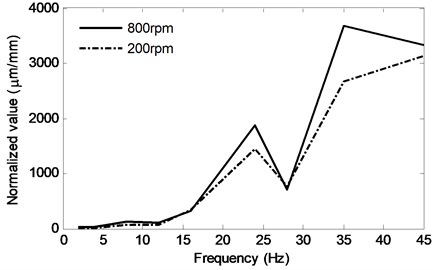
From the figure, we can also see that the normalized value increases at 24 Hz and after 35 Hz. The reasons for this, which are shown in the corrected discrete amplitude spectrum of the MGD in Fig. 15, are that the amplitude of the MGD has the same order of magnitude. From Fig. 16, we see that the SSD amplitude is relatively small at 24 and 35 Hz compared to the other amplitudes, causing an increase in the normalized value. The main reason for the decrease in the SSD is that there may be two excitations with the same frequency and different phases acting together on the supporting shaft. There is no doubt that the RSR excitation is one of the excitation sources. The other excitations should come from the UMF, which may have the same frequency harmonic as the RSR. The two excitation signals containing the same frequency superpose on the supporting shaft together, causing the supporting shaft to oscillate at the same frequency. However, the vibration amplitude decreases, as determined by the phase and amplitude of the two excitation signals. This analysis will be verified later using specialized testing.
5. Conclusions
To further analyze the impact of RSR and UMF excitations on the motor MGD, a functional test platform including a prototype IWM drive system was used for theoretical analysis and experimental testing. The platform was used to simulate different cases of road and composite excitations for the theoretical analysis and experimental testing of the motor MGD. Through this study, some conclusions can be deduced as follows:
1) The analysis under the road excitation shows that the RSR can cause motor MGD. And the normalized value increases with the excitation frequency, indicating that a higher excitation frequency at same amplitude causes a larger motor MGD.
2) An uneven magnet gap exists when the IWM is running, and the deformation degree increases with the motor speed. This result shows that electromagnetic excitation created during operation of the IWM leads to the deterioration of the MGD. This not only is confirmed by the existence of the UMF but also indicates that the size of the magnetic excitation is related to the rotating frequency of the IWM. A greater rotating frequency is linked to a greater MGD.
3) A comparison between the simulated and experimental results shows that the vibration tendency of the IWM drive system is the same regardless of the road or composite excitation source. This result not only confirms the validity of the theoretical derivation and analysis but also lays the foundation for subsequent vibration control of IWM drive EVs.
References
-
Lu Q. B., Ouyang M., Gu J., et al. Instantaneous optimal regenerative braking control for a permanent-magnet synchronous motor in a four-wheel-drive electric vehicle. Proceedings of the Institution of Mechanical Engineers, Part D: Journal of Automobile Engineering, Vol. 228, Issue 8, 2014, p. 894-908.
-
Chen Y., Wang J. Design and evaluation on electric differentials for overactuated electric ground vehicles with four independent in-wheel motors. IEEE Transactions on Vehicular Technology, Vol. 61, Issue 4, 2012, p. 1535-1542.
-
Wang R., Chen Y., Feng D., et al. Development and performance characterization of an electric ground vehicle with independently-actuated in-wheel motors Journal of Power Sources, Vol. 196, Issue 8, 2011, p. 3962-3971.
-
Pennycott A., Novellis L. D., Sabbatini A., et al. Reducing the motor power losses of a four-wheel drive, fully electric vehicle via wheel torque allocation. Proceedings of the Institution of Mechanical Engineers, Part D: Journal of Automobile Engineering, Vol. 228, Issue 7, 2014, p. 830-839.
-
Zhang L. P., Li L., Lin C., et al. Coaxial-coupling traction control for a four-wheel-independent-drive electric vehicle on a complex road. Proceedings of the Institution of Mechanical Engineers, Part D: Journal of Automobile Engineering, Vol. 228, Issue 12, 2014, p. 1398-1414.
-
Huang X. Y., Wang J. M. Model predictive regenerative braking control for lightweight electric vehicles with in-wheel motors. Proceedings of the Institution of Mechanical Engineers, Part D: Journal of Automobile Engineering, Vol. 226, Issue 9, 2012, p. 1220-1232.
-
Nam K., Fujimoto H., Hori Y. Lateral stability control of in-wheel-motor-driven electric vehicles based on sideslip angle estimation using lateral tire force sensors. IEEE Transactions on Vehicular Technology, Vol. 61, Issue 5, 1972, p. 1985-2012.
-
Huang X., Wang J. Lightweight vehicle control oriented modeling and payload parameter sensitivity analysis. IEEE Transactions on Vehicular Technology, Vol. 60, Issue 5, 2011, p. 1999-2011.
-
Luo Y. T., Tan D. Lightweight design of an in-wheel motor using the hybrid optimization method. Proceedings of the Institution of Mechanical Engineers, Part D: Journal of Automobile Engineering, Vol. 227, Issue 11, 2013, p. 1590-1602.
-
Siddiqui O. M. Dynamic analysis of a modern urban bus for assessment of ride quality and dynamic wheel loads. Masters Abstracts International, Vol. 8, Issue 27, 2009, p. 13-17.
-
Jacobsen B. Potential of electric wheel motors as new chassis actuators for vehicle manoeuvring. Proceedings of the Institution of Mechanical Engineers, Part D: Journal of Automobile Engineering, Vol. 216, Issue 8, 2002, p. 631-640.
-
Li X. H., Qian H. The present status and future trends of in-wheel motors for electric vehicles. Materials Science and Information Technology, Vol. 433, Issue 440, 2012, p. 6943-6950.
-
Masataka Y., Hiroshi F. Driving torque control method for electric vehicle with in-wheel motors. Electrical Engineering in Japan, Vol. 181, Issue 3, 2012, p. 49-58.
-
Li J., Cho Y. Dynamic reduction of unbalanced magnetic force and vibration in switched reluctance motor by the parallel paths in windings. Mathematics and Computers in Simulation, Vol. 81, 2010, p. 407-419.
-
Li J. T., Liu Z. J., Nay L. H. A. Effect of radial magnetic forces in permanent magnet motors with rotor eccentricity. IEEE Transactions on Magnetics, Vol. 43, Issue 6, 2007, p. 2525-2527.
-
Nagaya G. Fixing Method of In-Wheel Motor and In-Wheel Motor System. European Patent: EP 1380459 A1, 2004-01-14.
-
Luo Y. T., Tan D. Study on the dynamics of the in-wheel motor system. IEEE Transactions on Vehicular Technology, Vol. 61, Issue 8, 2012, p. 3510-3518.
-
Rasmussen K. F. Analytical prediction of magnetic field from surface mounted permanent magnet motor. IEEE International Electric Machines and Drives Conference, Vol. 34, 1999, p. 1999-36.
-
Babic S. I., Akiel C. Improvement of the analytical calculation of the magnetic field produced by permanent magnet rings. Progress in Electromagnetic Research C, Vol. 5, 2008, p. 71-82.
-
Zhu Z. Q., Howe D., Chan C. C. Improved analytical model for predicting the magnetic field distribution in brushless permanent-magnet machines. IEEE Transactions on Magnetics, Vol. 38, 2002, p. 229-238.
-
Proca A. B., Keyhani A., El Antably Lu A.-W., Dai M. Analytical model for permanent magnet motors with surface mounted magnets. IEEE Transactions on Energy Convers., Vol. 18, Issue 3, 2003, p. 386-391.
-
El Refaie A.-M., Jahns T. M., Novotny D. Analysis of surface PM machines with fractional-slot concentrated windings. IEEE Transactions on Energy Convers, Vol. 21, Issue 1, 2006, p. 34-43.
-
Yu F., Lin Y., et al. Vehicle System Dynamics. China Machine Press, Beijing, 2005.
-
Ding K., Jiang L. Q. Energy centrobaric correction method for discrete spectrum. Journal of Vibration Engineering, Vol. 14, Issue 3, 2001, p. 354-358.
-
Ding K., Cao D. D., Li W. H. An approach to discrete spectrum correction based on energy centroid. Key Engineering Materials, Vols. 321-323, 2006, p. 1270-1273.
-
Tang R. Y. Theory and Design for Modern Permanent Magnet Motor. China Machine Press, Beijing, 2006.
About this article

This research is supported by the National Natural Science Foundation of China (Grant No. 51405273 and Grant No. 51775320).
