Abstract
The conversion of mechanical vibrational energy into electrical energy to power wireless electronic devices using the smart material magnetic shape memory alloy (MSMA) has garnered substantial attention. This paper presents a vibration energy transducer founded on the inverse effect of MSMA, elucidating the principle of power generation. The variations in martensite and magnetic domain characteristics within MSMA were analyzed, and a constitutive model was established for the MSMA vibration energy transducer, integrating the thermodynamic theory of the Gibbs free energy function. Although this model performs well in predicting experimental outcomes, it falls short in capturing all features of the experimental data. To comprehensively encompass these features, the PSO-XGBoost machine learning approach was introduced to train the experimental data by incorporating factors such as stress, magnetic field, and induced voltage. An experimental prototype of the MSMA vibration energy transducer is fabricated, and the predictions of both models are compared with the collected experimental data, validating the accuracy of the model and indicating the enhanced effectiveness of machine learning methods in prediction. This research not only validates the correctness of the models but also emphasizes the potential for more precise predictions using machine learning methods, thereby establishing a robust foundation for the thorough study and broader application of MSMA vibration energy transducers.
1. Introduction
With the rapid advancement of micro-electro-mechanical systems and the Internet of Things, wireless sensor networks and various micro-sensors have experienced remarkable growth, promising wide-ranging applications in environmental monitoring, equipment surveillance, and demanding environments. However, a significant impediment to their development is the absence of a suitable substitute for chemical cells. Chemical cells possess limitations such as restricted battery capacity, size constraints, and replacement challenges within harsh environments. Consequently, there is a projected notion of harnessing ubiquitous vibrational energy from the environment and converting it into electrical energy, serving as a viable alternative to chemical cells across diverse applications [1-5].
Kangqi Fan et al. introduced a single-stable-state piezoelectric ceramic cantilever-type vibration energy harvesting system with a block-type damper at the free end [6]. Under an acceleration of 0.15 g, the maximum output power is approximately 0.055 mW. When subjected to a frequency of 100 Hz and an acceleration of 2.25 g, the output power was 70 µW. Mohammadi et al. [7] developed a magnetostrictive vibration generator that harnesses strain energy, establishing a model for the generator and analyzing its performance. Under base excitation, the generator achieves an output power of 9.4 mW. Prof. Bruno [8] harnessed the inverse effect of MSMA materials for vibration energy harvesting using a constitutive model based on MSMA thermodynamics to predict the potential of variants in reorienting induced voltage output. Sayyaadi [9] constructed an MSMA-based energy harvester, augmenting the maximum voltage acquisition power by 30 % within an improved system under a bias field of 0.55 T, revealing a nonlinear relationship between the acquisition voltage and the strain rate. Hassan Sayyaadi proposed a model for simulating the process of accessing magnetic shape-memory alloys during vibration energy acquisition. The data demonstrate that MSMA exhibits a fully reversible strain of 6 %, which can be enhanced to 10 % through the transformation of internal martensite via stress application or magnetic field alteration [10]. Its deformation and magnetoelectric conversion efficiency exceed those of PZT and magneto strictive materials. MSMA has emerged as an intelligent material with applications in energy harvesting, providing an effective avenue for vibration energy conversion-based power supply technology. In comparison with traditional vibration energy harvesting methods, MSMA has unique advantages in terms of its energy conversion mechanism, rapid response, high sensitivity, reliability, long lifespan, tunability, and flexibility. These characteristics endow MSMA with unique strengths in the energy harvesting field, and MSMA has tremendous potential for various applications.
The development of a comprehensive constitutive model is imperative to enhance the performance of MSMA vibration energy transducers. This model should possess the capacity to predict the behavior of MSMA under diverse magnetic-mechanical loading conditions. While Safari et al. [11] proposed a mathematically based model rooted in thermodynamics, it falls short in complying with all thermodynamic laws. To achieve more precise predictions of system output, a machine learning-based modeling approach was introduced [12-14]. Confronting the challenges posed by the nonlinear relationship between inputs and outputs, machine learning techniques demonstrate efficacy in predictive modeling. By constructing a prototype and collecting experimental data, a comparative analysis of the predictive capabilities of the two models is performed.
2. Working principle
The fundamental principle behind the vibration energy transducer lies in using the Villari effect in MSMA to convert vibrational energy into electrical energy. When an external stress deforms an MSMA, the material manifests an alteration in the external force as its own magnetic induction. Modifications in the magnetic flux traversing the coil circuit adhere to Faraday’s law of electromagnetic induction, resulting in an electromotive force appearing at both ends of the induction coil. The mechanism of the vibration energy transducer is depicted in Fig. 1. The MSMA material is enclosed within a protective sheath, with the external magnetic field orientation perpendicular to the MSMA’s long axis. The application of a top-down mechanical impulse to the MSMA material leads to changes in the permeability of the material, causing shifts in magnetic flux across the coil section and generating AC electromotive force on either side of the coil.
Fig. 1Schematic depiction of the mechanism of the MSMA vibration energy transducer
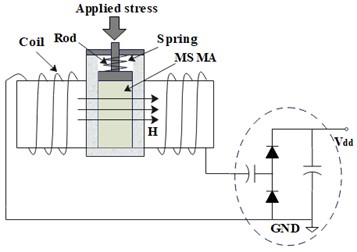
The electromotive force generated at both ends of the coil can be calculated through the application of the electromagnetic induction law:
where, is the electromotive force of the coil, is the magnetic induction through the coil in the magnetic circuit, represents the number of turns in the coil, is the cross-sectional area of the coil, is the magnetic field strength, is the magnetization of the MSMA, and is the vacuum permeability.
3. Constitutive model for the MSMA vibration energy transducer
In the presence of external stress and magnetic fields, martensitic phase transformations induced by stress and magnetic fields can be observed. The macroscopic strain response of MSMA can be linked to alterations in the microscopic structure of martensite variants, which relies on thermodynamic principles. A method grounded in thermodynamics is utilized to formulate expressions for material thermodynamic state parameters, including temperature, magnetic field intensity, magnetic crystal anisotropy, strain energy, interactions between domains, and interactions between variants [15-16]. These variables are described utilizing the Gibbs free energy function:
In this context, denotes stress, is the compliance tensor, represents anisotropic performance, and indicates the hardening functions. The induction of the magnetic shape memory effect resulting from the reorientation of martensite variants is captured by utilizing internal state variables, as visually depicted in Fig. 2.
Fig. 2Microscopic schematic detailing internal martensite variants and the magnetic domain structure within MSMA
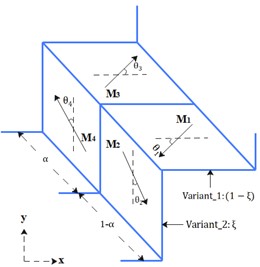
Within a two-dimensional context, martensite variants and two categories of magnetic domain structures coexist. Here, and represent the volume fractions of magnetic domains, and denote the volume fractions of the two variants, and ~ signifies the rotation angle of the magnetization vector from the axis of easy magnetization. Within this microstructural configuration, four discrete regions of magnetization arise, with the magnetization intensity vector for each region being designated:
In this context, represents the intensity of the saturation magnetization. The comprehensive intensity of magnetization for the material point is given by:
Subjected to a solitary magnetic field, the proportion of the magnetic domain implies the exclusive presence of the second magnetic domain. In other words, only the magnetization intensity vectors and exist. When a magnetic field is oriented along the y-axis, as delineated in Fig. 2, the alignment of the externally imposed magnetic field with the magnetic easy axis direction of variant 2 and the magnetization rotation angle when the material is under full tensile conditions. The external magnetic field prompts a deflection in the magnetization vector of variant 1 from its axis of easy magnetization, giving rise to an angle . By derivation, the internal rotation of magnetization can be expressed as:
where refers to the magnetic field applied along the y-direction and signifies the magnetic crystallographic anisotropy. The comprehensive intensity of magnetization for the material point can be established by summing the internal magnetization intensities and with Eq. (4):
Upon substituting Eq. (6) into the aforementioned equation, the expression for the material’s magnetization intensity is obtained:
Neglecting the impact of temperature fluctuations within a defined range, the internal magnetization intensity of the material increases with increasing externally applied stress. With the vibration energy transducer in motion and in consideration of the Villari effect, it becomes possible to formulate an equation for the magnetostriction model as:
where signifies the magnetostriction coefficient and represents the magnetic permeability in the axial direction. In accordance with electromagnetic principles, the formulation that delineates the connection between the magnetic field intensity along the central axis direction of the material’s length and the overall magnetization intensity is provided by:
where, represents the total applied magnetic field, encompassing both the externally applied bias field and the field arising from the induced current, , in the induction coil. The magnetic field stemming from the induced current in the induction coil is notably smaller than the bias field, rendering negligible. Thus, the total applied magnetic field on the MSMA can be simplified as .
By combining Eqs. (1), (8), and (10), a mathematical model is derived that has the potential to predict the electromotive force generated within MSMA materials when subjected to compressive loading under a bias magnetic field owing to alterations in magnetic induction intensity:
Under the assumption of straightforward loading conditions, specifically a consistent vertical bias field combined with fluctuating compressive stress, Eq. (12) becomes simplified to:
The results indicated that the design of a vibration energy transducer using MSMA can achieve the conversion of vibration energy into electrical energy. Wireless sensor networks and portable device technologies are currently being developed. Wireless sensor devices, characterized by their low cost, distributed operation, and low energy consumption, are gradually expanding from military applications to civilian domains. Currently, wireless sensors and implantable electronic devices are primarily powered by traditional batteries, which are detrimental to device continuity and battery replacement. Therefore, the use of MSMA vibration energy harvesters to collect ambient energy and power microdevices, such as sensors, can extend the usage cycle of wireless sensors and replace expensive and environmentally polluting traditional battery power methods.
4. Experimental prototype of the MSMA vibration energy transducer
The overall design of the MSMA vibration transducer structure was carried out based on the inverse characteristics of the MSMA, as shown in Fig. 3. This process primarily includes the design of the magnetic circuit, the induction winding, the preloading device, and the selection of permanent magnets. The overall system mainly includes a measurement system, an electromagnetic system, and an energy harvesting and processing system that generates an induced electromotive force across the induction coil to collect vibration energy.
Fig. 3Overall design of the vibration transducer system
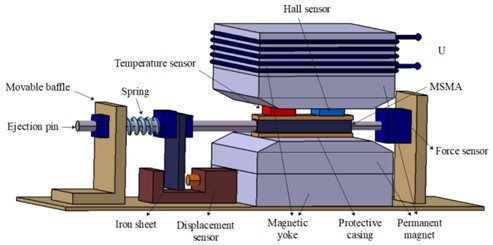
The vibrating transducer magnetic circuit is selected with silicon steel sheet material and adopts a parallel structure with two layers, which effectively reduces magnetic reluctance. In the process of magnetic circuit design, the permanent magnet can be treated as an equivalent voltage source with a magnetic potential of . The magnetic resistance in the circuit includes the air gap magnetic resistance and the magnetic resistance of the magnetic circuit (silicon steel sheet) . The magnetic electromotive force can be calculated using Eq. (14):
where, represents the number of turns of the coil, denotes the magnitude of the current flowing through the coil, represents the magnetic field strength in the air gap, and represents the length of the air gap. Furthermore, the magnetic flux passing through the MSMA material can be calculated by considering the magnetic resistances of the silicon steel sheets and the air in the magnetic circuit, as shown in Eq. (15):
The experimental parameters are presented in Table 1.
Table 1Experimental parameters
Parameter | Value | Parameter | Value |
1.9×10⁵ J/m3 | 6 % | ||
574360 A/m | 397500 A/m | ||
Induction coil turns | 500 | Material width | 5 mm |
Cross-sectional area of induction coil | 1256 mm2 | Material cross-sectional area | 100 mm2 |
4×10⁻⁷ N/A2 | 1.1×10⁻⁸ m/A |
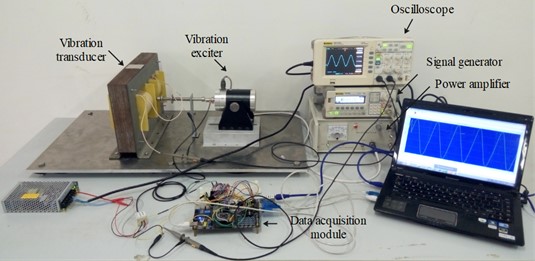
The MSMA material utilized in the experiment has dimensions of 5 mm×5 mm×20 mm. To gauge the magnetic induction intensity around the MSMA material within the vibration energy transducer, a Gauss meter is used. By employing force and displacement sensors, the applied stress and material deformation on the MSMA are observed. The imposition of mechanical stress on the MSMA material occurs through the preloading mechanism of the vibration energy transducer. This action induces deformation within the material, consequently causing a modification in the magnetic flux passing through the cross-sectional area of the induction coil. This alteration results in the generation of an alternating voltage at the extremities of the induction coil. Fig. 4 shows the experimental setup of the vibration energy transducer.
Fig. 4Experimental setup of the vibration energy transducer
5. PSO-XGBoost vibration energy transducer predictive model
Within the realm of thermodynamic modeling concerning vibration energy transducers, intricate interplay prevails among processes of magnetic, mechanical, and electrical energy conversion. Frequently, specific assumptions and simplifications are introduced to streamline mathematical analysis and simulation. However, these choices have the potential to influence the precision of forecasts pertaining to induced voltages. A predictive voltage model was developed through the application of machine learning methods to formulate a more sophisticated fitting model.
5.1. XGBoost algorithm
XGBoost, an advanced algorithm rooted in gradient boosting regression trees (GBRT), adeptly captures complex connections among features [17]. Notably skilled in predictive modeling and classification assignments, XGBoost uses a second-order Taylor expansion of the loss function and introduces regularization terms to attain globally optimal solutions, thus governing the overarching intricacy of the model. This strategy significantly improves the algorithm’s capacity for generalization.
Assuming a given dataset consisting of n samples, each composed of m features, and a set of regression trees denoted as , the model can be represented as follows:
The objective function is defined as follows:
By substituting Eq. (17) into Eq. (16), the objective function for the -th iteration can be computed in a subsequent manner:
The objective function is expanded using a second-order Taylor series approximation and augmented with a regularization term to prevent overfitting:
where, and denote the number of leaf nodes and the weight values of the leaves, respectively; is the leaf node penalty coefficient; and is the leaf weight penalty coefficient.
Owing to the multitude of parameters included in the XGBoost algorithm and the intrinsic variability inherent to the tuning process, parameter optimization becomes imperative for enhancing the precision of model classification predictions. Consequently, the Particle Swarm Optimization (PSO) algorithm, which is renowned for its ability to address multiparameter optimization challenges, is used to fine-tune the model parameters. This strategy endeavors to mitigate the uncertainty linked to parameter choice, thereby elevating the comprehensive performance of the model in predictive classification.
5.2. Particle swarm optimization algorithm
PSO is a collective intelligence algorithm fashioned upon the emulation of foraging patterns within bird flocks [18-19]. It has applications in system identification and control. The PSO algorithm conceptualizes the resolution of an optimization predicament as a quest for particles within a confined-dimensional space. These particles work to advance optimization by progressively moving toward more advantageous positions, guided by their personal best-known solutions, as well as the ultimate solution found within the particle swarm.
Assuming a search space with dimensions represented as , encompassing a total of m particles within the swarm, the position of the -th particle is denoted as vector , and its velocity vector is represented by . These two attributes collectively ascertain the flight position and trajectory of the i-th particle. The optimal position unveiled by the entire population is denoted as , where is the particle index, . Upon initializing the particle swarm, the PSO algorithm computes the fitness value of each particle and employs a continuous iterative process to seek the ultimate solution. Throughout each iteration, particles revise their velocity and position based on their individual best-known values and the global best-known value. The updated formulas are expressed as follows:
where, represents the iteration count, represents the inertia weight, and and represent random numbers within the range of [0, 1]. The parameters and , referred to as learning factors or acceleration coefficients, are also present.
5.3. Construction of the PSO-XGBoost model
Based on the principles of XGBoost and the theories underpinning the PSO algorithm, PSO is employed to enhance the parameters of the XGBoost classifier, thus leading to the formulation of a PSO-XGBoost model for predicting the output voltage of a vibration transducer. The procedure unfolds as follows:
1) The input data are collected, encompassing measurements of the stress, magnetic field, and corresponding output voltage data from the prototype of the MSMA vibration energy transducer. The dataset contains an ample quantity of samples, and the obtained experimental data are preprocessed through various stages. These include addressing missing values, scaling features, and implementing noise reduction for the sake of smoothing.
2) The data were divided into training and testing sets at a 7:3 ratio. Suitable fitness functions are defined, and the individual and global optimal values of particles are initialized for the purpose of parameter optimization.
Fig. 5PSO iteration process
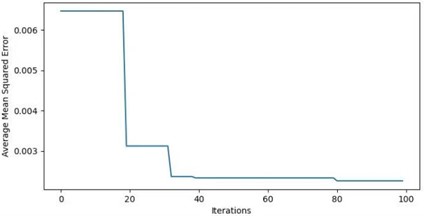
3) Iteratively update the particle velocities and positions and continuously update the individual best-known values and global best-known values by calculating their fitness scores until the criteria for iteration termination are met. The progression of the PSO iterations is shown in Fig. 5.
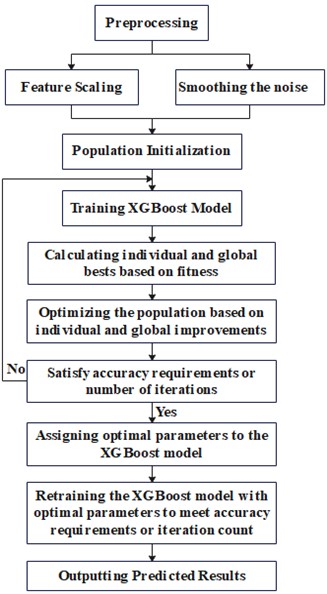
4) Select the most fitting parameter values for the construction of an XGBoost prediction model that has been refined through parameter tuning. The training dataset was used to facilitate the model’s training and learning processes. The specific sequence of actions is visually illustrated in Fig. 6.
Fig. 6Illustrates the step-by-step progression of the PSO-XGBoost vibration energy transducer output voltage prediction model
By employing machine learning methods, the response of the MSMA vibration energy transducer system is simulated. By utilizing the PSO-XGBoost algorithm, voltage prediction outcomes, depicted in Fig. 7, can be generated. By comparing the electromotive force obtained through experimentation with that predicted by the machine learning model across different frequencies and stress conditions, it is evident that the PSO-XGBoost model exhibits a significantly precise capacity to reproduce the experimental curve. When the input vibration stress frequency remains constant on the top rod of the generator, the amplitude of the induced voltage output increases with increasing vibration stress amplitude within a certain range, and the output-induced voltage curve shows an approximately sinusoidal waveform. When the amplitude of the input vibration stress applied to the transducer top rod remains constant, the value of the induced voltage output increases with increasing vibration stress frequency within a certain range, and the output-induced voltage curve also exhibits an approximately sinusoidal waveform, with the frequency changing with the frequency of the input vibration stress.
6. Simulated and experimental results
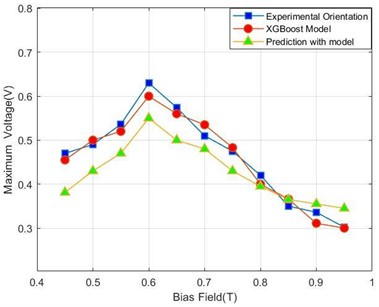
The magnitude of the peak voltage generated during martensitic reorientation depends upon various factors, including the loading frequency, cyclic strain amplitude, and strength of the bias magnetic field. The correlation between the peak-to-peak electromotive force and the bias magnetic field is illustrated in Fig. 8, which presents experimental results obtained with a loading frequency of 10 Hz and a load of 12 N.
Fig. 7Comparison between machine learning algorithms and experimental output-induced voltage
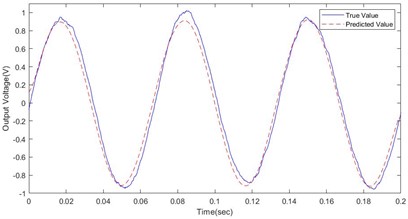
a) 12 N, 15 Hz
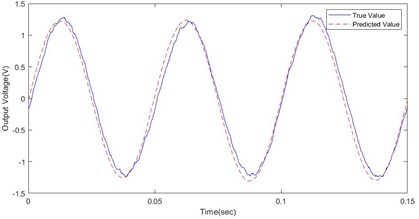
b) 12 N, 20 Hz
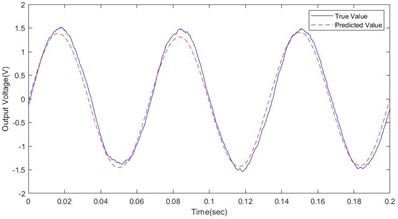
c) 20 N, 15 Hz
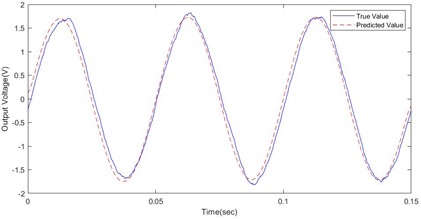
d) 20 N, 20 Hz
As discernible from Fig. 8, an optimal bias magnetic field value is evident of approximately 0.6 T in the context of the tested specimens. In vibration energy harvesting, there may be errors and uncertainties due to various factors, such as the accuracy of the measurement devices, variations in environmental conditions, and random noise. The reasons for these differences may stem from the limitations of the sample data, errors in the model parameters, and changes in the environmental conditions. When the bias magnetic field is 0.6 T, the output voltage obtained from the XGBoost model is 0.6 V, while the experimentally measured voltage output is 0.631 V, resulting in an error of 4.1 %. At the 95 % confidence level, the confidence interval for the maximum value of the output voltage is 0.591 (0.672). When the bias magnetic field is 0.7 T, the XGBoost model predicts an output voltage of 0.536 V, whereas the experimentally obtained voltage output is 0.51 V, resulting in an error of 4.8 % between the experimental and simulation results. The confidence interval for the maximum value of the output voltage is (0.471, 0.55). Experimental findings establish that while both the constitutive model and the machine learning model reasonably forecast the maximum induced voltage when compared to experimental values, discrepancies exist. Notably, the disparity between the PSO-XGBoost model and the predicted experimental curve is smaller than that of the constitutive model. This finding implies the superior predictive ability of the PSO-XGBoost model over the constitutive model in estimating the experimental curve.
Fig. 8Comparison chart of the peak-to-peak induced voltages during the reorientation process under a bias magnetic field
7. Conclusions
The main focus of this paper is on the modeling and experimental investigation of an MSMA vibration energy transducer. The paper examines the principles behind vibration power generation and establishes a constitutive model for this purpose. However, the constitutive models employed in this study exhibit limited accuracy in predicting induced voltage, thus constraining their effectiveness in design. Consequently, identifying the missing components necessitates substantial further investigation. To address this limitation, a machine learning model based on PSO-XGBoost is introduced. This is accompanied by the establishment of an experimental platform and the development of a mathematical model to quantitatively depict the output induced voltage of the MSMA vibration transducer under the combined influence of magnetic fields and vibrational stress. The conversion model involving magnetic, mechanical, and electrical energies is simulated and analyzed. Subsequently, the actual output values are juxtaposed against the predicted values derived from both models. The findings reveal a positive correlation between the amplitude of the output voltage of the vibration generator and the amplitude and frequency of the excitation force within specific ranges. Notably, the machine learning model exhibits greater accuracy in predicting this relationship, displaying smaller errors compared to the original constitutive model. Leveraging machine learning techniques in designing vibration energy harvesters reliant on MSMA lays a robust theoretical groundwork for research into vibration energy transducers. To obtain a more accurate model for induced voltage, future research needs to conduct experimental tests outside the laboratory environment and under more realistic application conditions.
References
-
A. J. Niskanen and I. Laitinen, “Design and simulation of a Magnetic Shape Memory (MSM) alloy energy harvester,” 4th International Conference on Smart Materials, Structures and Systems Symposium B, Vol. 78, pp. 58–62, Sep. 2012, https://doi.org/10.4028/www.scientific.net/ast.78.58
-
M. A. A. Farsangi, F. Cottone, H. Sayyaadi, M. R. Zakerzadeh, F. Orfei, and L. Gammaitoni, “Energy harvesting from structural vibrations of magnetic shape memory alloys,” Applied Physics Letters, Vol. 110, No. 10, p. 10390, Mar. 2017, https://doi.org/10.1063/1.4978258
-
H. Sayyaadi and M. A. A. Farsangi, “Frequency-dependent energy harvesting via magnetic shape memory alloys,” Smart Materials and Structures, Vol. 24, No. 11, p. 115022, Nov. 2015, https://doi.org/10.1088/0964-1726/24/11/115022
-
Q. Zhang, J. Yang, J. Yang, and K. Lin, “Research on a new electromechanical energy acquisition system,” in 2017 29th Chinese Control and Decision Conference (CCDC), pp. 6853–6857, May 2017, https://doi.org/10.1109/ccdc.2017.7978414
-
J. Lu and Z. Y. Guo, “Design and experimental study of magnetically controlled shape-memory alloy sensor,” IOP Conference Series: Materials Science and Engineering, Vol. 770, No. 1, p. 012048, Feb. 2020, https://doi.org/10.1088/1757-899x/770/1/012048
-
K. Fan, Q. Tan, H. Liu, Y. Zhang, and M. Cai, “Improved Energy harvesting from low-frequency small vibrations through a monostable piezoelectric energy harvester,” Mechanical Systems and Signal Processing, Vol. 117, No. 15, pp. 594–608, Feb. 2019, https://doi.org/10.1016/j.ymssp.2018.08.001
-
S. Mohammadi and A. Esfandiari, “Magnetostrictive vibration energy harvesting using strain energy method,” Energy, Vol. 81, pp. 519–525, Mar. 2015, https://doi.org/10.1016/j.energy.2014.12.065
-
N. M. Bruno, C. Ciocanel, H. P. Feigenbaum, and A. Waldauer, “A theoretical and experimental investigation of power harvesting using the NiMnGa martensite reorientation mechanism,” Smart Materials and Structures, Vol. 21, No. 9, p. 094018, Sep. 2012, https://doi.org/10.1088/0964-1726/21/9/094018
-
H. Sayyaadi, M. Mehrabi, and M. Hoviattalab, “Analysis and modification of a common energy harvesting system using magnetic shape memory alloys,” Journal of Intelligent Material Systems and Structures, Vol. 32, No. 5, pp. 568–583, Oct. 2020, https://doi.org/10.1177/1045389x20963174
-
H. Sayyaadi, H. Rostami Najafabadi, and M. A. Askari Farsangi, “Modeling and parametric studies of magnetic shape memory alloy-based energy harvester,” Journal of Intelligent Material Systems and Structures, Vol. 29, No. 4, pp. 563–573, Jun. 2017, https://doi.org/10.1177/1045389x17711817
-
O. Safari, M. R. Zakerzadeh, and M. Baghani, “Study of a magnetic SMA-based energy harvester using a corrugated structure,” Journal of Intelligent Material Systems and Structures, Vol. 32, No. 16, pp. 1855–1866, Jan. 2021, https://doi.org/10.1177/1045389x20983903
-
M. E. Emu, “Predictions of electromotive force of magnetic shape memory alloy (MSMA) using constitutive model and generalized regression neural network,” Smart Materials and Structures, Vol. 32, No. 2, p. 025018, Feb. 2023, https://doi.org/10.1088/1361-665x/acb2a1
-
Z. Zhang, Q. Liu, and D. Wu, “Predicting stress-strain curves using transfer learning: Knowledge transfer across polymer composites,” Materials and Design, Vol. 218, p. 110700, Jun. 2022, https://doi.org/10.1016/j.matdes.2022.110700
-
K. Linka, M. Hillgärtner, K. P. Abdolazizi, R. C. Aydin, M. Itskov, and C. J. Cyron, “Constitutive artificial neural networks: A fast and general approach to predictive data-driven constitutive modeling by deep learning,” Journal of Computational Physics, Vol. 429, p. 110010, Mar. 2021, https://doi.org/10.1016/j.jcp.2020.110010
-
B. Kiefer and D. C. Lagoudas, “Modeling the coupled strain and magnetization response of magnetic shape memory alloys under magnetomechanical loading,” Journal of Intelligent Material Systems and Structures, Vol. 20, No. 2, pp. 143–170, Jun. 2008, https://doi.org/10.1177/1045389x07086688
-
A. Waldauer, H. P. Feigenbaum, N. M. Bruno, and C. Ciocanel, “Improvements to the Kiefer and Lagoudas model for prediction of the magneto-mechanical behavior of magnetic shape memory alloys,” in ASME 2011 Conference on Smart Materials, Adaptive Structures and Intelligent Systems, pp. 411–420, Jan. 2011, https://doi.org/10.1115/smasis2011-5066
-
Y. Guijun, X. Xue, and Z. Fuqiang, “Predicting user ratings with XGBoost algorith,” Data Analysis and Knowledge Discovery, Vol. 3, No. 1, pp. 118–126, 2019, https://doi.org/10.11925/infotech.2096-3467.2018.0414
-
H. A. Gabbar, M. R. Abdussami, and M. I. Adham, “optimal planning of nuclear-renewable micro-hybrid energy system by particle swarm optimization,” IEEE Access, Vol. 8, pp. 181049–181073, Jan. 2020, https://doi.org/10.1109/access.2020.3027524
-
W. Cao, Y. Liu, H. Mei, H. Shang, and Y. Yu, “Short-term district power load self-prediction based on improved XGBoost model,” Engineering Applications of Artificial Intelligence, Vol. 126, p. 106826, Nov. 2023, https://doi.org/10.1016/j.engappai.2023.106826
About this article

This research was funded by the Liaoning Provincial Natural Science Foundation (Grant No. 2021-KF-14-01) and the Science Research Funding Project of Education Department of Liaoning Province (Grant No. LJKZ0178).
The datasets generated during and/or analyzed during the current study are available from the corresponding author on reasonable request.
Wang Luping: conceptualization, data curation, methodology, software, validation, writing-original draft preparation. Yang Jing: conceptualization, formal analysis, funding acquisition, investigation, writing-review, and editing. Gao Yunhong: formal analysis, project administration.
The authors declare that they have no conflict of interest.
