Abstract
Piezoelectric transducers, which convert airflow induced vibrational energy into electrical energy, can be applied to self-powered supply and auxiliary power supply for various aircraft electronic systems. Micro-ringtone airflow piezoelectric generator, designed by the principle of airflow induced acoustic, is one kind among them. The vibrating piezoelectric generator, is usually mounted on the aircraft during the flight. The incoming airflow produces hydrodynamic acoustic source, which is the vibration source of the piezoelectric generator, actively vibrates the piezoelectric plate to convert energy. According to the vibration theory, a one-dimensional vibration model of piezoelectric generator with fixed peripheral pressure, under hydrodynamic excitation is established. The vibration and frequency characteristics of the piezoelectric transducers are analyzed by measuring the sound pressure and the piezoelectric generator voltage. Theoretical analysis and experimental results show that the frequency of hydrodynamic acoustic source is slightly lower than that of piezoelectric generator’s natural frequency. Maximum output power is obtained when the inflow speed is in the range of 128 m/s-148 m/s, the corresponding hydrodynamic acoustic source frequency is 6.9 %-8.7 % lower than the natural frequency of the piezoelectric generator. Excitation force and the displacements of piezoelectric plate are in same frequency. But is ahead of phase angle than the displacement of piezoelectric plate.
1. Introduction
Both wind turbines and air generators operate in vibrating environments. They convert vibrations of wind or airflow into electrical energy, and can be implemented by the means of piezoelectric transducers, electromagnetic transducers or capacitive transducers. Among them, the piezoelectric transducers are of widespread concern as they are eco-friendly and convenient for miniaturization. The airflow-induced vibration generator developed for unmanned aerial vehicle electronic systems is a novel design.
The new type of micro-ringtone airflow piezoelectric generator, designed by the principle of airflow induced acoustic, could be mounted on the aircraft during the flight. A continuous airflow is injected into a stable flow tube. If the airflow kinetic energy is used to generate electricity directly, the piezoelectric transducer output power would be too small for power supplying purpose. Aiming at this problem, a kind of excitation mechanism of nozzle-resonator structure is designed, it is according to the principle of airflow induced sound and acoustic vibration [1-4]. This type of stimulus is modulated by a variable cross-section intake tube [5-7]. The velocity distribution in the tube is uniform, Reynolds number Re could be reached to 8215 [8, 9]. The nozzle-resonant cavity structure produces a vortex-excited hydrodynamic acoustic source [10]. Thus, the mechanical realization could boost the vibration, and can improve the input power of piezoelectric transducer [11]. To maximize energy output, several synchronous energy acquisition circuit had designed [12-15].
Based on the design of the hydrodynamic excitation mechanism [1, 5], piezoelectric transducer design and output power processing are also important in order to achieve maximum energy output. Piezoelectric transducer vibration characteristics and frequency stability need to be further studied.
Regarding the vibration model of the peripheral fixed piezoelectric plate. Based on Kirchhoff-Love thin plate vibration theory, Zou [11] derived the open circuit voltage of the piezoelectric transducer is:
where is the electric charge; is the static clamping capacitance of piezoelectric plate; is the stress; is the thickness; is the piezoelectric plate radius; is the displacement of the piezoelectric plate; , where is the dielectric isolation rate, is the electromechanical coupling coefficient. In the expression, the relationship between the open circuit voltage and the mechanical vibration displacement is complex, and the solution is indeed difficult. This paper will find other method for the solution. First, an equivalent model of piezoelectric transducer is established. The relationship between the exciting force of the piezoelectric transducer and the output open circuit voltage is obtained. Second, by directly measuring the excitation pressure and output voltage, then observing the frequency variation of the excitation signal, and analyzing the vibration performance of the transducer.
2. Working principle of airflow induced acoustic generator and equivalent one-dimensional vibration model
2.1. Working principle
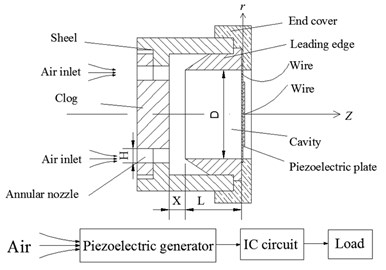
The schematic diagram of airflow induced acoustic generator is shown in Fig. 1. By the structure of clog and annular nozzle regulating the airflow injected, steady sound wave is produced in the resonance cavity, which acts as the fluid power source. The source can excite vibration of piezoelectric plate located at the bottom of the cavity, which is connected to an IC circuit. The generator provides power via the interface circuit by conditioning and storage, and finally drives the load circuit.
The specific working principle of the system consists of three modules: airflow regulation module, airflow induced acoustic module, and acoustic-electric transduction module. (1) The airflow regulation module includes a clog and an annular nozzle structure. The airflow injected passes through the annular nozzle and is pattern transited into turbulent with uniform velocity distribution near the inlet. At the outlet, vortex shedding is formed and induces fluctuating pressure field jet [8, 16, 17]. (2) The airflow induced acoustic module includes a leading edge and a cavity structure. The jet hits on the leading edge and creates edge tone, a high frequency sound with small amplitude formed. As the sound being reflected by the bottom cavity, standing wave is formed in the cavity. (3) The acoustic-electric transduction module includes a cavity and a piezoelectric plate structure. Piezoelectric plate consists of a circular copper sheet and a ceramic wafer. Stable acoustic wave in the cavity leads to the vibration of the piezoelectric plate, resulting AC voltage. The sound induced by airflow is a complex nonlinear phenomenon. The coupling of airflow-solid-acoustic benefits increasing the conversion efficiency of the transduction and output power of the generator.
Fig. 1Schematic diagram of airflow induced acoustic generator
2.2. Equivalent vibration model
The coupling of airflow-induced acoustic source and piezoelectric generator in Fig. 1 can be simplified to generalized conversion model, as shown in Fig. 2. The dynamic equation of the system could be written as:
Or rearranged to be:
where is the total force; is the exciting force, namely sound pressure; is the restoring force of piezoelectric plate; is the equivalent stiffness of piezoelectric generator mechanical structure, is the damping coefficient, is the equivalent mass; is the displacement of piezoelectric plate.
Fig. 2Generalized piezoelectric conversion model
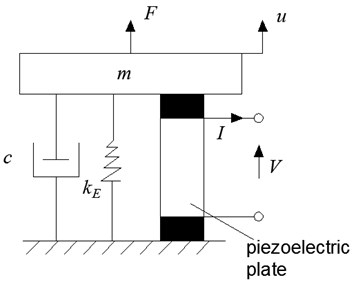
The open circuit output voltage and the current of piezoelectric plate are and respectively. Assuming the thickness of the single-layer thin piezoelectric plate in Fig. 2 is much less than the radius, and the displacement of the vibration is along the axis. Mechanical and electrical boundary conditions of the plate are mechanical clamped and electrical open circuit, respectively. By ignoring the electric leakage, the strain and the electric displacement are independent, while the stress and electric field intensity are dependent. The piezoelectric constitutive equation for the plate is:
where is the elastic stiffness constant; is the piezoelectric stiffness constant; is the dielectric isolation rate.
Then the relationship between mechanical and electrical parameters can be written as:
where is the equivalent stiffness of piezoelectric plate in open circuit configuration, and are the surface area and thickness of piezoelectric plate, respectively; is the static clamping capacitance of piezoelectric plate, is dielectric constant; In open circuit, 0, and are in same frequency and phase, the relationship between them can be expressed as:
The restoring force of piezoelectric plate in Eq. (5) is equal to the sum of elastic force and voltage control force :
where , is the elastic stiffness coefficient, ; .
Considering both voltage control force and elastic force , under the condition of open circuit, Eq. (3) becomes:
where is the total stiffness coefficient of piezoelectric transducer, which is equal to the sum of piezoelectric transducer’s mechanical structure equivalent stiffness and piezoelectric plate’s equivalent stiffness .
Through simulation and experimental analysis of the piezoelectric generator in Fig. 1, the results show that the acoustic pressure curve of the hydrodynamic source is sinusoidal [11]. Assuming , then the displacement of piezoelectric plate could be solved:
where:
is the transient state part. and are constant; is the system damping coefficient. approximates 0 for a short time and could be neglected due to the term of :
is the stable part. is the stable state amplitude:
is the sound pressure frequency; is the corresponding phase angle, .
Therefore, displacement of the piezoelectric plate can be expressed as:
It can be seen that angular frequency of the and are both , but the former one’s phase angle is advance .
2.3. Theoretical analysis of the frequency characteristics of sound pressure, piezoelectric plate displacement and output voltage
From the previous analysis on the frequency characteristics of sound pressure , piezoelectric plate displacement and the output AC voltage , it can be summarized as follows:
1) From the point of frequency, , and are the same; from the point of phase, and are the same, but is ahead of phase angle than the displacement of piezoelectric plate.
2) Based on the equation , when the open circuit voltage is difficult to be solved and the displacement cannot be measured directly, the frequency, phase angle and the amplitude of could be determined by measuring , which will be performed in the experiment.
2.4. Analysis of the relationship between sound pressure frequency and natural frequency
Let , which is called frequency ratio. While , . According to the theory of vibration and Eq. (12), varies for different . When 1, , independent to the damping coefficient ; When 1, 0, also independent to the damping coefficient ; But when →1, reaches a certain value, the displacement amplitude reaches maximum, this means that it is in a resonant state. By using the limit condition of 0, then:
In practice, damping is inevitable, therefore is slightly lower than , the smaller the , the closer to , and the larger the is.
3. Experimental analysis of frequency characteristics
Structure of the piezoelectric generator shows in Fig. 3, including an air inlet head, an annular nozzle, a shell, a resonator, a piezoelectric plate, an end cover and a wire.
Fig. 3Structure of the generator
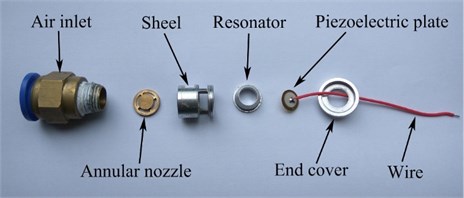
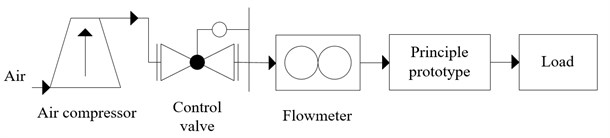
Fig. 4 shows experimental setup and equipment of the measurement system. The airflow provided by the air compressor, passes through the control valve and flowmeter. Then feeds into the generator principle prototype, which finally drives electric load (not shown for the open circuit configuration) at the generator output. The equipment of the measurement system is built by a pressure sensor, a data acquisition card, an impedance analyzer and a PC.
Fig. 4Test system: a) experimental setup, b) equipment of the measurement system
a)
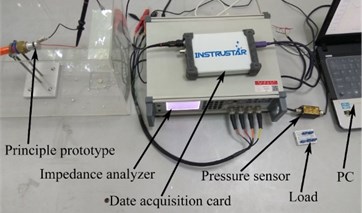
b)
3.1. Experimental analysis of frequency characteristics of sound pressure, piezoelectric plate displacement and output voltage
The sound pressure and the voltage curves (selected a representative data, 106 m/s, ×10 for the data acquisition configuration. the actual voltage is 10 times larger than the value shown in Fig. 6) are shown in Fig. 5 and Fig. 6 respectively. After conditioning of piezoelectric transducer, through the coupling of airflow-solid-acoustic, it can be seen that the sound pressure and output voltage are stable sinusoidal signal. The frequencies of sound pressure and voltage , are 7.64 kHz and 7.4 kHz, respectively. The upper and lower amplitude of voltage pressure curve are 10.7 V and –5.7 V respectively, the initial phase angle is 0.65 , and fitting expression is:
Combine with Eq. (6), displacement of the piezoelectric plate can be indirectly expressed as:
Fig. 5Resonator bottom sound pressure waveform: a) sound pressure curve, b) FFT
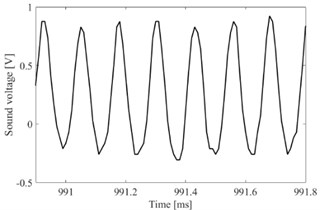
a) Sound pressure curve
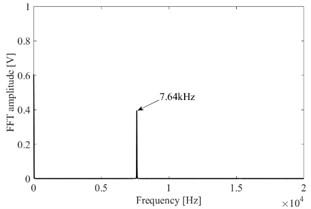
b) FFT
Fig. 6Open circuit voltage waveform: a) voltage curve, b) FFT
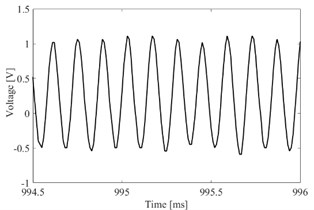
a) Voltage curve
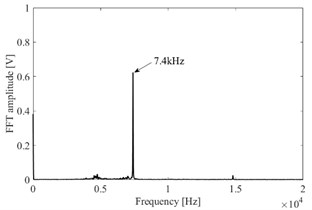
b) FFT
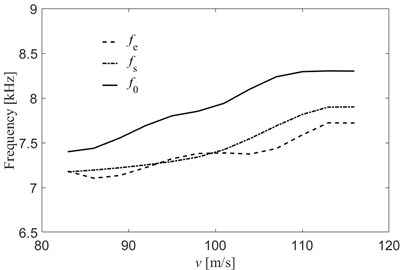
In the experiment, the flow rate is in the range of 84-116 m/s (vibration does not take place until the flow speed is larger than 84 m/s, and the piezoelectric plate crashes when the flow speed is larger than 116 m/s). Fig. 7 shows the measurement results of resonance frequency of piezoelectric generator , sound pressure frequency at the bottom cavity , and the voltage frequency , under different flow speed. Due to the increase of velocity of the airflow, it can be approximated thought the vibration of the generator is accelerated, therefore the natural frequency value increases straight up accordingly; Because of the generator has the characteristic of frequency capture, the sound pressure frequency will tend to be the natural frequency value; Since the sound pressure drives the piezoelectric plate to vibrate, with the increase of sound pressure frequency, the output voltage frequency increases straight up too. With the velocity increase , , are showing a straight up trend. The frequencies are fitted to be:
As can be seen from Fig. 7, the difference between and is small and can be considered equal, validated the theoretical derivation of the equivalent of the two.
Fig. 7generator’s v-f curve
3.2. Experimental analysis of the relationship between sound pressure frequency and natural frequency
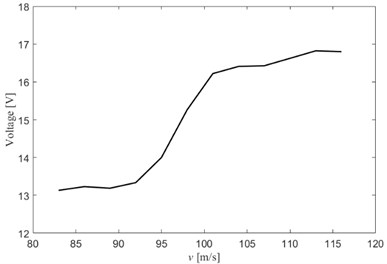
As the airflow rate changes, the natural frequency and sound pressure frequency changes too. When the sound pressure frequency is much lower or much higher than the natural frequency, the output voltage will be lowest; when the sound pressure frequency is close to the natural frequency, which means in the resonant state, the output voltage reaches the highest. Base on this theory, the voltage curve satisfies the characteristics of the quadratic equation. Fig. 8 shows the output voltage variation at different input velocities, and the expression is fitted as:
It could be easily calculated that the maximum voltage is 18.98 V when the airflow speed is 148 m/s. By using Eq. (16) to (18), 9.418 kHz, 8.6948 kHz, 8.278 kHz. It can be seen that when the voltage reaches its maximum, the sound pressure frequency should be at the position of 8.7 % lower than the natural frequency .
Fig. 8Output voltage with different velocities
The changing trend of sound pressure is similar to voltage, and when it works in resonant state, the sound pressure at the bottom cavity reaches the maximum value. The sound pressure with different velocities is shown in Fig. 9, which also satisfies the characteristics of the quadratic equation. Fitting expression is:
It could be calculated that maximum sound pressure is 27.64 kPa when the flow speed is 128 m/s. By using Eq. (16) to (18), 8.798 kHz, 8.1928 kHz, 7.908 kHz. It can be seen that when the sound pressure reaches its maximum, the sound pressure frequency should be at the position of 6.9 % lower than the natural frequency .
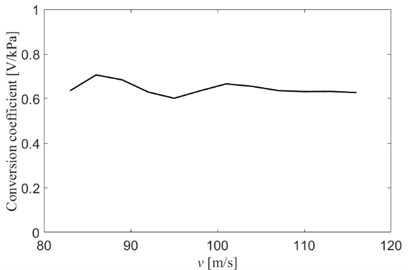
Conversion coefficient between the output voltage and the sound pressure is shown in Fig. 10, which is nearly a constant value of 0.65 V/kPa. The main reason is that the generator has the ability to stabilize the regulation of airflow and output voltage, whatever the airflow speed changes, the ratio between sound pressure and output voltage is constant.
Fig. 9Sound pressure with different velocities
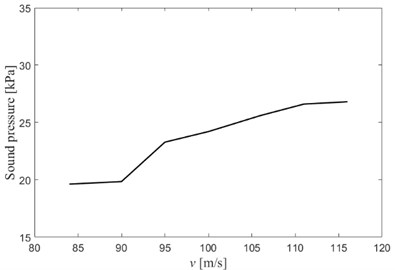
Fig. 10Conversion coefficient between output voltage and sound pressure
From the curves of Fig. 7 to Fig. 9, and their corresponding expressions, it can be concluded that the relationship between sound pressure frequency and natural frequency in the resonant state is as follows:
1) When the generator reaches the resonant state, the output voltage reaches the maximum, the sound pressure frequency is slightly lower than the natural frequency. Fig. 8 shows that, when the output voltage reaches its maximum, the sound pressure frequency is 8.6948 kHz, and the natural frequency is 9.418 kHz; Fig. 9 shows that, when the sound pressure reaches its maximum, the sound pressure frequency is 8.1928 kHz, and the natural frequency is 8.798 kHz. Whatever the output voltage or the sound pressure reaches the highest, when the generator in the resonant state, the sound pressure frequency is slightly lower than the natural frequency.
2) The maximum voltage and sound pressure take place when the airflow speed are 148 m/s and 128 m/s, respectively. The corresponding sound pressure frequencies at the position of 6.9 % and 8.7 % lower than the natural frequency, respectively. Therefore, in order to design the generator to achieve the maximum output energy, sound pressure frequency should be controlled to be lower than generator’s nature frequency, in the range of 6.9 % to 8.7 %.
4. Conclusions
The generator consists of a resonance cavity and a single-layer clamped piezoelectric plate. The external airflow passing through the generator induces sound by complex coupling mechanism. The generator converts the energy of the acoustic vibration into electric energy by piezoelectric effect. Based on the establishment of the one-dimensional vibration model of the generator, the relationship between the displacement of the piezoelectric plate and the output voltage is clarified. At the same time, theoretical and experimental analysis are performed for the frequency characteristics of sound pressure, piezoelectric plate’s displacement and output voltage. The relationship between sound pressure frequency and generator’s natural frequency is also analyzed. Final conclusions are as follows:
1) The sound pressure , the piezoelectric plate displacement , the output AC voltage has the same frequency; The phase of piezoelectric plate’s displacement is equal to the output AC voltage , but is ahead of phase angle than .
2) By using the direct voltage measurement method, according to the formula , the displacement amplitude, frequency, and phase angle of the piezoelectric plate could be calculated.
3) Theoretical analysis and experimental results show that the vibrations of the airflow induced acoustic are steady, the generator works in the resonant state, the sound pressure frequency works lower than the generator’s natural frequency. In order to design a generator to output with maximum power, the sound pressure frequency should be controlled slightly lower than the natural frequency, in the range of 6.9 %-8.7 %.
These conclusions will be helpful to simplify one-dimensional vibration model and engineering design.
References
-
Zou Huajie, Chen Hejuan, Lai Changying, Sun Jiantao, Jiang Qi Sound tube fixation method of micro ringtone airflow piezoelectric generator. Journal of Detection and Control, Vol. 3, 2014, p. 25-30.
-
Zou Hua Jie, Chen He Juan, Lang Yi, Jiang Qi, Liu Bin, Wang Jun Hong Study of drive characterization of fuze vibration piezoelectric generator based on air-flow induced sound. ACTA Armamentarii, Vol. 36, Issue 4, 2015, p. 610-618.
-
Zou Huajie, Chen Hejuan Frequency characteristic of piezoelectric generator based on airflow induced sound. Journal of Chemical and Pharmaceutical Research, Vol. 7, Issue 3, 2015, p. 1328-1334.
-
Zou Huajie Exciting Vibration Technology from Airflow-Induced Sound on a Small Vibration Piezoelectric Generator. Nanjing University of Science and Technology, 2015.
-
Zou Huajie Chen Hejuan Numerical analysis of turbulence flow field in variable cross-section air inlet of self-regulation airflow. International Conference on Material Sciences and Manufacturing Technology, China, 2012.
-
Zou Huajie, Chen Hejuan, Zhu Xiaoguang Characterization of acoustic excited power resonance tube for on-board piezoelectric generator. International Conference on Image Processing, Communication, Engineering and Technology, China, 2014.
-
Zhu Xiaoguang, Zou Huajie, Chen Hejuan Hydrodynamic sound source tube design and analysis of flow-induced miniature piezoelectric resonance generator. International Conference on Image Processing, Communication, Engineering and Technology, China, 2014.
-
He Peng The Flow Field Numerical Simulation in Air Inlet of New Type Fuze Missile-Borne Piezoelectric Generator. Nanjing University of Science and Technology, 2012.
-
Liu Lidong, Chen Hejuan, Cai Jianyu, He Peng, Lai Changyin, Sun Jia Cun, Zou Huajie. Condition of transition in Airflow-induced acoustic vibration piezoelectric generator boundary layer inlet. International Conference on New Energy and Sustainable Development, China, 2016.
-
Zhang Jian, Sun Jiacun, Cai Jianyu, Chen Hejuan, Yao Chi The frequency stability of airflow-induced acoustic vibration piezoelectric generator. International Conference on Green Materials and Environmental Engineering, Vol. 12, Issues 20-21, 2015, p. 214-217.
-
Zou H., Chen H., Zhu X. Piezoelectric energy harvesting from vibrations induced by jet-resonator system. Mechatronics, Vol. 26, 2015, p. 29-35.
-
Qu Wei The Vibration Energy Harvesting Technologies of Fuze Airflow Induced Vibration Piezoelectric Generator. Nanjing University of Science and Technology, 2014.
-
Qu Wei, Chen Hejuan, Sun Jiacun, Li Wenpeng Synchronous charge energy harvesting method for micro ring tone oscillations piezoelectric generator. Piezoelectric and Acoustooptics, Vol. 35, Issue 5, 2013, p. 672-675.
-
Chen B., Sun J., Chen H., et al. Single-phase ac voltage control circuit for flow-induced acoustic-vibration piezoelectric generator. Proceedings of the 5th International Conference on Electrical Engineering and Automatic Control, 2016.
-
Chen Bo The Interface Circuit Design and Experimental Research of Airflow Induced Vibration Piezoelectric Generator. Nanjing University of Science and Technology, 2016.
-
Li F., Chen H. J. Numerical analysis of vortex shedding behavior of piezoelectric microgenerator from dynamic airflow-induced vibration. Advanced Materials Research, Vol. 694, Issue 697, 2013, p. 1595-1601.
-
Li Fei, Chen Hejua Numerical simulation and analysis of asymmetric inner flow field in air-inlet of self-regulating airflow annular space. International Conference on Material Sciences and Manufacturing Technology, Nanjing, China, 2012.
Cited by
About this article

The research is financially supported by the National Natural Science Foundation of China under contract No. 51377084, and the National Natural Science Foundation of Jiangsu Province under contract No. BK20160296.
Gensheng Wang and Huajie Zou conceived and designed the experiments; Jiacun Sun performed the experiments; Gensheng Wang and Hejuan Chen analyzed the data; Jianyu Cai contributed reagents/materials/analysis tools; Gensheng Wang and Hejuan Chen wrote the paper.
