Abstract
In order to improve the vibration isolation, environmental adaptability and development efficiency of rubber mounts, a novel rubber mount with adjustable parameters such as stiffness, support height and limit distance was proposed, and its structural composition and working principle were described. And then, a commercial vehicle was taken as the research object to conduct the calculation of mounts stiffness by employing the energy decoupling method and genetic algorithm. On the basis of the influence of cone angle, thickness and height on the ratio of axial-radial stiffness, the detailed structural design of the mounts was carried out, and the relationship between the preloading displacement and axial-radial stiffness was studied by the method of theoretical calculation and test, which made the process of the stiffness adjustment more specific and accurate. Finally, the vibration isolation performance test of the Powertrain Mounting System (PMS) before and after stiffness adjustment was completed. Results show that the adjusted PMS indicates better vibration isolation performance at idle speed and slow acceleration in place, and the new mounts can effectively improve the vibration performance of vehicle, environmental adaptability of mounts and product development efficiency.
1. Introduction
Engine mounts are usually installed between the powertrain (engine, gearbox and clutch) and the frame or subframe, achieving the role of flexible support for the powertrain. At the same time, it also plays a two-way vibration isolation role between the powertrain and the frame or subframe: isolate the vibration and high-frequency noise of the frame or car-body caused by the engine excitation and the transmission of the frame or car-body vibration to the powertrain caused by uneven road surface. Its performance directly affects the reliability and NVH (Noise, Vibration and Harshness) performance of the vehicle [1, 2].
According to the characteristics of controllability, engine mounts include passive mounts (rubber mounts and hydraulic mounts are most common), semi-active mounts and active mounts [3-6]. Due to the advantages of low cost and simple structure, rubber mounts have been widely used in the field of commercial vehicle [7-8]. In recent years, there have been more and more literatures on the vibration characteristic analysis and optimization of PMS based on rubber mounts. From the perspective of PMS itself, with stiffness, damping, layout angle and position as design variables, the natural frequency of the PMS is reasonably configured, and the decoupling rate, supporting force and vibration isolation rate are optimized by six degree-of-freedoms (DOFs) models to improve the vibration isolation performance of PMS [2, 9, 10]. From the perspective of vehicle, the influence of mounting parameters on the vehicle vibration is studied by the multi-degree-of-freedom models to improve vehicle NVH performance [11-13]. However, due to factors such as manufacturing errors, assembly errors, material aging and complex working conditions, the stability of vibration isolation performance is affected [14]. Therefore, the study on robustness of PMS has received much attention [11, 15], and some design methods have been applied, such as experimental design method [16],Taguchi method, 6σ method, interval analysis [17], sensitivity analysis, multidimensional parallelepiped model, etc.
As can be viewed above, it is an important way to improve the vibration isolation performance to optimize the stiffness of mounts and ensure the robustness of the PMS to it. However, the test of the parameters of the powertrain used for the theoretical calculation of stiffness is generally completed in the state of no water or oil, which is quite different from the actual working conditions, and leads to calculation error. In the process of manufacturing, the deviation level of mounts stiffness is generally about 15 %. These will result in multiple manufacturing and replacement of samples, thereby reducing the quality and efficiency of development. And meanwhile, the stiffness is affected by temperature, which leads to the change of vibration isolation performance and installation attitude in different seasons and regions for the same PMS. All of these will affect the user experience. Therefore, a novel rubber mount with adjustable parameters including stiffness, support height and limit distance was proposed in this paper. The vibration isolation performance and environmental adaptability of a commercial vehicle PMS were optimized by the mounts.
2. Introduction of rubber mounts
2.1. Introduction of regular rubber mounts
Regular rubber mounts are generally composed of metal parts and rubber parts. Metal parts play a supporting and limiting role to ensure vehicle safety. Rubber parts play a role in damping and absorbing energy, contributing to the vibration isolation of PMS. According to the stress mode, rubber mounts are divided into compression type, shear type and mixed type, and the typical structures are shown in Fig. 1.
Fig. 1Typical structures of regular rubber mounts
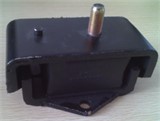
a) Compression type
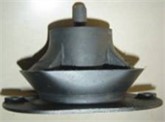
b) Shear type
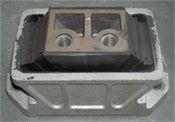
c) Mixed type
As can be seen from Fig. 1, the structures of regular rubber mounts are relatively simple, and their stiffness, support height and limit distance can't be adjusted.
2.2. Introduction of multi-parameter adjustable rubber mounts
2.2.1. Structural composition
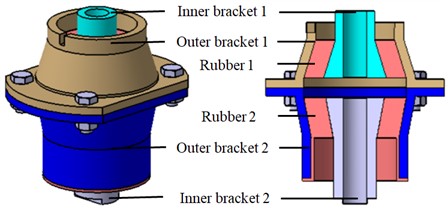
The novel mounts consist of mounting assemblies and accessories. A mounting assembly consists of an upper mounting assembly, a lower mounting assembly, an upper bolt, a lower bolt, a lower limit bracket, a nut for adjustment, fixed components, a large fixing nut 1, and a screw assembly, as shown in Fig. 2. Among them, the upper bolt is external thread. The lower bolt is internal thread and fits with the lower thread of the upper bolt. The screw assembly is a combination of screw and spring washer.
The upper mounting assembly (as illustrated in Fig. 3) is composed of an inner bracket 1, an outer bracket 1 and a rubber 1 between the brackets. The lower mounting assembly consists of an inner bracket 2, an outer bracket 2 and a rubber 2 between the brackets. Outer bracket 1 and outer bracket 2 are connected by fixed components. The rubber is vulcanized on the top of the lower limit bracket, and the bracket is connected with the outer bracket 1 by thread. Several bosses are arranged outside the lower limit bracket to facilitate its rotation and realize the adjustment of the lower limit distance.
Fig. 2Structural composition of mounting assembly
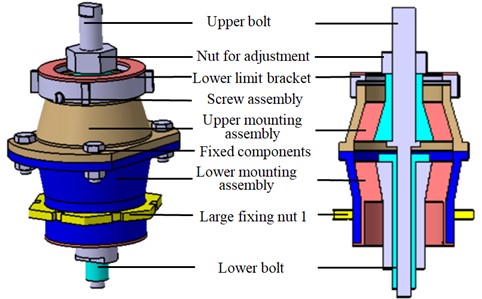
Fig. 3Structural composition of upper and lower mounting assembly
The mount is assembled as displayed in Fig. 4.
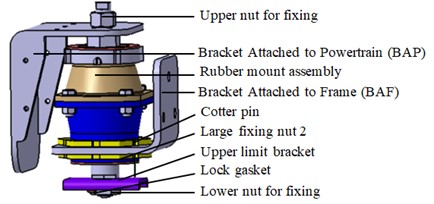
The accessories include height measuring pin, adjusting bolt, large fixing nut 2, upper limit bracket, fixing nut, cotter pin. When the PMS is assembled, the Bracket Attached to Powertrain (BAP) is connected with the upper bolt by an upper nut for fixing. And then, the Bracket Attached to Frame (BAF) and the outer bracket 2 are fixed together by the large fixing nut 2, and the cotter pin is used to lock. Finally, the upper limit bracket, lock gasket and lower nut for fixing are installed. Assembly drawing of the mount is shown in Fig. 5.
Fig. 4Assembly procedure of the mount
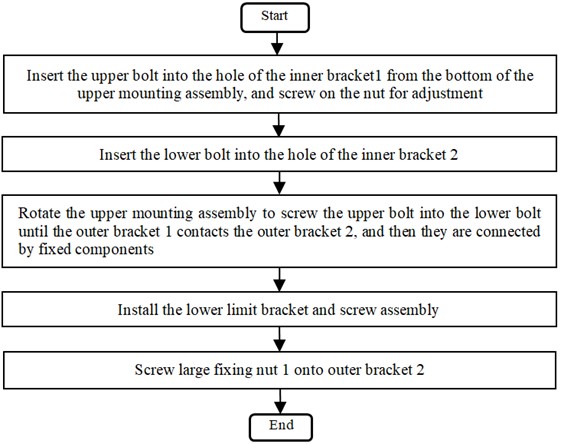
Fig. 5Assembly drawing of the mount
The upper limit bracket, which adopts U-shaped structure, is assembled with inner bracket 2 in the form of long slot holes (as shown in Fig. 6), which can be installed in four ways. The upper limit bracket is open or closed when the boss is aligned with the hole or the boss is staggered with the hole.
In order to prevent the components from falling off under vibration excitation, screws and spring washers are used to lock the lower limit bracket. The cotter pin is used to prevent the large fixed nuts from loosening and the lock gasket is used to lock the lower nut, as illustrated in Fig. 7.
Fig. 6Installation forms of the upper limit bracket: hole fits with boss and hole intersects with boss
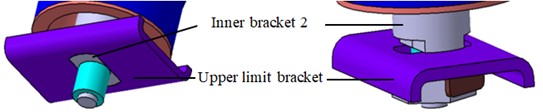
Fig. 7Assembly drawings of locking devices
a) Screw and spring washer
b) Cotter pin
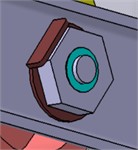
c) Lock gasket
2.2.2. Working principle
Under the gravity and torque of the powertrain, BAP drives the upper bolt, inner bracket 1, lower bolt and inner bracket 2 to move relative to the outer bracket 1 and outer bracket 2. Rubber 1 and rubber 2 are deformed to achieve isolation. In harsh working conditions, the downward movement is restricted by the contact between the BAP and the lower limit bracket. When the upper limit bracket contacts with the outer bracket 2, the upward movement is restricted. These measures prevent the rubber from being damaged by excessive compression or stretching.
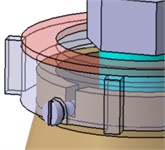
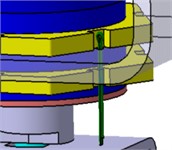
Fig. 8Description of mounts parameters
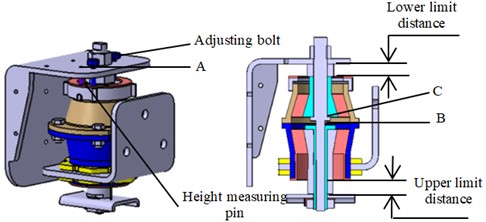
When the development of PMS needs to seek the best vibration isolation performance, or the performance and the installation attitude of the powertrain are affected by the change of temperature, the mounts with adjustable stiffness, support height and limit distance (as shown in Fig. 8) will greatly improve the efficiency of product development and the environmental adaptability of mounts. If the stiffness values decrease, the procedure for adjusting parameters of PMS is shown in Fig. 9.
Fig. 9Procedure for adjusting parameters of PMS
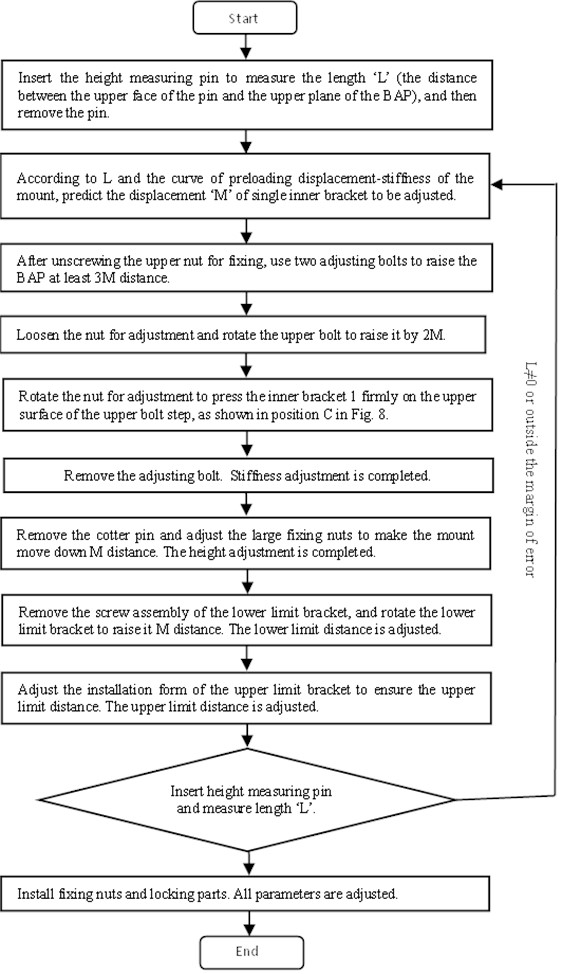
The procedure for adjusting parameters in Fig. 9 is described as follows:
(1) When the length is measured, the height measuring pin is inserted from the hole (A) in Fig. 8, and its lower end face is vertically against the rubber of the lower limit bracket. In theory, the upper end face of the pin is flush with the upper plane of the BAP. When the stiffness values decrease, the height of the BAP will decline, and the upper end face of the pin will highlight the upper plane of the BAP.
(2) The static preloading displacement S of mounts is generally 3-5 mm. From the values of and , the target stiffness can be obtained as times of the design stiffness, and the preloading displacement of a single inner bracket can be obtained according to the preloading displacement-stiffness curve of the mounts measured by tests. However, due to the influence of temperature on the curve, stiffness errors of partial mounts still exist, which can be corrected by fine-tuning the value of in the second step to achieve more accurate results.
(3) When the end faces of the upper and lower bolts (the location of point B in Fig. 8) contact, the distance between the upper and lower inner brackets can't be further adjusted to prevent rubber damage caused by excessive adjustment.
3. Design of mounts
3.1. Data acquisition
The inertial parameters of powertrain such as mass, center of mass, moment of inertia affect the results of stiffness optimization. So they are tested by the MPT-3000 (as shown in Fig. 10). The results are shown in Table 1.
Fig. 10Equipment for inertial parameter test
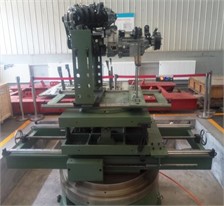
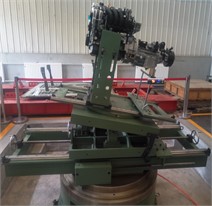
Table 1Inertial parameters of a powertrain
Parameter | Result | |
Mass of engine (kg) | 532 | |
The center of mass (VCS) | (–101.2, –3.5, 65.5) | |
Moment of inertia based on the center of mass (kgmm2) | IXX | 1.87E+07 |
IYY | 7.4E+07 | |
IZZ | 6.8E+07 | |
IXY | 2.9E+05 | |
IYZ | –8.1E+05 | |
IXZ | 6.4E+06 | |
In Table 1, the three orthogonal axes of Vehicle Coordinate System (VCS) are set with -axis parallel to the frame and pointing to the rear of vehicle. The -axis is perpendicular to the ground and vertically upward. The -axis is determined by the right-hand rule. The directions of the -, - and -axes of the powertrain are parallel to the -, - and -axes of VCS, respectively.
3.2. Calculation of stiffness
The powertrain is arranged longitudinally and supported horizontally by four rubber mounts which are positioned symmetrically along the -plane of VCS: Front Left Mount (FLM), Front Right Mount (FRM), Rear Left Mount (RLM) and Rear Right Mount (RRM). The stiffness of the left mounts is the same as that of the right ones. Due to the limitation of installation space, energy decoupling method and genetic algorithm are used to predict the stiffness of the mounts, so as to ensure the vibration isolation performance of PMS.
Considering the characteristics of PMS, the following approximations and simplifications were made when the theoretical analysis model was established:
1) The PMS had small displacement around its equilibrium position.
2) The PowerTrain System (PTS) and frame were represented by rigid bodies.
3) The powertrain was supported by rubber mounts with negligible rotational stiffness as compared to the translational stiffness.
4) The moment and product of inertia were considered to be constant.
5) Some connections of wire/pipe and the mass of the mounts were ignored.
3.2.1. Theory of energy decoupling
Due to a much higher value of natural frequency of PTS as compared with the value of mounting, it is reasonable to model the PTS as a rigid body with six degree-of-freedoms. The vibration equation of the system can be obtained according to the Lagrange equation as follows:
where, is the mass matrix, is the damping matrix, and is the stiffness matrix.
By solving Eq. (1), the frequency () and the modal shape (of each order can be obtained.
When the vibration of the system in the th natural frequency occurs, the energy percentage in the th generalized coordinate can be expressed as follows:
where, and represent the element and element of the -order principal mode, respectively. is the element of the system mass matrix located in the row and column. The percentage of energy decoupling is one of the main indexes to evaluate the quality of the PMS. When 100 %, it denotes that all the vibration energy of the modal vibration focuses on the generalized coordinates. The decoupling is realized at the view of energy.
3.2.2. Genetic algorithm (GA) method
Genetic algorithm (GA), the method to search for the most suitable solution by imitating the evolution of nature, is widely used in various fields [18]. In this paper, the stiffness of mounts was taken as the design variable, one combination of the main vibration energy distribution of PMS was selected as the objective function, and the constraints were defined as follows:
(1) According to the frequency of engine idling firing and road excitation, the natural frequency of the PMS was constrained to [5, 17] Hz.
(2) The value of the interval frequency between ROTX and direction was greater than 2 Hz, and the values of the interval frequency between adjacent two orders in other directions were greater than 1 Hz.
(3) The percentage of energy decoupling of each order was greater than 80 %.
(4) The stiffness of the left mounts was equal to that of the right ones, and the stiffness in the direction was equal to that in the direction.
The mathematical model can be expressed as follows:
where, , , , represent the stiffness in the 𝑢 and 𝑤 directions of the front and rear mounts, respectively. is the objective function, is the weighting coefficient, and is the natural frequency.
3.2.3. Result of stiffness calculation
Based on the theory above, the program for optimization was written by MATLAB, and the stiffness values of the mounts were obtained. The dynamic stiffness values of the front and rear mounts are (720, 720, 314) and (665, 665, 635) N/mm, respectively. The natural frequency and decoupling rate of the PMS are listed in Table 2.
Table 2Natural frequency and decoupling rate
Modes | Frequency (Hz) | Decoupling rate (%) |
RYY | 8.04 | 98.6 |
Z | 9.48 | 99.65 |
Y | 10.5 | 83.38 |
X | 11.55 | 98.32 |
RZZ | 15.38 | 84.29 |
RXX | 16.68 | 97.89 |
As can be seen from Table 2, the parameters such as frequency distribution range, values of the interval frequency and decoupling rate have been met, and the optimization results are acceptable.
3.3. Structural design
In order to study the influence regularities of structural parameters on the performance to improve the design efficiency, the structural parameters affecting the ratio of axial-radial stiffness were studied by finite element method. In other words, the influence of cone angle (), thickness () and height () (as shown in Fig. 11) on the ratio was studied by reasonable constitutive model of rubber material and ABAQUS software.
The constitutive models of rubber materials mainly include Mooney-Rivlin model, Neo-Hooke model, Yeoh model and Ogden model based on phenomenological theory, and Arruda-Boyce model and Van der Waals model based on thermodynamic or molecular statistical theory. The Mooney-Rivlin model has few undetermined parameters, which can better describe the deformation of rubber materials within 150 %, and has the characteristics of high calculation accuracy and good iterative convergence in finite element calculation. So it is the most widely used in engineering [19-21]. The strain potential function of its constitutive model is as follows:
where, is the strain potential energy per unit volume. , and are temperature-dependent model parameters. When 0, the rubber material is completely incompressible. and are strain invariants of first order and second order respectively. is the strain ratio of the elastic volume.
Fig. 11Main structural parameters
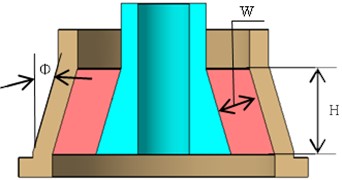
In this paper, the rubber material was defined by the Mooney-Rivlin model, and the values of , and are 0.374, 0.093 and 0, respectively. The calculation results are shown in Fig. 12.
Fig. 12Influence of structural parameters
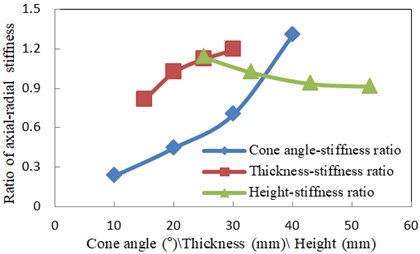
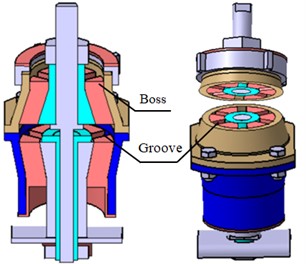
It can be concluded from Fig. 12, the ratio of axial-radial stiffness is the most sensitive to cone angle, followed by thickness and height, and the ratio increases significantly with the cone angle. The target stiffness values of mounts can be obtained within the range of 35 degrees of the cone angle, which can avoid the problem of too large diameter caused by too large cone angle. If a large ratio is required, structural features such as grooves and bosses can be added (as shown in Fig. 13). The front mount is taken as an example to study its performance, whose construction is shown in Fig. 14.
Fig. 13Structural features used to adjust stiffness
3.4. Study on stiffness adjustment characteristics
In order to obtain the stiffness adjustment characteristics of the mount, the stiffness under different states was calculated by implicit finite element method. First, the 3D model was imported into the HYPERMESH software. Then, the pre-processing work such as geometry processing, mesh division, attribute definition, model connection and contact definition was carried out. The detailed information about the pre-processing work is shown in Table 3.
Fig. 14The construction of the front mount
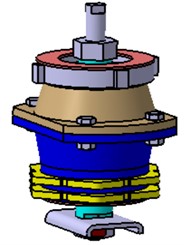
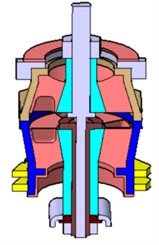
Table 3The detailed information about the pre-processing work
Parts description | Part | Element type | Element number | Materials |
Outer bracket 1 Outer bracket 2 | C3D8 (hexahedron) | 27288 | ZG310-570 | |
Inner bracket 1 Inner bracket 2 | C3D8 (hexahedron) | 6660 | ZG310-570 | |
Rubber 1 Rubber 2 | C3D4H (tetrahedron) | 40507 | NR | |
Fixed components | KINCOUP (rigid)+B31(bar2) | 12 | 40Cr | |
Upper bolt Lower bolt | KINCOUP (rigid) +B31 (bar2) | 5 | 40Cr | |
Contact definition | Contact A | Contact B | Contact option | Instructions |
Rubber 1 | Outer bracket 1 Inner bracket 1 | Tie | Surface to surface | |
Rubber 2 | Outer bracket 2 Inner bracket 2 | Tie | Surface to surface | |
Outer bracket 1 | Outer bracket 2 | Contact pair | Surface to surface Friction Coeff = 0.1 |
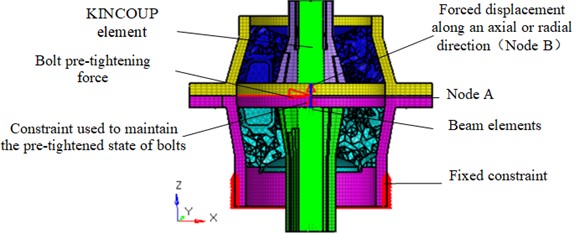
The calculation of the model is nonlinear, and it is easy to cause non-convergence problems. Therefore, ABAQUS solver was used to define and solve the working conditions, which include the initial condition and the analysis steps. The initial condition was defined as constraining all degrees of freedom of all nodes on the outer bracket 2 where the two large nuts were installed. The two analysis steps were established as follows:
(1) The bolt pre-tightening force was applied on the middle beam element so that the rubbers were compressed or stretched, and the loading point (Node A) was generated. And the different adjustment states of rubbers were simulated by changing the value of bolt pre-tightening force.
(2) Constrained the X degree of freedom of Node A and selected the ‘fixed’ option to maintain the distance between the inner bracket 1 and the inner bracket 2 under the bolt pretension, and applied axial or radial 3 mm forced displacement on the node (Node B in Fig. 15) of the middle beam element to simulate the deformation of the rubbers during work.
In addition, the supplementary instructions for the two analysis steps are as follows:
(1) ‘Nlgeom’ option and ‘static’ analysis type were selected.
(2) In order to improve the convergence performance, the initial increment was set to 0.2 and the ‘Controls’ keyword was used.
(3) When the bolt pre-tightening force was applied, Node B had already produced displacement ‘d’ in the axial direction, and the value of axial forced displacement should be set to –3+d.
The Finite element model of mounts stiffness calculation is shown in Fig. 15.
Fig. 15Finite element model of mounts stiffness calculation
After the calculation was completed, the reaction force at the nodes of forced displacement can be obtained through post-processing, so as to obtain the stiffness under different preloading displacements. The stiffness curves are shown in Fig. 16, where the positive displacement represents the increase of the distance between the two inner brackets.
Fig. 16Displacement-axial and radial stiffness curves
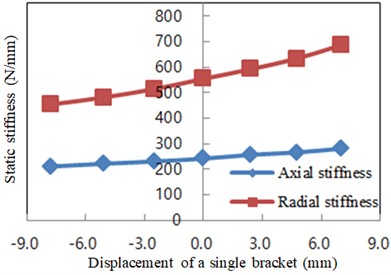
As can be seen from the figure above, axial and radial stiffness values of the mount increase with the expansion of the distance between the two inner brackets, and the change trend of radial stiffness values is faster than that of axial stiffness values, which results in a small change in the ratio of axial-radial stiffness. According to the previous dynamic stiffness test results of similar mounts, when the ratio of dynamic-static stiffness is 1.35, the stiffness is consistent with the optimized dynamic stiffness values, which meets the design requirements.
4. Experimental study
4.1. Stiffness test
The mount was deformed by rotating the upper adjustment bolt, and the stiffness was tested by the equipment. The test process and results of static stiffness are shown in Fig. 17.
Fig. 17 displays the static stiffness values of the front mount obtained by calculation are consistent with those obtained by experiments. However, there are differences between the properties of rubber material in the model and its real properties, and there are errors in the manufacture, which lead to the difference between the theoretical calculated values and the measured values gradually increasing with the inner brackets displacement.
Fig. 17Test process and results of the front mount
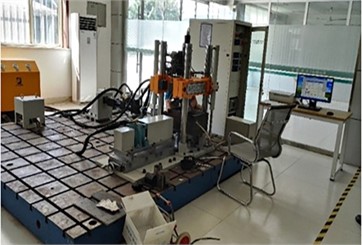
a) Process of stiffness test
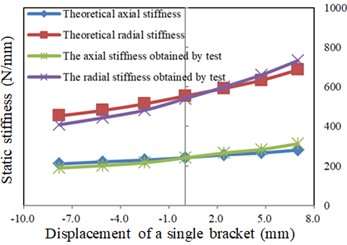
b) Displacement-stiffness curves of the front mount
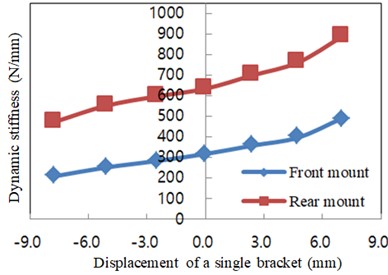
Because the vibration isolation performance of PMS is mainly determined by the dynamic stiffness of mounts, especially the dynamic stiffness in direction, which depends on preload, excitation frequency, amplitude, temperature and structure [22]. In order to be close to the actual working conditions, the axial dynamic stiffness at 25 Hz, 1000 N preload and ±1 mm amplitude under different preloading displacement at room temperature was tested, so as to facilitate the adjustment. The test results of dynamic stiffness are shown in Fig. 18.
Fig. 18Displacement-dynamic stiffness curves
4.2. Vibration isolation performance test
In order to investigate the influence of stiffness adjustment on the vibration isolation performance, the vibration isolation performance was tested at idle speed and slow acceleration in place before and after stiffness adjustment. And the structural parameters and stiffness of the mounts before and after adjustment are shown in Table 4. Therefore, the sensors were set at different points as shown in Fig. 19.
Fig. 19Sensors location in the vehicle
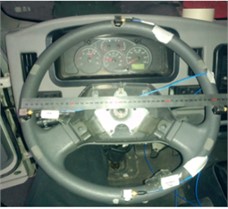
a) Steering wheel
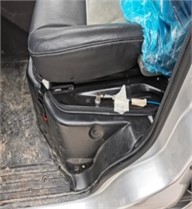
b) Seat track
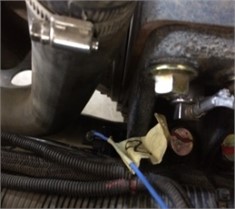
c) Mount
Four 3D accelerators were installed in mounting brackets of engine side and four 3D accelerators were installed in mounting brackets of frame side. One 3D accelerator was installed in 12 o’clock position of steering wheel, and one 3D accelerator was installed in seat track. The three directions of the 3D accelerators should be parallel to the -, - and - axes of VCS as far as possible, respectively. The engine speed was also obtained.
Table 4The structural parameters and stiffness of the mounts before and after adjustment
Parameters | FLM | FRM | RLM | RRM | ||||||||
Stiffness before adjustment (N/mm) | 536 | 536 | 233 | 513 | 513 | 222 | 474 | 474 | 454 | 485 | 485 | 463 |
Stiffness after adjustment (N/mm) | 580 | 580 | 249 | 545 | 545 | 233 | 498 | 498 | 470 | 456 | 456 | 439 |
Preloading displacement (mm) | 1.5 | 1.0 | 1.2 | -2.5 | ||||||||
Support height (mm) | Large fixing nuts raise 1.5 mm along + direction relative to the mount | Large fixing nuts raise 1.0 mm along + direction relative to the mount | Large fixing nuts raise 1.25 mm along + direction relative to the mount | Large fixing nuts raise 2.5 mm along – direction relative to the mount | ||||||||
Limit distance (mm) | Lower limit bracket raises 1.5 mm along + direction | Lower limit bracket raises 1.0 mm along + direction | Lower limit bracket raises 1.25 mm along + direction | Lower limit bracket raises 2.5 mm along – direction. The boss of inner bracket 2 is staggered with the hole of the upper limit bracket | ||||||||
4.2.1. Test results at idle
The transmission was in neutral position, the engine was running at idle, and the signal of not less than 1 minute was recorded with the results shown in Fig. 20 and Table 5.
Fig. 20Accelerations of steering wheel and seat track at idle
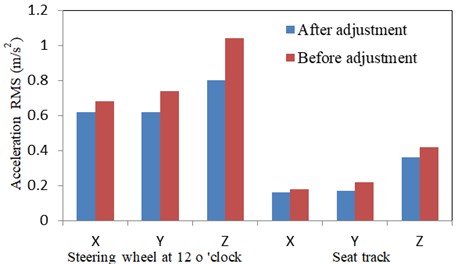
As can be seen from Fig. 20 and Table 5, each mount has a good vibration isolation effect, especially after stiffness adjustment. Specially, the vibration isolation rate is more than 80 %, and the average value is 90 %, which also reduces the acceleration of key positions of the car-body such as steering wheel at 12 o’clock and seat track. The vibration isolation performance is improved significantly.
Table 5Vibration isolation ratio of mounts at idle
Mounts | Before adjustment (m/s2) | After adjustment (m/s2) | Vibration isolation ratio (%) | |||
Active | Passive | Active | Passive | Before adjustment | After adjustment | |
FL_X | 0.7 | 0.11 | 0.6 | 0.11 | 84 | 82 |
FL_Y | 1.55 | 0.17 | 1.4 | 0.26 | 89 | 81 |
FL_Z | 3.45 | 0.59 | 2.84 | 0.25 | 83 | 91 |
FR_X | 0.78 | 0.06 | 0.65 | 0.03 | 92 | 95 |
FR_Y | 1.87 | 0.15 | 1.56 | 0.23 | 92 | 85 |
FR_Z | 2.52 | 0.38 | 2.18 | 0.13 | 85 | 94 |
RL_X | 0.36 | 0.11 | 0.51 | 0.03 | 69 | 94 |
RL_Y | 2.33 | 0.14 | 1.94 | 0.12 | 94 | 94 |
RL_Z | 1.82 | 0.58 | 1.14 | 0.17 | 68 | 85 |
RR_X | 0.24 | 0.12 | 0.4 | 0.03 | 50 | 93 |
RR_Y | 2.31 | 0.31 | 2.08 | 0.13 | 87 | 94 |
RR_Z | 1.3 | 0.16 | 1.06 | 0.09 | 88 | 92 |
4.2.2. Test results at slow acceleration in place
The transmission was in neutral position, pressed the accelerator pedal, increased the engine speed from idle to rated speed slowly, and recorded the test signal. At idle speed, the vibration performance of the steering wheel and seat track after adjustment is significantly improved compared with that before adjustment. If the vibration isolation performance of the mounts is better at different engine speeds, the vibration isolation performance of the steering wheel and seat track will still be better. Therefore, this section focuses on the vibration isolation performance of the mounts, and the test results are presented in Fig. 21 and Fig. 22.
After adjustment, the accelerations in , , and direction of the mounts are illustrated in Fig. 21. It is found that the accelerations on the active side increase significantly with the engine speed, but the accelerations on the passive side increase slowly and relatively smoothly with the engine speed. After stiffness adjustment, each mount has an obvious vibration isolation effect.
Fig. 21Mounts accelerations after adjustment at active and passive
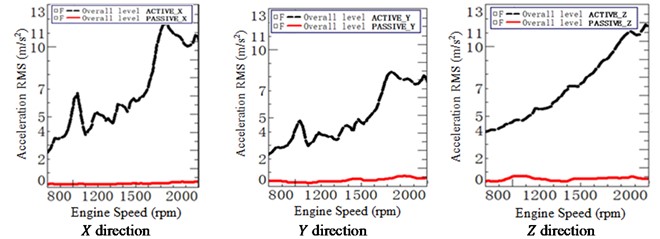
a) Front left mount (FLM)
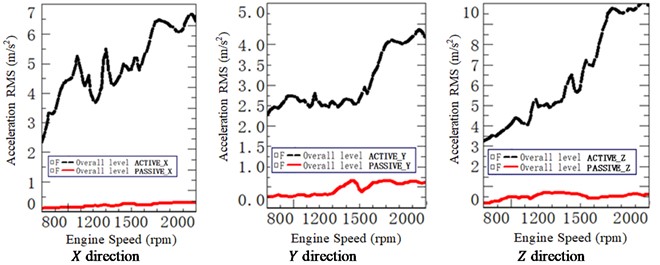
b) Front right mount (FRM)
c) Rear left mount (RLM)
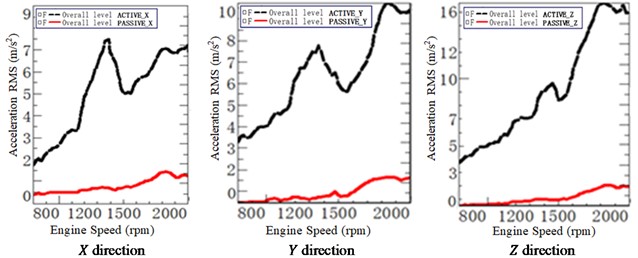
d) Rear right mount (RRM)
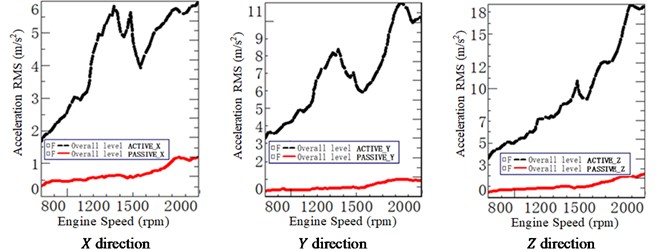
Fig. 22Mounts accelerations before and after adjustment at passive
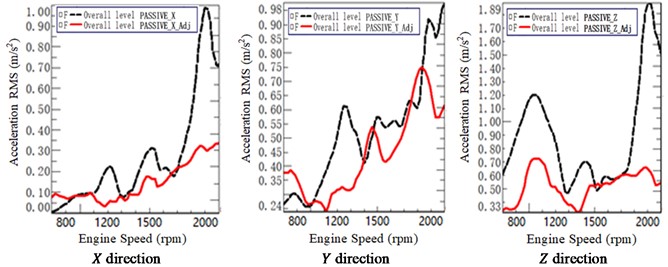
a) Front left mount (FLM)
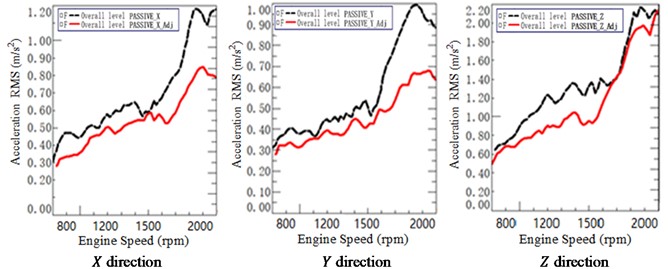
b) Rear left mount (RLM)
Fig. 22 shows the test results of the mounts (FLM and RLM) accelerations before and after adjustment at passive sides in three directions (, and direction). The dashed lines and the solid lines represent the initial status without adjustment and the status after adjustment, respectively. It can be observed from Fig. 22 that nearly all the accelerations decreased to a different extent after adjustment indicating that the adjustment has significant improvement on vibration.
5. Conclusions
1) A novel rubber mount with adjustable parameters such as stiffness, support height and limit distance was proposed in this study.
2) The influence of cone angle, thickness and height on the ratio of axial-radial stiffness was investigated by finite element method, which is beneficial to improve the design efficiency of mounts.
3) A commercial vehicle was taken as the research object to complete the calculation of mounts stiffness based on the energy decoupling method and genetic algorithm. According to the stiffness values, the structural design of mounts was completed, and the relationship between the preloading displacement and the axial and radial stiffness was studied by the method of theoretical calculation and test, which made the process of stiffness adjustment more specific and accurate.
4) The vibration isolation performance of the PMS was tested before and after adjustment. Results show that the adjusted PMS has better vibration isolation performance at idle speed and slow acceleration in place, and the new mounts can effectively improve the vibration performance of vehicle, environmental adaptability of mounts and product development efficiency.
References
-
H. Adiguna, M. Tiwari, R. Singh, H. E. Tseng, and D. Hrovat, “Transient response of a hydraulic engine mount,” Journal of Sound and Vibration, Vol. 268, No. 2, pp. 217–248, Nov. 2003, https://doi.org/10.1016/s0022-460x(03)00076-2
-
A. El Hafidi, B. Martin, A. Loredo, and E. Jego, “Vibration reduction on city buses: determination of optimal position of engine mounts,” Mechanical Systems and Signal Processing, Vol. 24, No. 7, pp. 2198–2209, Oct. 2010, https://doi.org/10.1016/j.ymssp.2010.04.001
-
W. B. Shangguan, “Engine mounts and powertrain mounting systems: a review,” International Journal of Vehicle Design, Vol. 49, No. 4, p. 237, Jan. 2009, https://doi.org/10.1504/ijvd.2009.024956
-
M. Philen, “Fluidic flexible matrix composite semi-active vibration isolation mounts,” Journal of Intelligent Material Systems and Structures, Vol. 23, No. 3, pp. 353–363, Sep. 2011, https://doi.org/10.1177/1045389x11421823
-
F. Casciati, J. Rodellar, and U. Yildirim, “Active and semi-active control of structures – theory and applications: A review of recent advances,” Journal of Intelligent Material Systems and Structures, Vol. 23, No. 11, pp. 1181–1195, May 2012, https://doi.org/10.1177/1045389x12445029
-
S. Kurczyk and M. Pawełczyk, “Fuzzy control for semi-active vehicle suspension,” Journal of Low Frequency Noise, Vibration and Active Control, Vol. 32, No. 3, pp. 217–225, Sep. 2013, https://doi.org/10.1260/0263-0923.32.3.217
-
M. Demić and J. Lukić, “A contribution to optimizing the power train suspension,” Journal of Low Frequency Noise, Vibration and Active Control, Vol. 17, No. 4, pp. 181–189, Aug. 2016, https://doi.org/10.1177/026309239801700402
-
M. S. Qatu, “Recent research on vehicle noise and vibration,” International Journal of Vehicle Noise and Vibration, Vol. 8, No. 4, p. 289, Jan. 2012, https://doi.org/10.1504/ijvnv.2012.051536
-
F.-L. Xin, L.-J. Qian, H.-P. Du, and W.-H. Li, “Multi-objective robust optimization design for powertrain mount system of electric vehicles,” Journal of Low Frequency Noise, Vibration and Active Control, Vol. 36, No. 3, pp. 243–260, Jul. 2017, https://doi.org/10.1177/0263092317719635
-
L.-F. Zheng, T. Wang, and G.-X. Li, “Vibration and noise analysis of heavy-duty trucks based on powertrain lightweighting,” Journal of Vibroengineering, Vol. 19, No. 6, pp. 4573–4590, Sep. 2017, https://doi.org/10.21595/jve.2017.18308
-
J.-F. Hu and R. Singh, “Improved torque roll axis decoupling axiom for a powertrain mounting system in the presence of a compliant base,” Journal of Sound and Vibration, Vol. 331, No. 7, pp. 1498–1518, Mar. 2012, https://doi.org/10.1016/j.jsv.2011.11.022
-
M.-R. Kim, K.-J. Kim, K.-I. Lee, and B. Bae, “10-degree of freedom modeling of full car based on base excitation modal testing,” Transactions of the Korean Society for Noise and Vibration Engineering, Vol. 27, No. 6, pp. 684–690, Nov. 2017, https://doi.org/10.5050/ksnve.2017.27.6.684
-
W.-B. Shangguan, X.-A. Liu, Z.-P. Lv, and S. Rakheja, “Design method of automotive powertrain mounting system based on vibration and noise limitations of vehicle level,” Mechanical Systems and Signal Processing, Vol. 76-77, pp. 677–695, Aug. 2016, https://doi.org/10.1016/j.ymssp.2016.01.009
-
H. Lü, W.-B. Shangguan, and D. Yu, “An imprecise probability approach for squeal instability analysis based on evidence theory,” Journal of Sound and Vibration, Vol. 387, pp. 96–113, Jan. 2017, https://doi.org/10.1016/j.jsv.2016.10.001
-
J. Wu, “A robust optimization for the frequency and decoupling ratio of a powertrain mounting system based on interval analysis,” International Journal of Automotive Technology, Vol. 13, No. 3, pp. 409–422, Mar. 2012, https://doi.org/10.1007/s12239-012-0038-z
-
M. Qatu, M. Sirafi, and F. Johns, “Robustness of powertrain mount system for noise, vibration and harshness at idle,” Proceedings of the Institution of Mechanical Engineers, Part D: Journal of Automobile Engineering, Vol. 216, No. 10, pp. 805–810, Oct. 2002, https://doi.org/10.1177/095440700221600103
-
C. Jiang, X. Han, G. R. Liu, and G. P. Liu, “A nonlinear interval number programming method for uncertain optimization problems,” European Journal of Operational Research, Vol. 188, No. 1, pp. 1–13, Jul. 2008, https://doi.org/10.1016/j.ejor.2007.03.031
-
D. Whitley, “A genetic algorithm tutorial,” Statistics and Computing, Vol. 4, No. 2, pp. 65–85, Jun. 1994, https://doi.org/10.1007/bf00175354
-
J. L. Huang, G. J. Xie, and Z. W. Liu, “Finite element analysis of super-elastic rubber materials based on the Mooney-Rivlin and Yeoh model,” (in Chinese), China Rubber/Plastics Technology and Equipment, Vol. 34, No. 12, pp. 22–26, Dec. 2008, https://doi.org/10.13520/j.cnki.rpte.2008.12.004
-
L.-R. Wang and Z.-H. Lu, “Modeling method of constitutive law of rubber hyperelasticity based on finite element simulations,” Rubber Chemistry and Technology, Vol. 76, No. 1, pp. 271–285, Mar. 2003, https://doi.org/10.5254/1.3547739
-
H. S. Lee, J. K. Shin, S. Msolli, and H. S. Kim, “Prediction of the dynamic equivalent stiffness for a rubber bushing using the finite element method and empirical modeling,” International Journal of Mechanics and Materials in Design, Vol. 15, No. 1, pp. 77–91, Nov. 2017, https://doi.org/10.1007/s10999-017-9400-7
-
W.-B. Shangguan and Z.-H. Lu, “Experimental study and simulation of a hydraulic engine mount with fully coupled fluid-structure interaction finite element analysis model,” Computers and Structures, Vol. 82, No. 22, pp. 1751–1771, Sep. 2004, https://doi.org/10.1016/j.compstruc.2004.05.017
About this article

The research is supported by: “Qinglan Project” funding project of Jiangsu Colleges and universities; Research Project of professor or doctor in Wuxi Institute of Technology (10493121018).
The datasets generated during and/or analyzed during the current study are available from the corresponding author on reasonable request.
Bao-Shan Shen: presentation of research content; construction of research objectives and ideas; structural design and finite element calculation; stiffness test of the mounts; writing and revision of the paper. Mei-Juan Zhang: stiffness optimization calculation; preparation and completion of powertrain inertia parameter test. Jun-Jun Jin: preparation, data collation and data analysis of vibration isolation performance test of the powertrain mounting system.
The authors declare that they have no conflict of interest.
