Abstract
In hydro-power systems, the fault of equipment is an important potential threat for the safe production of electricity. Therefore, the automation and intelligence of fault diagnosis becomes the popular issue in the research on hydro-power system. In this paper, a knowledge graph-based method is put forth to diagnose faults occurred in hydro-power systems, since the knowledge graph can store structured and unstructured data for better fault diagnosis and intelligently search the reasons of the faults. First, we model the knowledge graph for hydro-power plants, where the rational path for the fault reason is formulated. Then, the bi-directional long short-term memory (Bi-LSTM) with conditional random field (CRF) is used to extract the entities and relations to the given documents, which record the phenomenon and reasons for the occurred faults. Moreover, the attention scheme is employed in the Bi-LSTM to weigh the closer relationships to improve the diagnosis accuracy. An automatic diagnosis algorithm is developed to improve the diagnosing efficiency by constructing rational paths, with which directive and in-directive factors for occurring faults can be traced. Simulation results reveal that the intelligent search method with a knowledge graph can effectively find the reason, locate the position, and provide useful suggestions for the occurred faults.
Highlights
- We propose a knowledge graph model to express the relationships between different entities in hydro-power plants.
- We develop the Bi-LSTM with conditional random field to label the entities in the given documents that record the phenomenon and the reasons for the occurred faults.
- To improve the efficiency of diagnosis, an automatic diagnosis algorithm is developed to construct the relationship path, and the algorithm can find the headstream for the occurred faults.
1. Introduction
Nowadays, hydro-power plants are highly automated with complex protection, automation, and monitoring systems that support safe and stable operation [1]. Furthermore, the increasing complexity of the hydro-power plants leads to a greater number of failures of the automation systems, which causes the reliability of the plants to fluctuate significantly. This can severely affect power generation, ranging from economic losses to serious and dangerous events. At the same time, automation equipment is often inadequately maintained. In addition, the equipment is exposed to electromagnetic interference, which blocks the reception of the information from the equipment and affects the related mechanical construction process. In this case, the useful life of the equipment is shortened, and the operation of the hydro-power plants is affected. Add to that, due to the influence of natural and other factors on the equipment, the working environment of the equipment has become more complex and severe [2]. To avoid such events, effective and timely fault diagnosis for hydro-power plants is an emergency research issue [3].
To solve the problem, the data-based approaches are initially investigated on faults diagnosis for hydro-power plants, i.e., mining information in data and training models [4]. The database-aided approaches can achieve high diagnosis accuracy without requiring efficient expert knowledge [5]. However, data-based approaches also have two problems. The first problem is that the machine learning model is a black box for users, which cannot provide explanations for the output diagnostic results [6]. This reduces the credibility of practical engineering applications [7]. Second, the data-based fault diagnosis methods cannot effectively utilize the existing prior knowledge, e.g., fault manuals and other unstructured knowledge, resulting in knowledge waste [8].
In this case, expert knowledge-based knowledge is used for fault diagnosis by extracting entities and relationships from unstructured knowledge [9]. Thus, the knowledge graph-based method can provide a unified and standardized representation of unstructured knowledge. Furthermore, the concepts and their relationships can be described in symbolic form. In this way, entities and their associated attribute-value pairs can be linked [10]. Depending on the scenario, knowledge graphs can be categorized into two aspects, i.e., general knowledge graphs and domain knowledge graphs [11]. First, the general knowledge graph is used in the general domain, assuming the breadth of knowledge. Second, the domain knowledge graph focuses on a specific domain, assuming the depth of knowledge [12]. Therefore, the domain knowledge graph is usually constructed based on industry databases and targets industry practitioners and potential industry insiders. The application of knowledge graphs to fault diagnosis focuses on fault detection, question and answer, inference, and recommendation [13, 14].
Recently, knowledge graphs have been intensively utilized in many fields, such as medical, social, and movie reviews. For example, Liu et. al. [15] showed that multiple railroad operation faults and hazards form a causal network due to their connections, where the knowledge graphs are used to explore railroad operation faults in a causal network of railroad operation faults. To intelligently diagnose faults, the authors proposed a knowledge graph-based method to determine the correlation between expert knowledge and products. Inspired by this idea, Ou et al. used the information and knowledge collected from the smart grid terminals to monitor and maintain the unattended network [16]. To improve the efficiency of diagnosis, a question-answer scheme with a knowledge graph is proposed to diagnose the faults caused by the massive access of a large number of heterogeneous terminals to the smart grid [17]. Accordingly, the application of the knowledge graph in the field of fault diagnosis can accurately and comprehensively describe the fault reason and provide a new solution to the fault diagnosis [18]. However, to the best of the author's knowledge, the automatic fault diagnosis on hydro-power plants is still a challenge. Moreover, the traditional fault diagnosis algorithm with a knowledge graph cannot output the relationship path, used to reveal the indirect reasons for the occurring faults [19].
In this paper, we propose a knowledge graph-based diagnosis method to diagnose the faults in hydro-power systems. The contributions are listed as follows.
1) We propose a knowledge graph model to express the relationships between different entities in hydro-power plants. Moreover, according to the designed knowledge graph model, the relationship path of the occurred faults can be constructed.
2) We develop the Bi-LSTM with conditional random field (CRF) to label the entities in the given documents that record the phenomenon and the reasons for the occurred faults. Moreover, the attention scheme in the Bi-LSTM with CRF is used to select the closer relations from the testing data set.
3) To improve the efficiency of diagnosis, an automatic diagnosis algorithm is developed to construct the relationship path. According to the relationship path, the algorithm can find the headstream for the occurred faults.
4) Simulation results reveal that the proposed knowledge graph can find the faults in the given document about faults faster and with higher accuracy in comparison with traditional methods.
The rest of this paper is organized as follows. In Section 2, we describe the knowledge graph model of the relation path. In Section 3, we design the proposed relation extraction method and the automatic diagnosis algorithm. and then the experimental results with the proposed fault diagnosis method are presented in Section 4. Finally, we conclude this paper in Section 5.
2. Knowledge graph model
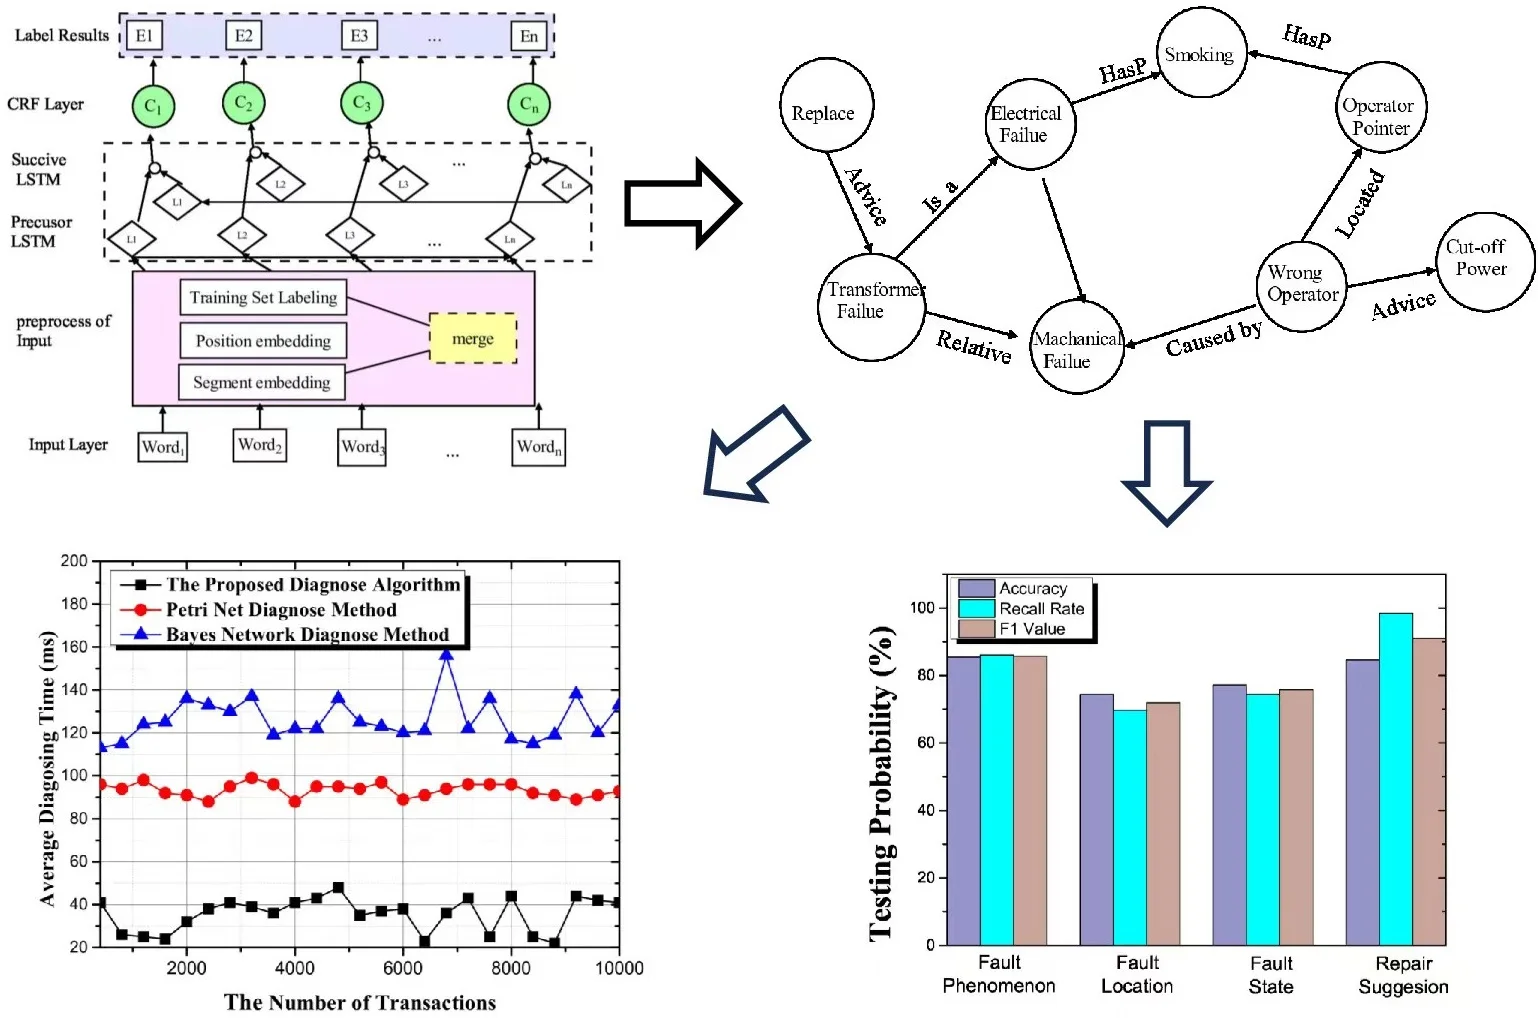
The knowledge graphs can be constructed in two ways: top-down and bottom-up, the top-down approach refers to constructing ontology. Then extracting entities and relationships based on the ontology. The bottom-up approach refers to extracting entities and relationships. The abstraction of the ontology by inducing the cluster with the extraction results. The top-down construction method is suitable for professional domain knowledge graphs with clear knowledge scope. In addition, the bottom-up construction method is mainly used for general knowledge graphs with wide knowledge coverage. Since the fault diagnosis on hydro-power system is a professional, we employ top-down knowledge graph construction method, as shown in Fig. 1. A typical knowledge graph construction consists of four steps: ontology construction, entity extraction, relationship extraction, and graph construction.
Knowledge graphs can be created in two ways: Top-Down and Bottom-Up, where the Top-Down approach refers to the creation of the ontology [20]. Then, entities and relationships are extracted based on the ontology. The Bottom-Up approach refers to the extraction of entities and relationships. The abstraction of the ontology by inducing the cluster with the extraction results. The Top-Down construction method is suitable for professional knowledge graphs with clear knowledge scope. On the other hand, the Bottom-Up construction method is mainly used for general knowledge graphs with a large knowledge coverage [21]. Since the fault diagnosis in the hydro-power plant is a professional task, we employ the Top-Down construction method for knowledge graphs, as shown in Figure 1. A typical knowledge graph construction consists of four steps: ontology construction, entity extraction, relations extraction, and graph construction.
Fig. 1An example model of the knowledge graph
Ontology construction also means that entities, attributes, and relationships in the knowledge graph can be clearly defined. In the Top-Down knowledge graph construction process, ontology construction starts from the top-level concepts to build ontologies, which are refined into entities and relationships. Then, we use a six-dimension vector to express knowledge ontology (KO) expressed as:
where is the set of the conceptions, is the relationship set, is the set of the attribution of conceptions, is the attribution of Relationships, and is the entity of the relationships.
The conception set is defined as:
where is the number of the conceptions.
Similarly, the entity set can be defined as:
where is number of the entities.
Let , be the -th, -th conceptions in the concept sets. For any , there exists (, , and ), and it holds that:
where is the relation between and . is used to express the relationship of conception and is the relationship between of and . The definition of the attribution set is defined as:
where is the attribution of the KO and is the attribution of conceptions. The relationship path consists for any , and we have:
where is the definition domain of the , is the value domain of relations. It is hold that:
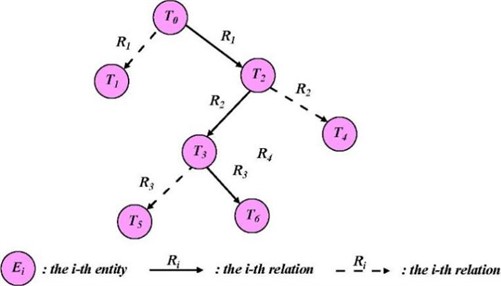
The relation path is expressed as:
where is expressed as , is expressed as , and can also be derived with the same method.
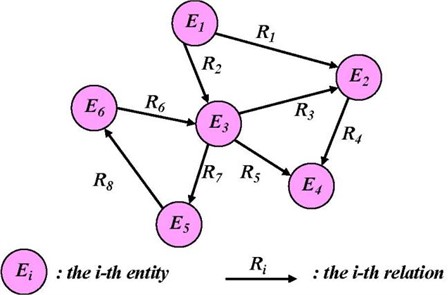
Fig. 2An example of the knowledge relation path
In Fig. 2, the entities from to can be expressed as:
where is the with value domain , is the with value domain , and is the with value domain .
3. Entity and relation extraction
In this model, each word of the original document is treated as a node, and each relation is treated as an edge connecting its head entity and tail entity. The relation refers to the connection between entities, and after the entity extraction is completed, the relation extraction is performed according to the entities. Relation extraction can be used to automatically detect the relationship between entities from the original documents, and the accuracy of relation extraction directly affects the quality of the knowledge graph.
3.1. Entity extraction with Bi-LSTM aided by CRF
Bidirectional Long Short-Term Memory Network (Bi-LSTM) is a commonly used entity extraction algorithm. The principle is to connect two LSTMs with opposite timing directions to the same output. When performing entity extraction, it need to use both the information above and below. Conventional LSTMs can only use the information above but not below, which makes it difficult to be used to achieve accurate entity extraction. Bidirectional LSTM achieves the utilization of contextual information by connecting two LSTMs with opposite timing directions to the same output, solving the problem that LSTMs are unable to use the following information and improving the effectiveness of entity extraction.
The core of the bi-directional LSTM network structure is the merging of two LSTMs, where one LSTM is forward and the other is reverse. The forward LSTM can utilize its historical data, i.e., the antecedent information; while the historical data that the reverse LSTM can utilize is the posterior information. The bidirectional LSTM combines the outputs of the forward LSTM and the reverse LSTM so that its output at the current time node can then utilize both the forward and backward information in both directions, unlike the normal LSTM which can only use the forward information. There is no state sharing between the two different directions of the LSTMs that constitute a bidirectional LSTM, i.e., the output state of the forward LSTM only have an effect on the forward LSTM. The output state of the reverse LSTM only have an effect on the reverse LSTM and there is no direct connection between them and they will not affect each other.
The inputs of each time node are passed to the forward and reverse LSTMs respectively. These LSTMs have no effect on each other according to their respective inputs. The forward LSTM can produce outputs according to their respective states. These two outputs are connected together to the output node of the bidirectional LSTM, and together combine to form the final output. Although the two directions of the LSTM network LSTMs basically do not intersect, their contribution to the output of the current time node and the resulting loss can then be computed during training, and their parameters are optimized based on the gradient.
Fig. 3The Bi-LSTM scheme with CRF
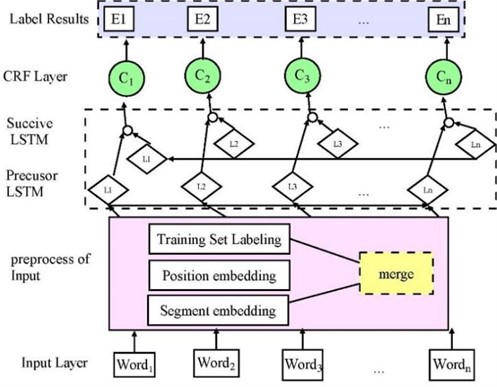
In this paper, we use the Bi-LSTM aided by CRF to extract the entities, since BI-LSTM is able to handle the bidirectional long-term dependency with a large span in distance between entities. Since the total content of the constructed knowledge graph is very large, some of the contents of the knowledge graph are preferentially selected by using the attention scheme. In the following, we first focus on entity extraction with CRF from the given document, as shown in Fig. 3.
Since the CRF layer can learn the transition probability among different labels, the probability of the derived entities can be guaranteed. In this case, the CRF can be computed with the state of the entities. The entity as with the label can be calculated by:
where is the transmitting probability matrix, from to , is the output matrix of the Bi-LSTM. We denote the -th label as . Given , the probability of the label is:
where is the label for and is the real label. Thus, the training target is to maximize . Thus, we adopt the loss function as:
Accordingly, the maximal probability of labelled with y can be given by:
3.2. Relation exaction with Bi-LSTM aided by attention
In this subsection, we use the attention model to reduce the number of relations. Since the attention model can assign more attention to important parts, we add an attention layer between the output layer and the hidden layer of the Bi-LSTM to adjust the weight of the output, as shown in Fig. 4.
Fig. 4The LSTM with attention model
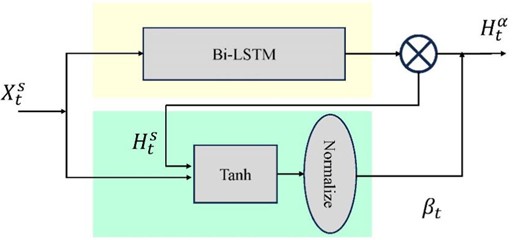
In the Fig. 4, is the input of the of the -th visiting point, is the output of the Bi-LSTM of the -th time slot of the -th visiting point, is the output of normalization module for the th time slot, and is the output of the Bi-LSTM with attention mechanism with is the weight obtained by attention mechanism.
The proposed models based on the attention mechanism generally contain two computational processes, one is the computational process about the probability distribution, and the other is the computational process of the final features with the attention distribution. Let be the attention probability of the output data for the final state at the -th time slots, which can be given by:
where denotes the number of input sequence elements, is the sum of the hidden layer state values in both directions at the -th time slot, expressed as:
where is the number of category labels, is the weight matrix, denotes the sum of the final hidden layer state values in each independent direction in the Bi-LSTM. Let be the feature of attention distribution, which can be expressed as:
With , the probability distribution of the classification labels is calculated with a soft-max function in the output layer. Thus, the calculation process is given by:
where with being the weight matrix of the output layer, which represents the value of the -th component in the vector. The vector length is equal to the number of classification labels.
By using the softmax function, the probability distribution of under the attention mechanism can be obtained. Note that, the loss entropy can be calculated with:
where denotes the probability distribution of the true category.
3.3. Automatically diagnose algorithm for rational path
In this paper, the training data is taken from the fault manual of a hydro-power plant. This document contains the possible failure modes (failures that occur), failure manifestations, failure causes, and resolution measures for the hydro-power plants. In this document, parts of the faults can be described in Table 1.
In this example, we can obtain the relations. (1) R1 = Located (C11, C13) represents that the wrong operation place is located at the operator. (2) R2 = Relative (C4, C9) represents that the transform failure relates with mechanical improper. (3) R3 = Suggest (C4, C10) represent the advice to replace. (4) R4 = HasP (C3, C9) the false appearance. According to relations, a knowledge graph can be given as Fig. 5.
With the obtained knowledge graph, we design the algorithm to diagnose the fault of the devices as shown in Table 2.
In Algorithm 1, the operation follows these steps. In step 1, the input set denoted as is the phenomenon set. visit the false phenomenon set , to judge whether , where is the entity set. If holds, the entity set can be used to diagnose the reason, and thus is updated by . Otherwise, the entities are deleted from .
In step 2, we use the knowledge mat to obtain the relations. By consulting the Entity-Relation table, the reverse relation to create the related faults reason set . Create fault relation value .
Table 1Entity relation example
Entity 1 | Relation | Entity 2 |
Insulation fault (C1) | Cause by | Generator abnormal (C6) |
Circuit breaker (C2) | HasP | Relay malfunction (C7) |
Electrical equipment fault (C3) | HasP | Smoke (C9) |
Transformer failure (C4) | Relative | Mechanical improper (C5) |
Transformer failure (C4) | Suggestion | Replace (C10) |
Mechanical improper (C5) | Caused_by | Wrong operation (C11) |
Generator fault (C6) | Is_a | Mechanical improper (C5) |
Instrumentation failure (C8) | Is_a | Mechanical improper (C5) |
Transformer failure (C4) | Is_a | Electrical equipment fault (C3) |
Wrong operation (C11) | Suggestion | Cut-off power (C12) |
Wrong operation (C11) | Located | Operator pointer (C13) |
Fig. 5Knowledge graph visualization example for hydro-power systems
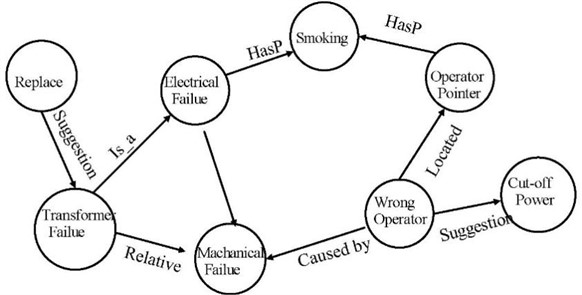
Table 2Algorithm 1: automatically diagnose algorithm
Input: false phenomenon set Output: All Relation Path 1: Visit false phenomenon set 2: if () {} 3: Else 4: while (The is not empty) { 5: Create a Relation 6: 7: i++} 8: repeat { 9: If () Append (, , Entity ) 10: Else } 11: until ( is not in Left ) 12: Order the Fault Reason th |
In step 3, verify that there exists a relationship path between the set of associated structural entities and the set of fault phenomena . If the relationship exists, the set of indirectly associated failure phenomenon entities is introduced by according to the relationship path . If it does not exist, the search failures and the set of indirectly associated failure causes, denoted as .
In step 4, Iteratively derive the rational path according to the ration set. Create indirect relation according to until . Finally, output the diagnose reason path, with the form as .
4. Experimental result and analysis
In this section, we present the experimental results of the proposed fault diagnosis method aided by Bi-LSTM with attention. Neo4j was used to build knowledge graphs, since Neo4j has many advantages, including high performance, design flexibility, and development agility. In addition, building the data model with Neo4j is intuitive and clear. To extract the entities and their relations from unstructured knowledge, the training parameters of the LSTM scheme are listed in Table 3.
In addition, the number of data for the attention scheme is listed in Table 4.
Table 3Parameter setting for Bi-LSTM
Label type | Entity numbers |
LSTM size | 128 |
Dropout | 0.5 |
Learning rate | 1E-4 |
Batch size | 32 |
Epoch | 200 |
Table 4Labeling example
Label Type | Relation | Entity numbers |
X_DES | Phenomenon | 5000 |
X_LoC | Location | 6000 |
X_STA | False State | 4600 |
X_SUG | Fix Suggestion | 2000 |
In this paper, we employ three indicators to evaluate the quality of relation extraction, i.e., accuracy and recall, and F1. First, the accuracy of the relation extraction is given by:
where is the number of characters actually extracted for a label and manually labeled for that label, is the number of characters manually labeled for a label and not actually extracted for that label.
Second, the recall rate is given by:
where is the number of characters actually extracted for a label and not manually labeled for that label.
Third, F1 (F-measure) represents the average trade-off between recall rate and accuracy, which can more comprehensively evaluate the recall rate and accuracy. The calculation of F1 is given by:
The tested trained model is used to extract the entities in the remaining original corpus to complete the relation extraction based on the attention mechanism of the BI-LSTM algorithm. We use the sampling method to create the training set, testing set, and verification set. For the different types of fault occurred faults, the accuracy of the extraction results is shown in Fig. 6.
Fig. 6The testing results with proposed diagnose algorithm
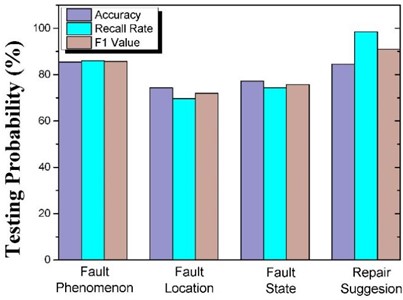
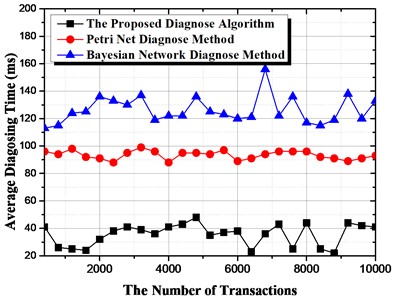
Fig. 7The testing results with proposed diagnose algorithm
As shown in Fig. 6, the proposed method uses knowledge map technology to exploit the relationships between the device structures and incorporate them into the diagnostic reasons. The experimental results show that the accuracy of the test cases for this method is 90.6 % to achieve effective utilization of the relationship between device structures. Second, we can observe that the recognition is much better than that of fault location and state. The reason is due to the fact that the description of repair suggestions and fault phenomena is highly structured and consists of two or three words, e.g., oil spill, insufficient power. The accuracy of fault location and fault status is lower, since the description of the positions of fault location and fault status in the sentence is more random, which leads to lower detection accuracy. In addition, the context information of fault location and fault status is highly uncertain, and thus cannot be normally trained and tested with small data sets.
From Table 5, we can observe that the recognition result obtained by the Bi-LSTM with CRF model labeling scheme, with F1 is 90.25 %. The fault diagnosis accuracy of this method is 92.1 %, which is much higher than that of the traditional rule-based fault diagnosis methods. Therefore, the proposed method can effectively solve the problem of inaccurate fault diagnosis in hydro-power plants.
To evaluate the efficiency of the automatic fault diagnosis algorithm, we compare the proposed diagnosis algorithm with two benchmark methods, i.e., the diagnosis algorithm with Petri net and Bayesian net, as shown in Fig. 7. First, we can observe that the average diagnosis time with the proposed algorithm is much shorter than that with the Petri net and Bayesian network. The reason is that the Petri net and Bayesian net cannot automatically create the relationship paths, and the online detector of the Petri net and Bayesian net needs much time to find the final reason for the faults. Second, the Petri-net-based diagnosis method is much faster than the Bayesian net algorithm, since the calculation of the transmission probability of the different events.
Table 5Diagnose results with Bi-LSTM aided by attention
Model | Accuracy | Recall rate | F1 |
CRF | 86.54 | 78.25 | 82.19 |
Bi-LSTM with CRF | 86.81 | 84.58 | 85.8 |
5. Conclusions
In this paper, we propose a novel method based on knowledge graph to diagnose faults for hydro-power plants, where the knowledge graph can be used to intelligently search for the reasons for occurred faults. We first construct the knowledge graph for typical hydro-power plants, and the formulated rational path is used to trace the headstream of faults. Second, we develop the Bi-LSTM with CRF to label the entities in the given documents that recorded the phenomenon and the reasons for the faults. In addition, a Bi-LSTM with an attention scheme was developed, which can be used to select the closer relationships between the entities. Finally, we design an automatic diagnosis algorithm to improve the efficiency of diagnosis by constructing relationship paths to trance the headstream for the occurred faults. Simulation results reveal that the intelligent search based on the knowledge graph has good applications in the field of fault detection.
References
-
J. Jiang, “Reliability test and analysis of electrical automation control equipment,” Applied Mechanics and Materials, Vol. 556-562, pp. 2380–2383, May 2014, https://doi.org/10.4028/www.scientific.net/amm.556-562.2380
-
A. Khrennikov, “Fault detection of electrical equipment. Diagnostic methods,” International Journal of Automation and Control Engineering, Vol. 2, No. 1, pp. 19–27, 2013.
-
N. Md Nor, C. R. Che Hassan, and M. A. Hussain, “A review of data-driven fault detection and diagnosis methods: applications in chemical process systems,” Reviews in Chemical Engineering, Vol. 36, No. 4, pp. 513–553, May 2020, https://doi.org/10.1515/revce-2017-0069
-
B. Gou, Y. Xu, Y. Xia, G. Wilson, and S. Liu, “An intelligent time-adaptive data-driven method for sensor fault diagnosis in induction motor drive system,” IEEE Transactions on Industrial Electronics, Vol. 66, No. 12, pp. 9817–9827, Dec. 2019, https://doi.org/10.1109/tie.2018.2880719
-
K. Hao, L. Yuan, and W. Zhang, “Distributed hop-constrained s-t simple path enumeration at billion scale,” Proceedings of the VLDB Endowment, Vol. 15, No. 2, pp. 169–182, Oct. 2021, https://doi.org/10.14778/3489496.3489499
-
L. Yuan, L. Qin, W. Zhang, L. Chang, and J. Yang, “Index-based densest clique percolation community search in networks,” IEEE Transactions on Knowledge and Data Engineering, Vol. 30, No. 5, pp. 922–935, May 2018, https://doi.org/10.1109/tkde.2017.2783933
-
Z.-B. Yang, J.-P. Zhang, Z.-B. Zhao, Z. Zhai, and X.-F. Chen, “Interpreting network knowledge with attention mechanism for bearing fault diagnosis,” Applied Soft Computing, Vol. 97, p. 106829, Dec. 2020, https://doi.org/10.1016/j.asoc.2020.106829
-
Y. Chi, Y. Dong, Z. J. Wang, F. R. Yu, and V. C. M. Leung, “Knowledge-based fault diagnosis in industrial internet of things: a survey,” IEEE Internet of Things Journal, Vol. 9, No. 15, pp. 12886–12900, Aug. 2022, https://doi.org/10.1109/jiot.2022.3163606
-
A. Hur, N. Janjua, and M. Ahmed, “A survey on state-of-the-art techniques for knowledge graphs construction and challenges ahead,” in 2021 IEEE Fourth International Conference on Artificial Intelligence and Knowledge Engineering (AIKE), pp. 99–103, Dec. 2021, https://doi.org/10.1109/aike52691.2021.00021
-
S. Ji, S. Pan, E. Cambria, P. Marttinen, and P. S. Yu, “A survey on knowledge graphs: representation, acquisition, and applications,” IEEE Transactions on Neural Networks and Learning Systems, Vol. 33, No. 2, pp. 494–514, Feb. 2022, https://doi.org/10.1109/tnnls.2021.3070843
-
Z. Chen, L. Yuan, L. Han, and Z. Qian, “Higher-order truss decomposition in graphs,” IEEE Transactions on Knowledge and Data Engineering, Vol. 35, No. 4, pp. 3966–3978, Apr. 2023, https://doi.org/10.1109/tkde.2021.3137955
-
N. Queralt-Rosinach et al., “Structured reviews for data and knowledge-driven research,” Database, Vol. 2020, Jan. 2020, https://doi.org/10.1093/database/baaa015
-
M. R. A. H. Rony, D. Chaudhuri, R. Usbeck, and J. Lehmann, “Tree-KGQA: an unsupervised approach for question answering over knowledge graphs,” IEEE Access, Vol. 10, pp. 50467–50478, 2022, https://doi.org/10.1109/access.2022.3173355
-
D. Sousa and F. M. Couto, “Biomedical relation extraction with knowledge graph-based recommendations,” IEEE Journal of Biomedical and Health Informatics, Vol. 26, No. 8, pp. 4207–4217, Aug. 2022, https://doi.org/10.1109/jbhi.2022.3173558
-
J. Liu, F. Schmid, K. Li, and W. Zheng, “A knowledge graph-based approach for exploring railway operational accidents,” Reliability Engineering and System Safety, Vol. 207, p. 107352, Mar. 2021, https://doi.org/10.1016/j.ress.2020.107352
-
Q. Ou, W. Zheng, W. Qi, J. Fang, Z. Liu, and Y. Zhu, “Research on the construction method of knowledge graph for electric power wireless private network,” in 2020 IEEE 10th International Conference on Electronics Information and Emergency Communication (ICEIEC), pp. 10–13, Jul. 2020, https://doi.org/10.1109/iceiec49280.2020.9152356
-
Z. Zhao, X. Wang, X. Xu, and Q. Wang, “Multi-modal question answering system driven by domain knowledge graph,” in 2019 5th International Conference on Big Data Computing and Communications (BIGCOM), pp. 43–47, Aug. 2019, https://doi.org/10.1109/bigcom.2019.00015
-
J. Deng, T. Wang, Z. Wang, J. Zhou, and L. Cheng, “Research on event logic knowledge graph construction method of robot transmission system fault diagnosis,” IEEE Access, Vol. 10, pp. 17656–17673, 2022, https://doi.org/10.1109/access.2022.3150409
-
J. Wu et al., “Fault diagnosis of the HVDC system based on the CatBoost algorithm using knowledge graphs,” Frontiers in Energy Research, Vol. 11, p. 1144785, Mar. 2023, https://doi.org/10.3389/fenrg.2023.1144785
-
X. Zhang and Z. Ma, “Fuzzy RDF knowledge graph embeddings through vector space model,” IEEE Transactions on Fuzzy Systems, Vol. 31, No. 3, pp. 835–844, Mar. 2023, https://doi.org/10.1109/tfuzz.2022.3190633
-
Feng Han and Song-Chun Zhu, “Bottom-up/top-down image parsing with attribute grammar,” IEEE Transactions on Pattern Analysis and Machine Intelligence, Vol. 31, No. 1, pp. 59–73, Jan. 2009, https://doi.org/10.1109/tpami.2008.65
About this article

This work was supported by State Grid Electric Power Company Science and Technology Project “Research, develop, and application on intelligent power peak modulation devices and systems based on intelligent sensor and edge computing” with No. 5700-202140381A-0-0-00.
The datasets generated during and/or analyzed during the current study are available from the corresponding author on reasonable request.
Bilei Guo: conceptualization, writing – original draft preparation, and software. Yining Wang: resources, project administration, and funding acquisition. Weifeng Pan: supervision, data curation, and formal analysis. Yanlin Sun: methodology, validation, and writing – review and editing.
The authors declare that they have no conflict of interest.
