Abstract
Through a series of static mechanical tests and (SHPB) dynamic impact tests, the static and dynamic mechanical parameters of rock as represented by yellow sandstone are determined, and the Holmquist-Johnson-Cook model parameters of the rock are calibrated using the test data and theoretical calculations. The feasibility of a numerical model is verified, and numerical analysis of the SHPB impact process under different radial pressure pre-loading is carried out on the basis of good verification. The results show that with increasing impact load, the degree of rock breakage increases, as does the dynamic tensile strength. With the application of increasing pre-static pressure, the dynamic tensile strength of the rock decreases gradually, and the maximum radial cumulative strain increases continuously under a given impact pressure, indicating that micro-cracks in the rock develop initially and then expand under the influence of pre-static pressure; the rock is more easily broken, and its weakening degree increases. Under coupled dynamic and static loading, the energy utilization rate of rock in the Brazilian splitting process is jointly affected by axial compression ratio and impact load. Too large a pressure ratio will reduce the strain-rate sensitivity of rock, resulting in low energy utilization rate, while too low an axial compression ratio will make the dynamic tensile strength of rock relatively high, which is not conducive to tensile failure. Therefore, on the premise of clear fracture form requirements, a suitable combination of axial compression ratio and impact velocity can improve the rock crushing effect and energy utilization rate.
Highlights
- Through a series of static mechanical tests and (SHPB) dynamic impact tests, the static and dynamic mechanical parameters of rock as represented by yellow sandstone are determined, and the Holmquist-Johnson-Cook model parameters of the rock are calibrated using the test data and theoretical calculations.
- With the application of increasing pre-static pressure, the dynamic tensile strength of the rock decreases gradually, and the maximum radial cumulative strain increases continuously under a given impact pressure, indicating that micro-cracks in the rock develop initially and then expand under the influence of pre-static pressure.
- On the premise of clear fracture form requirements, a suitable combination of axial compression ratio and impact velocity can improve the rock crushing effect and energy utilization rate.
1. Introduction
In the field of mining engineering, researchers have long been concerned with the problem of rock fragmentation. Currently, the method used most commonly for breaking rocks is explosive blasting, which is cheap, simple, and likely to dominate for a long time to come [1]. By contrast, mechanical rock breaking is expensive and suitable for crushing only soft rocks, not hard ones; it is characterized by low working efficiency, high mechanical equipment loss, and high economic cost, which is why blasting is the main rock-breaking method for mining engineering now and likely in the future [2].
As shallow energy is depleted, it becomes imperative for mining projects to go deeper [3]. Deep rock masses are in a unique environment characterized by the so-called three highs and one disturbance, i.e., high ground stress, high temperature, high karst water pressure, and intense mining disturbance. Unlike a shallow rock mass, the fracture process of a deep rock mass under dynamic load is largely dependent on its ground stress environment. In response to this problem, as early as 1972, Christenson et al. [4] proposed the influence of confining pressure on rock impact dynamics tests, and since then there has been much research and many gratifying results. In the blasting excavation design of an underground hydropower station, Lu et al. [5] found that when the crustal stress exceeds 10-12 MPa, the blasting scheme designed for shallow rock masses is no longer applicable, indicating again that the high ground stress of deep rock masses cannot be ignored.
To explore further the dynamic mechanical properties and fracture characteristics of rocks under the coupled influence of crustal stress and explosion load, Zhang et al. [6] conducted blasting tests under static stress on sandstone samples by means of a servo press, and by combining high-speed photography and digital image correlation technology, they studied how the static stress influenced the evolution of the specimen surface strain field and the law governing crack propagation. Yi et al. [7] used a theoretical model to explain the mechanism whereby crustal stress influences blasting crack growth, and they carried out numerical simulations of four cases under different crustal stress conditions; it was found that crack growth was controlled by explosion load near the hole, while high crustal stress affected crack growth in the far field. He et al. [8] used a static–dynamic loading test device and a high-speed camera to study the deformation characteristics of deep rocks under the action of blasting, and they obtained the strain field and crack propagation of rocks under confining pressure.
To investigate comprehensively the coupled effects of crustal stress and blasting load, it is first necessary to clarify the dynamic mechanical characteristics and crushing effect of rock masses under different horizontal confining pressures. Furthermore, considering the inherent properties of rock formations, it is essential to establish an accurate load model for deep rock and elucidate the interaction mechanisms pertaining to energy storage and the dissipation of interfering energy within the rock matrix. This comprehensive understanding will allow for deep understanding of both the static load-induced dynamic mechanical properties of rock and the intricacies of rock blasting mechanisms [9]. Because of the complexity of the explosion process, the split Hopkinson pressure bar (SHPB) has been used widely to study the dynamic mechanical properties of deep rock masses and has produced fruitful results [10-13]. To lay a foundation for studying the laws governing deep rock blasting, this paper takes yellow sandstone as the research object and uses numerical simulations to explore in depth the dynamic mechanical parameters of rock samples and the law linking energy dissipation with radial pressure ratio, and it provides a novel and effective method for researching the dynamic mechanical characteristics of deep rock.
2. SHPB dynamic impact tests
2.1. Sample preparation
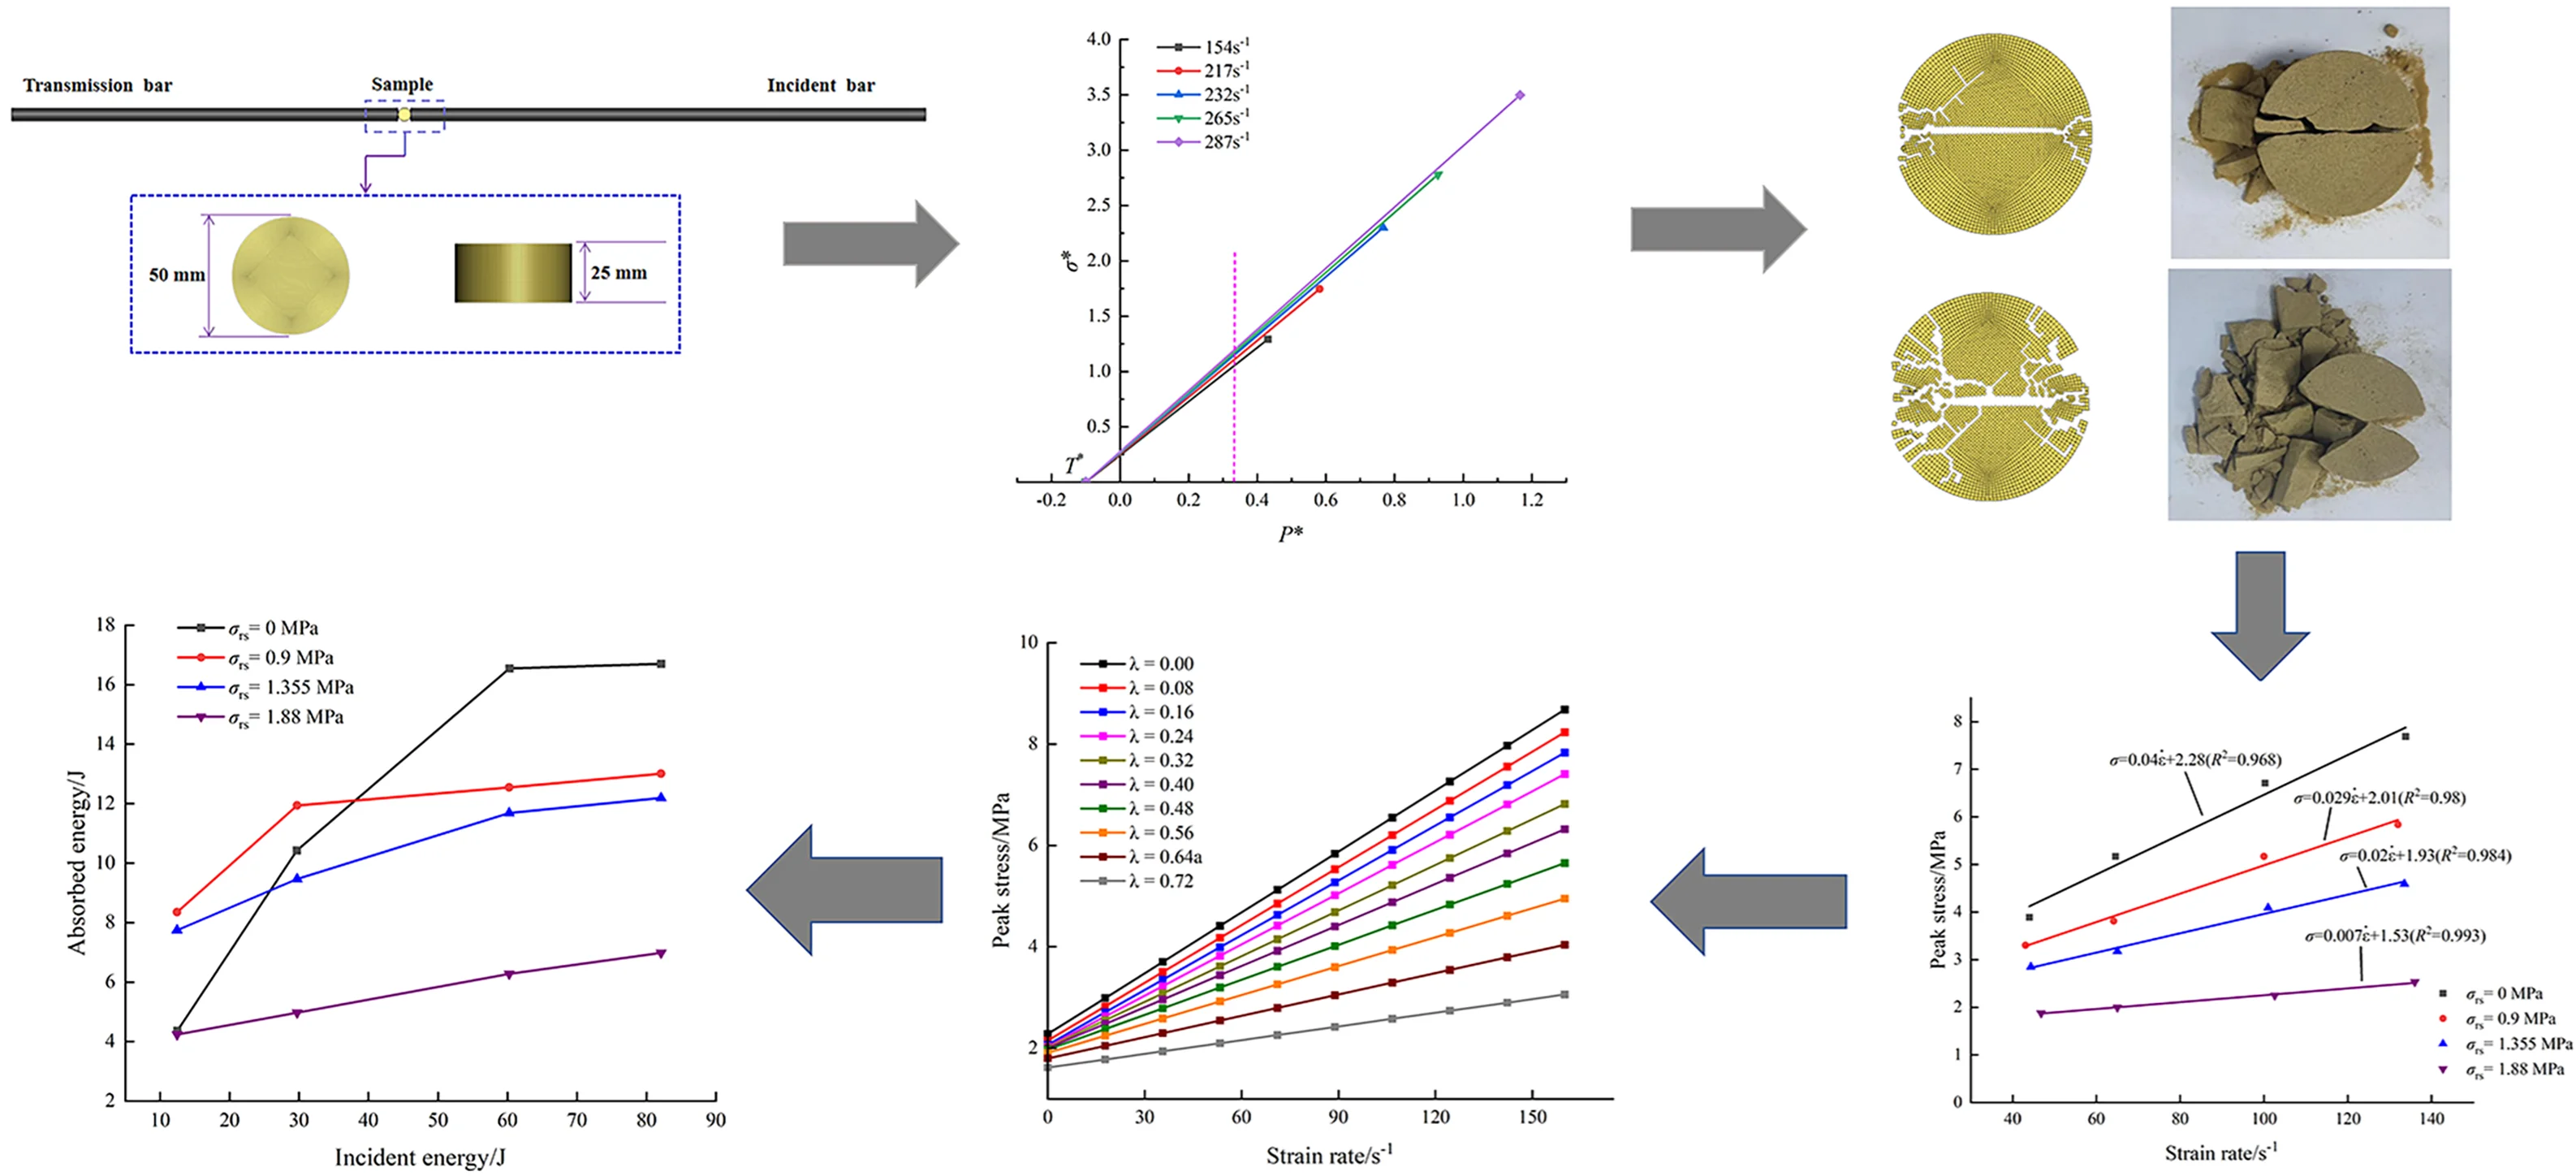
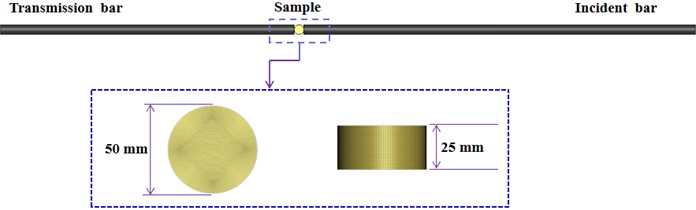
Yellow sandstone with good integrity and homogeneity was selected as the research object, and the rock was processed into standard samples according to the method recommended by the International Society of Rock Mechanics [14]. Uniaxial compression tests were performed on cylindrical specimens (Ø50 mm×100 mm), and dynamic impact tests were performed on round cake specimens (Ø50 mm×25 mm). The two ends of a specimen were perpendicular to the axis, the maximum deviation was within 0.25°, and the end surface roughness was less than 0.1 mm, as shown in Fig. 1. Tables 1 and 2 give the results of the static compressive and tensile tests, respectively.
Table 1Data from uniaxial compression tests on rock
Specimen no. | Dimensions (mm) | Loading rate (mm/min) | Compressive strength (MPa) | Deformation modulus (GPa) | Poisson’s ratio | ||||
Diameter | Height | Measured | Average | Measured | Average | Measured | Average | ||
1 | 50.57 | 100.41 | 0.002 | 25.50 | 24.8 | 4.13 | 4.06 | 0.21 | 0.22 |
2 | 51.22 | 98.88 | 0.002 | 23.35 | 4.06 | 0.23 | |||
3 | 50.28 | 99.87 | 0.002 | 25.54 | 3.98 | 0.23 | |||
Table 2Data from rock-splitting tensile tests
Specimen no. | Dimensions (mm) | Loading rate (mm/min) | Maximum load (kN) | Tensile strength (MPa) | ||
Diameter | Height | Measured value | Average value | |||
1 | 50.57 | 25.23 | 0.002 | 4.98 | 2.54 | 2.51 |
2 | 51.22 | 25.31 | 0.002 | 4.76 | 2.43 | |
3 | 50.28 | 24.89 | 0.002 | 5.04 | 2.57 | |
2.2. Test apparatus and scheme
The tests were performed using an SHPB apparatus, the impact, incidence, transmission, and absorption rods of the system were all made of 40Cr alloy steel with an elastic modulus of 210 GPa, a Poisson’s ratio of 0.28, and a longitudinal wave velocity of 5410 m/s. The lengths of the incident and transmission rods were 2000 mm and 1500 mm, respectively, and their diameter was 50 mm. The punch was a spindle type that could generate a half-sine stress wave to realize loading with constant strain rate. The acquisition equipment was an SDY2107A super-dynamic strain gauge and a DL850E oscilloscope.
Note that because of the low tensile strength of the selected sandstone, an ordinary strain gauge could easily fail to detect the transmitted wave. Therefore, to replace the original resistance strain gauge, a semiconductor one was pasted onto the transmission rod in advance to ensure that the transmitted signal could be collected statically. The semiconductor strain gauge had a resistance of 120 Ω and a sensitivity coefficient of 110.
The impact pressure is determined by the bullet impact velocity, and the greater the latter, the greater the rock deformation and failure velocity, and the greater the rock strain rate. From pre-testing, the impact pressures of 0.15 MPa, 0.18 MPa, 0.21 MPa, 0.27 MPa, 0.30 MPa, and 0.36 MPa were determined, and three parallel test blocks were set for each pressure. After each test, the sample fragments were collected and placed in a marked sealed bag.
According to the basic assumptions of SHPB testing and mechanical theory [15], the load , strain , and strain rate borne by the rock along the radial direction from the compression rod can be calculated as follows:
where is the elastic longitudinal wave velocity in the pressure-bar system, is the elastic modulus of the pressure-bar system, is the cross-sectional area of the pressure bar, and is the specimen diameter.
From finite-element calculations and photoelastic experiments, Rodriguez et al. [16] argued that the assumption of elastic behavior for rock specimens in dynamic splitting tensile tests is reasonable; i.e., the dynamic stress distribution of the rock is basically the same as the static stress distribution, and any slight difference is only the stress distribution at the loading end face of the specimen. Therefore, the dynamic tensile stress of rock specimens in SHPB splitting tensile tests can still be calculated using the elastic mechanics method, i.e.:
where is the thickness of the disk specimen.
3. Numerical model of dynamic splitting process of rock samples
3.1. Numerical modeling
The LS-DYNA finite-element analysis software was used to reconstruct the whole process of sandstone sample failure under SHPB impact. For the modeling, the SolidWorks-3D drawing software and the HyperMesh finite-element pre-processing software were used to establish models and partition grids, and then the LS-PrePost software was used to define keywords. Finally, a solver was used to solve the problem.
The finite-element model was established according to the actual size of the SHPB test system: the lengths of the incident and transmission rods were 2000 mm and 1500 mm, respectively, their end diameter was 50 mm, and all the rods were made of 40Cr alloy steel. MAT_ELASTIC constitutive model No. 001 in the LS-DYNA software was used for the material model of the incident and transmission rods, MAT-JOHNSON-HOLMQUIST-CONCRETE constitutive model No. 111 was used for the material model, and the g–cm–us system was used for the model. Because establishing the bullet impact model can introduce errors, the impact load was simulated by loading the incident waveform on the end face of the incident rod. The numerical calculation model is shown in Fig. 1.
Fig. 1SHPB numerical model
Because the material and end-face size of the incident and transmission rods were the same, those rods were set as one PART, the sample was set as one PART, and the *CONTACT_ERODING_SURFACE_TO_SURFACE erosion contact algorithm was used between them. The rock sample was set as the secondary contact surface, and the rod was set as the main contact surface.
3.2. Parameters of Sandstone Holmquist-Johnson-Cook model
The measured sample density was 2.01 g/cm3, and from Tables 1 and 2, the sample compressive strength was 24.8 MPa, the tensile strength was 2.51 MPa, the Poisson’s ratio was 0.22, and the elastic modulus was 2.45 GPa. The shear modulus and bulk modulus were determined from:
where is the specimen elastic modulus, giving 1.664 GPa and 2.42 GPa.
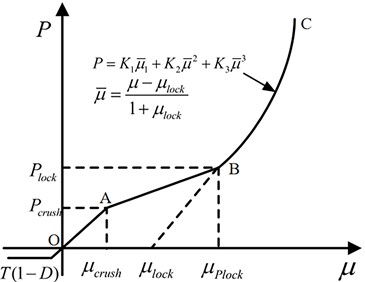
As shown in Fig. 2, the Holmquist-Johnson-Cook (HJC) model was used to describe the relationship between hydrostatic pressure and volumetric strain , which is divided into three stages: elastic, plastic, and compaction [17]. The first stage (OA) is the linear elastic stage (), when the hydrostatic pressure and volumetric strain are related linearly, i.e.:
where , with and being the elastic-limit hydrostatic pressure and corresponding volumetric strain, respectively. The second stage (AB) is the plastic stage (), when the cavities in the material are gradually compressed to produce plastic deformation, and its expression is:
where is the volumetric strain corresponding to the compacting hydrostatic pressure . The third stage (BC) is the compaction stage (), when the material has been completely destroyed, and its expression is:
where is the modified volumetric strain, and , , and are pressure constants.
The limit surface of the HJC model is described as a function of damage, strain rate, and hydrostatic pressure [18], and its failure surface can be expressed as:
where is the normalized equivalent stress ( is the true stress and is the uniaxial compressive strength) and satisfies ( is the normalized maximum equivalent yield strength), is the normalized hydrostatic pressure ( is the true pressure), is the equivalent strain rate ( is the true strain rate and is the reference strain rate), is the damage factor, is the normalized cohesion strength, is the normalized pressure hardening coefficient, is the pressure hardening index, is the strain rate coefficient.
The damage is usually formed by the accumulation of equivalent plastic strain and plastic volumetric strain, and its evolution equation can be expressed as:
where is the damage factor, is the equivalent plastic strain increment, is the plastic volumetric strain increment, and and are the plastic strain and plastic volumetric strain, respectively, when the material is broken under the action of atmospheric pressure .
Fig. 2Curve of equation of state from Holmquist-Johnson-Cook (HJC) model
The basic physical and mechanical tests led to the determination of four basic parameters, i.e., , , , and . According to the theory of plastic yield surfaces, when the damage parameter is 0 and the strain rate effect is not considered, we have:
Because the model parameter is obtained from the cohesion force , i.e., , according to the Mohr-Coulomb strength criterion, can be obtained by:
where is the internal friction angle, and and are the maximum and minimum principal stresses at static compression failure, respectively. Eq. (13) shows that triaxial compression data are needed to determine the cohesion force . In this regard, the method proposed by Pan et al. [19] is referenced herein. Because the Hoek-Brown criterion is better for describing the strength characteristics of rocks under triaxial compression, the empirical data can be obtained by using the Hoek-Brown empirical formula, i.e.:
where is the uniaxial compressive strength, and , , and are rock-related constants that are generally taken as 24, 1, and 0.5, respectively. After setting different values of , static compressive strength data under different confining pressures can be obtained. As shown in Fig. 3, the intensity data were fitted to obtain:
From Eq. (14), we obtain 30.49°, 15.09 MPa, and 0.61. Thus, Eq. (12) becomes , and the normalized equivalent stress and normalized hydrostatic pressure can be expressed as:
Multiple sets of data can be obtained by bringing the above static compressive strength data under different confining pressures into equ shown in Fig. 4, multiple groups of data were fitted using , and 1.92 and 0.80 were obtained. The value of beyond which is deemed to no longer increase is termed , and herein we take 15.
The parameter is a constant related to the strain rate and can be obtained from the previous SHPB and static test data. For uniaxial tests with 0, the rock mechanical parameters at different strain rates can be obtained by combining Eqs. (16) and (17).
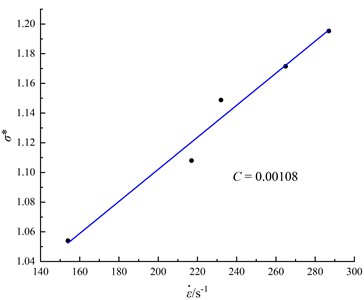
In fact, the change of rock dynamic strength is not only related to strain rate but is also affected by hydrostatic pressure. As shown in Fig. 5, we used the method proposed by Holmquist et al. [20] to eliminate the influence of hydrostatic pressure. Starting from the maximum normalized tensile strength , data points under different strain rates are connected, and then a straight line parallel to the vertical axis is drawn at the constant normalized hydrostatic pressure 1/3. The intersection points of this line and lines with different slopes correspond to the strength of different strain rates under the same normalized hydrostatic pressure 1/3, thus eliminating the influence of hydrostatic pressure. Plotting normalized-strength data points under different strain rates gave 0.00108, and the fitting results are shown in Fig. 6.
Fig. 3Mohr-Coulomb-criterion fitting
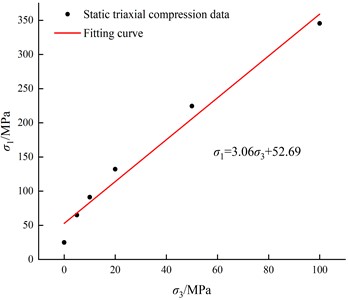
Fig. 4Yield-surface fitting
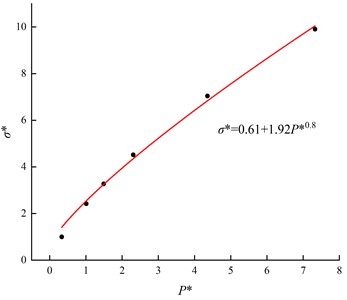
Fig. 5Eliminating hydrostatic pressure effects
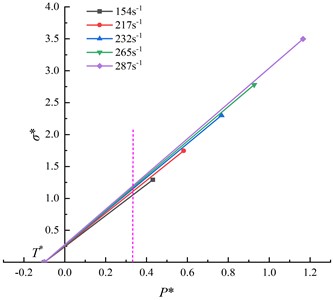
Fig. 6Determining parameter C
Holmquist et al. [20] reasoned that the damage parameter has nothing to do with the strength of the material, so the values herein were calculated according to the original literature, i.e., 1.0 and 0.01. Meanwhile, can be calculated as:
and we obtain 0.0375. The pressure parameters and are the hydrostatic pressure and volumetric strain at the elastic limit, respectively, with values of /3 = 8.267 MPa and = 0.00566. The parameter represents the volumetric strain at the compaction limit state and can be calculated as:
where is the compaction density. The compaction density of the present test samples was 2.15 g/cm3, giving 0.069.
For rock materials, the values of , , and come from the test data of Larson et al. [21] and are fitted via to obtain 43 GPa, –257 GPa, and 596 GPa. For the value of , we refer to the research results of Tian et al. [22]; this is an insensitive parameter, and 1.035 GPa is taken herein. The HJC model parameters for the sandstone samples are given in Table 3.
Table 3HJC model parameters for sandstone samples
(g/cm3) | (MPa) | A | B | C | G (GPa) | |
2.01 | 24.8 | 0.61 | 1.92 | 0.00108 | 15 | 1.664 |
(MPa) | D1 | D2 | (GPa) | (GPa) | ||
2.51 | 0.0375 | 1.0 | 0.008267 | 0.00342 | 1.035 | 0.069 |
(GPa) | (GPa) | (GPa) | N | FS | ||
43 | –257 | 596 | 0.01 | 0.80 | 0 |
3.3. Model verification
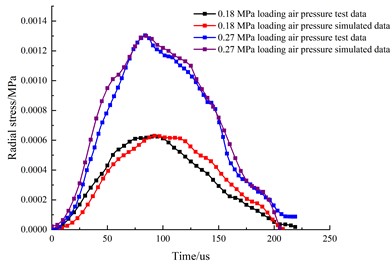
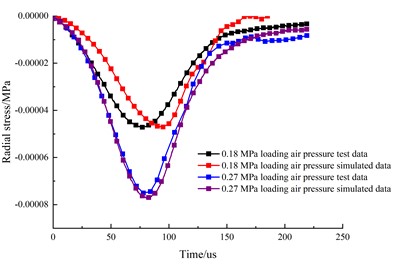
To verify the effectiveness of the numerical model, Fig. 7 compares the reflection and transmission waveforms obtained experimentally and numerically under two different values of the impact pressure, and the corresponding waveforms agree well.
In terms of fracture morphology, the fracture mode of a sandstone specimen in an SHPB test is that it splits into two parts along the load radial fracture, but this differs from that in a static Brazilian disc test, where the split is in the tensile fracture mode, mainly because there is a local crushing area at the end face of the specimen under radial loading, and this crushing area increases with the increasing pressure under the driving load. Comparative analysis of the failure morphology of the numerical simulation samples and the experimental fracture morphology (as shown in Fig. 8) verifies the effectiveness of the numerical model from another angle.
Fig. 7Waveform verification
a) Reflection waveform comparison
b) Transmission waveform comparison
4. Analysis of dynamic SHPB splitting mechanical parameters and energy dissipation of rock under static load
The uniaxial tensile strength of yellow sandstone was 2.51 MPa. To prevent instability of a sample before the impact load, the static load should not be too close to the uniaxial tensile strength, so the static load pressure was set as zero, 0.9 MPa, 1.355 MPa, and 1.88 MPa, i.e., 0 %, 36 %, 54 %, and 75 % of the rock tensile strength, respectively. Four incident wave shapes obtained from the test under a shock pressure of 0.15 MPa, 0.18 MPa, 0.21 MPa, and 0.27 MPa were selected for loading under several static load pressures, and the simulation method was the same as that under no confining pressure. For the static load pressure, the static analysis function of LS-DYNA was used to apply the static load to the section of the bar before the dynamic impact. In particular, the static load was applied using the Dynain file method, which puts the specimen into a prestressed state before the dynamic load is applied.
Fig. 8Verification of sample breakage
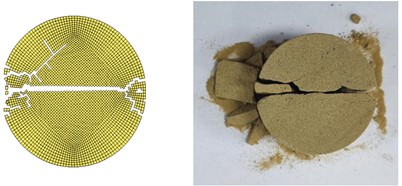
a) Loading air pressure: 0.18 MPa
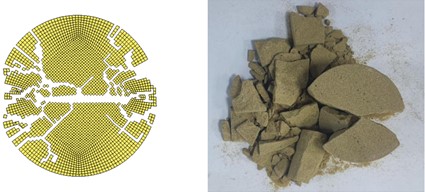
b) Loading air pressure: 0.27 MPa
4.1. Analysis of rock deformation characteristics
To better explore how radial static pressure affects SHPB results, the above numerical analysis method was used to study the dynamic mechanical characteristics of rock samples under different radial static pressure. For the convenience of comparative analysis, numerical simulation data are still used when the radial static pressure is zero. According to previous research [23], one-dimensional stress wave theory is also applicable when elastic rods and specimens are subjected to combined dynamic and static loading. From the numerical simulation results and the calculation formula of one-dimensional stress wave theory, stress-strain curves of rock specimens under different impact pressures and different radial static pressure were obtained, as shown in Fig. 9.
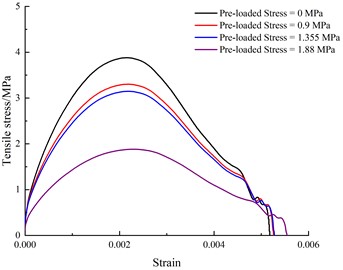
Fig. 9 shows that the stress–strain curves of the samples have different trends depending on the pre-loaded stress. From the perspective of strain analysis, for a given initial impact pressure, the cumulative strain of a sample shows an increasing trend with increasing pre-static pressure. When the impact pressure is 0.15 MPa and no pre-static pressure is loaded, the cumulative strain is 0.005, and when the pre-static pressure is 0.9 MPa, 1.355 MPa, and 1.88 MPa, the cumulative strain is 0.00525, 0.00528, and 0.00554, respectively, which correspond to increases of 5 %, 5.6 %, and 10.8 %, respectively, compared with the loading without pre-static pressure. When the impact pressure is 0.18 MPa, the cumulative strain under these three values of pre-static pressure increases by 0.1 %, 1.93 %, and 4.97 %, respectively, compared with that without pre-static pressure. However, when the impact pressure is 0.21 MPa or 0.27 MPa, the cumulative strain changes little with increasing pre-static pressure, and its influence decreases with increasing impact pressure.
In terms of stress, under a given impact pressure, with increasing pre-static pressure, the stress of a sample continues to decrease, indicating that the existence of pre-static pressure weakens the tensile resistance of the rock itself, and it is more vulnerable to breakage under tensile load. The analytical explanation is that the pre-static load produces stress concentration in the radial direction of the sample, which is conducive to rock breakage. From a microscopic perspective, the pre-static pressure leads to the preliminary penetration of micro-fissures inside a sample, so its resistance to the dynamic tensile load gradually weakens, which is manifested in the increase of the degree of fragmentation and the increase of cumulative strain at the macroscopic level. When the impact pressure is large, the influence of the pre-static load on the deformation characteristics of a rock sample is relatively small, so the cumulative strain does not change significantly with the pre-static load, but the resistance of a sample to tensile load decreases significantly with increasing pre-static load.
Fig. 9Stress-strain relationships of specimens under different pre-load stress
a) 0.15 MPa
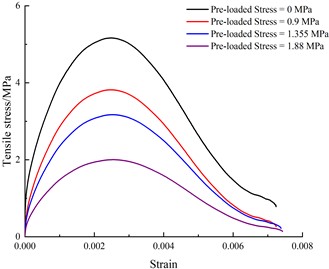
b) 0.18 MPa
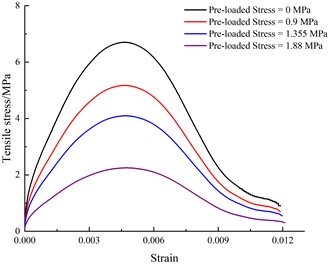
c) 0.21 MPa
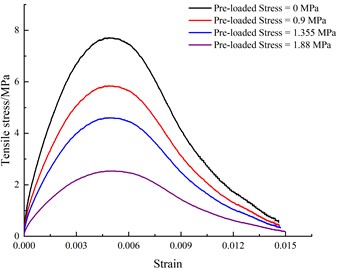
d) 0.27 MPa
4.2. Dynamic mechanical parameter
Fig. 10 shows how sandstone tensile strength varies with strain rate under different pre-static pressures. As can be seen, under a given pre-static pressure, the dynamic tensile strength increases with increasing strain rate, showing an obvious positive correlation, and a better fit is found by using the relationship for the fitting.
Fig. 10Variation of dynamic tensile strength of sandstone with strain rate under different pre-loaded stress
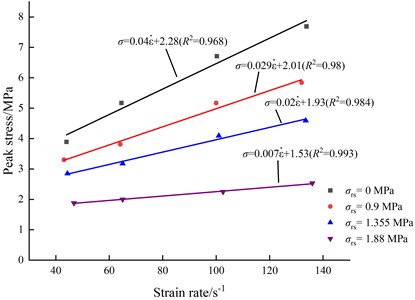
Fig. 10 shows that when the pre-static pressure is zero, the dynamic tensile strength of sandstone increases most obviously with the strain rate; when the pre-static pressure is increased gradually, the growth rate of the dynamic tensile strength with the strain rate decreases gradually, and the growth rate is the lowest when the pre-static pressure is 1.88 MPa.
To reflect the relationship between rock tensile strength and pre-static pressure and strain rate more comprehensively, the values of the fitting coefficients and were obtained under several pre-static pressure levels, and the established functional relationship between two coefficient and pre-static pressure is shown in Fig. 11. From those two relationships, the approximate values of and can be obtained, as given in Table 4. Using those data, the relationship between dynamic tensile strength, pressure ratio, and strain rate can be obtained. To characterize the pre-static pressure more intuitively, the ratio between it and the static tensile strength of rocks is defined as the pressure ratio .
Fig. 11Laws governing how coefficients a and b vary with axial pressure
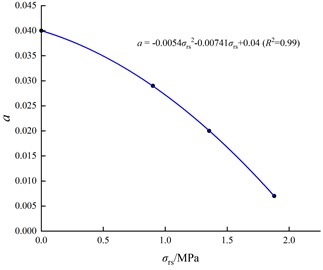
a) Coefficient
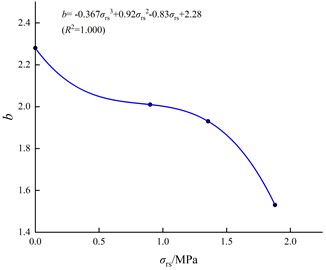
b) Coefficient
Table 4Values of each coefficient under different coaxial pressures
0 | 0.00 | 0.04 | 2.28 |
0.2 | 0.08 | 0.038 | 2.15 |
0.4 | 0.16 | 0.036 | 2.07 |
0.6 | 0.24 | 0.0336 | 2.03 |
0.8 | 0.32 | 0.03 | 2.016 |
1.0 | 0.40 | 0.027 | 2.0 |
1.2 | 0.48 | 0.023 | 1.97 |
1.4 | 0.56 | 0.019 | 1.91 |
1.6 | 0.64 | 0.014 | 1.80 |
1.8 | 0.72 | 0.009 | 1.62 |
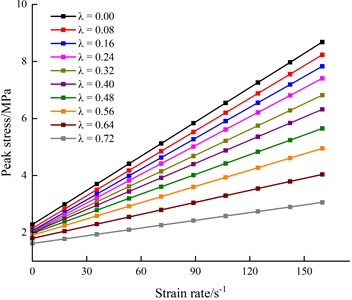
Fig. 12 shows how the rock dynamic tensile strength varies with strain rate under different pre-static pressures. As can be seen, for a given pressure ratio , the dynamic tensile strength increases with increasing strain rate, which is consistent with the law from conventional dynamic splitting tests. Under a given strain rate, the greater the pre-static pressure, the lower the dynamic tensile strength, and the easier is destruction under tensile load, this being because the pre-static pressure causes the initiation and development of micro-cracks in the rock, which reduces its bearing capacity. At the same time, the greater the pre-static pressure, the slower the dynamic tensile strength increases with increasing strain rate, the lower the strain-rate sensitivity of dynamic compressive strength, and the lower the rock’s resistance to tensile deformation.
Therefore, in the process of rock tensile failure, it is necessary to select the appropriate pressure ratio. Too large a pressure ratio will reduce the strain-rate sensitivity of the rock, resulting in low energy utilization rate, while too low an pressure ratio will make the dynamic tensile strength of the rock high, which is not conducive to tensile failure. At the same time, a rock mass in underground engineering is affected by ground stress, which is equivalent to applying a certain prestress inside the rock. Therefore, underground construction schemes should be designed with comprehensive consideration of the ground stress level and the dynamic mechanical properties of the rock under prestress to achieve better engineering results.
Fig. 12Variation of dynamic tensile strength of sandstone with strain rate under different pressure ratios
4.3. Energy dissipation analysis
According to the SHPB test principle, the energy absorbed by the specimen in the dynamic impact test can be calculated by the following formula:
where , and represent incident energy, reflected energy and transmitted energy respectively; Namely, the energy carried by incident, reflected and transmitted stress waves. The incident energy, reflected energy and transmitted energy can be calculated according to the following formula:
where , and are the cross-sectional area, wave velocity and elastic modulus of the elastic bar respectively. , and are incident strain, reflected strain and transmitted strain respectively.
The absorbed energy of the specimen can be divided into three parts, namely, crushing energy dissipation , ejection energy dissipation and other energy dissipation , among which the crushing energy dissipation is used for crack propagation and forming a new fracture surface, and is the kinetic energy carried by the specimen when it is broken and flown out. includes sound energy, heat energy, radiation energy and other energy consumption. Since of crushing energy accounts for more than 95 % of , while and account for a small proportion and it is difficult to measure, can be approximated by , that is:
In order to better analyze the energy dissipation characteristics of sandstone specimens and exclude the influence of size, the crushing energy dissipation density is adopted here to analyze the energy dissipation of specimens, and the crushing energy dissipation density is the ratio of the absorbed energy of specimens to the volume of specimens, namely:
where is the total energy absorbed by the specimen, and is the volume of the sandstone specimen. Similarly, the proportion of crushing energy consumption to incident energy is characterized by the proportion of crushing energy consumption :
The energy of each part under pre-static pressure can be calculated according to the formula. Similarly, for the convenience of comparison and based on the verification of the above model, according to the numerical simulation results, the relationships between impact incident energy and unit volume absorbed energy under different pre-static pressure and no pressure are shown in Fig. 13.
Fig. 13Relationships between absorbed energy and incident energy of rock under different pre-static pressure
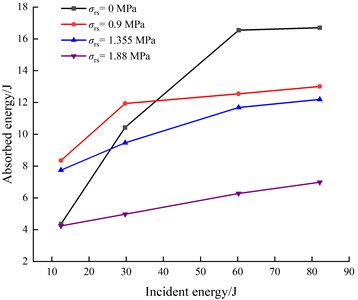
Fig. 13 shows that under several different pre-static pressures, the absorbed energy of each rock sample tends to increase with increasing incident energy. For 0, the slopes of the line segments are 0.35, 0.20, and 0.0069 when the incident energy is in the ranges of 12.5-29.7 J, 29.7-60.3 J, and 60.3-82.1 J, respectively; the slope of the second stage is lower than that of the first stage, and the slope of the third stage is significantly reduced. For 0.9 MPa, the slopes are 0.208, 0.02, and 0.021, respectively; the slopes of the second and third stages are very close and much lower than that of the first stage. For 1.355 MPa, the slopes are 0.0996, 0.073, and 0.023, respectively; the slopes of the three stages decrease gradually with a relatively smooth reduction amplitude. For 1.88 MPa, the slopes are 0.042, 0.042, and 0.033, respectively; the slopes of the three stages are very close, and the three line segments are approximately colinear.
The slope of a line segment in Fig. 13 represents the rate at which the absorbed energy of a sample changes with increasing incident energy. The reason for the above phenomenon is that the degree of sample breakage increases with increasing incident energy, and complete sample breakage requires energy consumption, so the absorbed energy of the sample increases. For 0 (i.e., no static pressure is applied), the slope of the second line segment is slightly lower than that of the first stage because the failure of the specimen is the most severe in the first stage. Based on the samples failing in the first stage, the degree of their continued failure in the second stage slowed down. At the end of this stage, the samples were seriously broken, forming small fragments and powder. Therefore, the slope of the third stage dropped sharply, and it was difficult for the degree of breakage of the samples to continue to increase.
For 0.9 MPa, the largest increase in the degree of sample breakage is still in the first stage, and the slope of this stage is slightly less than that for 0. This is because after the specimen is subjected to a static load of 0.9 MPa, although the whole specimen is not unstable, part of the elastic energy has been stored inside it. When the specimen is subjected to impact load, its internal cracks are activated and expand rapidly, and this part of the elastic energy is released. In addition, because of the influence of pre-static pressure, the dynamic tensile strength of the sample is reduced, and it is more vulnerable to damage. Therefore, the damage degree of the sample in the first stage is much higher than that for 0. This also leads to a sharp decrease in the slope of the line segment in the second and third stages, which is similar to the third stage for 0, and it is difficult for the degree of sample breakage to continue to increase. Also, for 0.9 MPa, the energy absorbed by the sample in the first stage is significantly higher than that for 0. This is because the damage degree of the sample in the first stage is greater than that for 0, so the sample needs to absorb more energy for its own deformation and crushing. The relationship between the degree of deformation and breakage of the sample and the pre-static pressure is also reflected in Fig. 10. When the incident energy is higher than 38 J, the absorption energy of the sample for 0.9 MPa is lower than that for 0. The analytical reason for this is that the degree of deformation and breakage of the sample increases with increasing incident energy, and the difference in that degree at a given incident energy for 0.9 MPa gradually decreases. For 0.9 MPa, part of the elastic energy stored in the sample is released for sample crushing, so the absorbed energy of the sample is lower than that without pre-static pressure when the incident energy is higher than 38 J.
For 1.355 MPa, the slopes of the line segments in the three stages are relatively close and do not change drastically, and the overall value is less than that for 0.9 MPa. This is because more elastic energy is stored in the sample under the action of pre-static pressure, and the microcracks in the sample have partially expanded, so the sample is more fragile, and the elastic energy is still released in the further crushing process of the sample, so the absorbed energy is lower than that for 0.9 MPa. On the other hand, when the incident energy is higher than 26 J, the absorbed energy for 1.355 MPa is lower than that for 0. This indicates that compared with 0.9 MPa, the intersection point of the absorbed energy for 1.355 MPa moves forward. The reason is that increasing pre-static pressure leads to higher stored elastic energy of the sample, and more energy is released in the process of deformation and failure of the sample, which means that the sample absorbs less energy when the damage is greater.
For 1.88 MPa, the slopes of the three line segments are basically the same, being roughly colinear, and the overall absorbed energy of the sample is slightly lower than that for 1.355 MPa. This indicates that with further increase of pre-static pressure, more elastic energy is released during the failure of the sample, and the sample’s absorption energy is lower, and its resistance to deformation is smaller. Under relatively small impact load, the sample is seriously damaged into small fragments and a large amount of powder.
5. Conclusions
Taking yellow sandstone as the research object and with the aim of model verification, this paper explored the mechanical properties and deformation characteristics of rock samples during the dynamic splitting of rock under pre-static pressure. By comparison with the results of conventional dynamic splitting tests, the influences of static load and impact load on the mechanical properties and energy dissipation of rock samples were analyzed in depth, and the main conclusions are as follows.
1) A set of rock Holmquist-Johnson-Cook constitutive parameters was determined by basic experiments, theoretical calculations, and empirical values. Then, the finite-element software ANSYS/LS-DYNA was used to simulate the rock SHPB process numerically. By comparing the numerical and experimental results, the rock constitutive parameters and the model were shown to be valid.
2) With increasing impact load, the degree of rock fragmentation increases, as does the dynamic tensile strength. The relationship between dynamic tensile strength and strain rate can be fitted by a primary function; with the application and continuous increase of pre-static pressure, the dynamic tensile strength of rock gradually decreases and the cumulative strain continuously increases under a given impact pressure, indicating that under the influence of pre-static pressure, micro-cracks in rock develop initially and then expand. With increasing pre-static pressure, rock is more easily broken, and its weakening degree is constantly increased.
3) The energy utilization rate of rock samples during dynamic splitting under pre-static pressure is jointly affected by pressure ratio and impact load. In the process of rock tensile failure, an appropriate pressure ratio should be selected. Too large a pressure ratio will reduce the strain-rate sensitivity of rock, resulting in low energy utilization rate, while too low an axial compression ratio will make the dynamic tensile strength of rock relatively high, which is not conducive to tensile failure. Therefore, the combination of axial compression ratio and impact velocity can improve the crushing effect and energy utilization rate on the premise of clear crushing form requirements.
References
-
J. Gattacceca, A. Lamali, P. Rochette, M. Boustie, and L. Berthe, “The effects of explosive-driven shocks on the natural remanent magnetization and the magnetic properties of rocks,” Physics of the Earth and Planetary Interiors, Vol. 162, No. 1-2, pp. 85–98, Jun. 2007, https://doi.org/10.1016/j.pepi.2007.03.006
-
D. Gan, F. Gao, Y. Zhang, J. Zhang, F. Niu, and Z. Gan, “Effects of the shape and size of irregular particles on specific breakage energy under drop weight impact,” Shock and Vibration, Vol. 2019, pp. 1–14, Jun. 2019, https://doi.org/10.1155/2019/2318571
-
P. G. Ranjith, J. Zhao, M. Ju, R. V. S. de Silva, T. D. Rathnaweera, and A. K. M. S. Bandara, “Opportunities and challenges in deep mining: A brief review,” Engineering, Vol. 3, No. 4, pp. 546–551, Aug. 2017, https://doi.org/10.1016/j.eng.2017.04.024
-
R. J. Christensen, S. R. Swanson, and W. S. Brown, “Split-hopkinson-bar tests on rock under confining pressure,” Experimental Mechanics, Vol. 12, No. 11, pp. 508–513, Nov. 1972, https://doi.org/10.1007/bf02320747
-
W. Lu, M. Chen, X. Geng, D. Shu, and C. Zhou, “A study of excavation sequence and contour blasting method for underground powerhouses of hydropower stations,” Tunnelling and Underground Space Technology, Vol. 29, pp. 31–39, May 2012, https://doi.org/10.1016/j.tust.2011.12.008
-
F. Zhang, G. Yan, J. Peng, Z. Qiu, and X. Dai, “Experimental study on crack formation in sandstone during crater blasting under high geological stress,” Bulletin of Engineering Geology and the Environment, Vol. 79, No. 3, pp. 1323–1332, Nov. 2019, https://doi.org/10.1007/s10064-019-01665-1
-
C. Yi, D. Johansson, and J. Greberg, “Effects of in-situ stresses on the fracturing of rock by blasting,” Computers and Geotechnics, Vol. 104, pp. 321–330, Dec. 2018, https://doi.org/10.1016/j.compgeo.2017.12.004
-
C. He and J. Yang, “Laboratory study of dynamic mechanical characteristic of granite subjected to confining pressure and cyclic blast loading,” Latin American Journal of Solids and Structures, Vol. 15, No. 5, p. e44, Jun. 2018, https://doi.org/10.1590/1679-78254424
-
J. B. Zhu, Z. Y. Liao, and C. A. Tang, “Numerical SHPB tests of rocks under combined static and dynamic loading conditions with application to dynamic behavior of rocks under in situ stresses,” Rock Mechanics and Rock Engineering, Vol. 49, No. 10, pp. 3935–3946, Apr. 2016, https://doi.org/10.1007/s00603-016-0993-1
-
X. Li, Z. Zhou, T.-S. Lok, L. Hong, and T. Yin, “Innovative testing technique of rock subjected to coupled static and dynamic loads,” International Journal of Rock Mechanics and Mining Sciences, Vol. 45, No. 5, pp. 739–748, Jul. 2008, https://doi.org/10.1016/j.ijrmms.2007.08.013
-
P. Bailly, F. Delvare, J. Vial, J. L. Hanus, M. Biessy, and D. Picart, “Dynamic behavior of an aggregate material at simultaneous high pressure and strain rate: SHPB triaxial tests,” International Journal of Impact Engineering, Vol. 38, No. 2-3, pp. 73–84, Feb. 2011, https://doi.org/10.1016/j.ijimpeng.2010.10.005
-
M. Omidvar, M. Iskander, and S. Bless, “Stress-strain behavior of sand at high strain rates,” International Journal of Impact Engineering, Vol. 49, pp. 192–213, Nov. 2012, https://doi.org/10.1016/j.ijimpeng.2012.03.004
-
T.-B. Yin, P. Wang, X.-B. Li, R.-H. Shu, and Z.-Y. Ye, “Effects of thermal treatment on physical and mechanical characteristics of coal rock,” Journal of Central South University, Vol. 23, No. 9, pp. 2336–2345, Sep. 2016, https://doi.org/10.1007/s11771-016-3292-9
-
C. E. Fairhurst and J. A. Hudson, “Draft ISRM suggested method for the complete stress-strain curve for intact rock in uniaxial compression,” in International Journal of Rock Mechanics and Mining Sciences (1997), Vol. 36, No. 3, pp. 279–289, 1999.
-
C. Li, Y. Xu, P. Chen, H. Li, and P. Lou, “Dynamic mechanical properties and fragment fractal characteristics of fractured coal-rock-like combined bodies in split Hopkinson pressure bar tests,” Natural Resources Research, Vol. 29, No. 5, pp. 3179–3195, Mar. 2020, https://doi.org/10.1007/s11053-020-09656-w
-
D. Li, F. Gao, Z. Han, and Q. Zhu, “Experimental evaluation on rock failure mechanism with combined flaws in a connected geometry under coupled static-dynamic loads,” Soil Dynamics and Earthquake Engineering, Vol. 132, p. 106088, May 2020, https://doi.org/10.1016/j.soildyn.2020.106088
-
K. Liu, C. Wu, X. Li, Q. Li, J. Fang, and J. Liu, “A modified HJC model for improved dynamic response of brittle materials under blasting loads,” Computers and Geotechnics, Vol. 123, p. 103584, Jul. 2020, https://doi.org/10.1016/j.compgeo.2020.103584
-
X. Kong, Q. Fang, H. Wu, and Y. Peng, “Numerical predictions of cratering and scabbing in concrete slabs subjected to projectile impact using a modified version of HJC material model,” International Journal of Impact Engineering, Vol. 95, pp. 61–71, Sep. 2016, https://doi.org/10.1016/j.ijimpeng.2016.04.014
-
C. Pan, L.-X. Xie, X. Li, K. Liu, P.-F. Gao, and L.-G. Tian, “Numerical investigation of effect of eccentric decoupled charge structure on blasting-induced rock damage,” Journal of Central South University, Vol. 29, No. 2, pp. 663–679, Mar. 2022, https://doi.org/10.1007/s11771-022-4947-3
-
T. J. Holmquist, G. R. Johnson, and W. A. Cook, “computational constitutive model for concrete subjected to large strains, high strain rate, and high pressures,” in International Symposium on Ballistic, 1993.
-
D. B. Larson and G. D. Anderson, “Plane shock wave studies of Westerly Granite and Nugget sandstone,” International Journal of Rock Mechanics and Mining Sciences and Geomechanics Abstracts, Vol. 17, No. 6, pp. 357–363, Dec. 1980, https://doi.org/10.1016/0148-9062(80)90519-7
-
X. Tian, T. Tao, Q. Lou, and C. Xie, “Modification and application of limestone HJC constitutive model under the impact load,” Lithosphere, Vol. 2021, No. Special 7, p. 64430, Mar. 2022, https://doi.org/10.2113/2022/6443087
-
J. Wang, Y. Liu, and K. Li, “Dynamic characteristics of deep dolomite under one-dimensional static and dynamic loads,” Journal of The Institution of Engineers (India): Series A, Vol. 101, No. 1, pp. 49–56, Dec. 2019, https://doi.org/10.1007/s40030-019-00424-5
About this article

We extend our gratitude to the National Natural Science Foundation, China (No. 52074009, No. 52274071 and No. 52104116), and to the Anhui Provincial Natural Science Foundation, China (2208085QE174), and to the University Graduate Scientific Research Project of Anhui Province in 2021, China (YJS20210384). Their support is gratefully acknowledged.
The datasets generated during and/or analyzed during the current study are available from the corresponding author on reasonable request.
Zhongyi Zhang: experimental data processing, theoretical analysis and manuscript writing. Ying Xu: overall design and guidance. Chengjie Li: test instrument operation and assistance. Jinjin Ge help with manuscript writing.
The authors declare that they have no conflict of interest.
