Abstract
The paper focuses on two kinds of rotating machinery, miniature table drilling machine and automobile engine, as the research object. Traditional machine learning has the need for manual feature extraction, and is very dependent on expert diagnostic experience and expertise, but also has the disadvantages of low accuracy, low timeliness, low efficiency, etc. For the traditional rotating machinery fault diagnosis method is more based on the traditional machine learning model, this paper puts forward a one-dimensional convolutional neural network-based fault identification method. According to the characteristics of the miniature table drilling machine and the automobile engine which are not detachable, the corresponding faults are set up respectively, Vibration signals of the attitude sensor are obtained by using the signal collector, and the collected data are preprocessed, then the CNN model is built for fault identification, and the network structure is constantly optimized to obtain the optimal network model with high accuracy (up to 100 %) and robustness. The results show that the one-dimensional convolutional neural network model improves the fault recognition accuracy and reduces the cost compared with the traditional machine learning SVM model when the original signal is used as the input signal.
Highlights
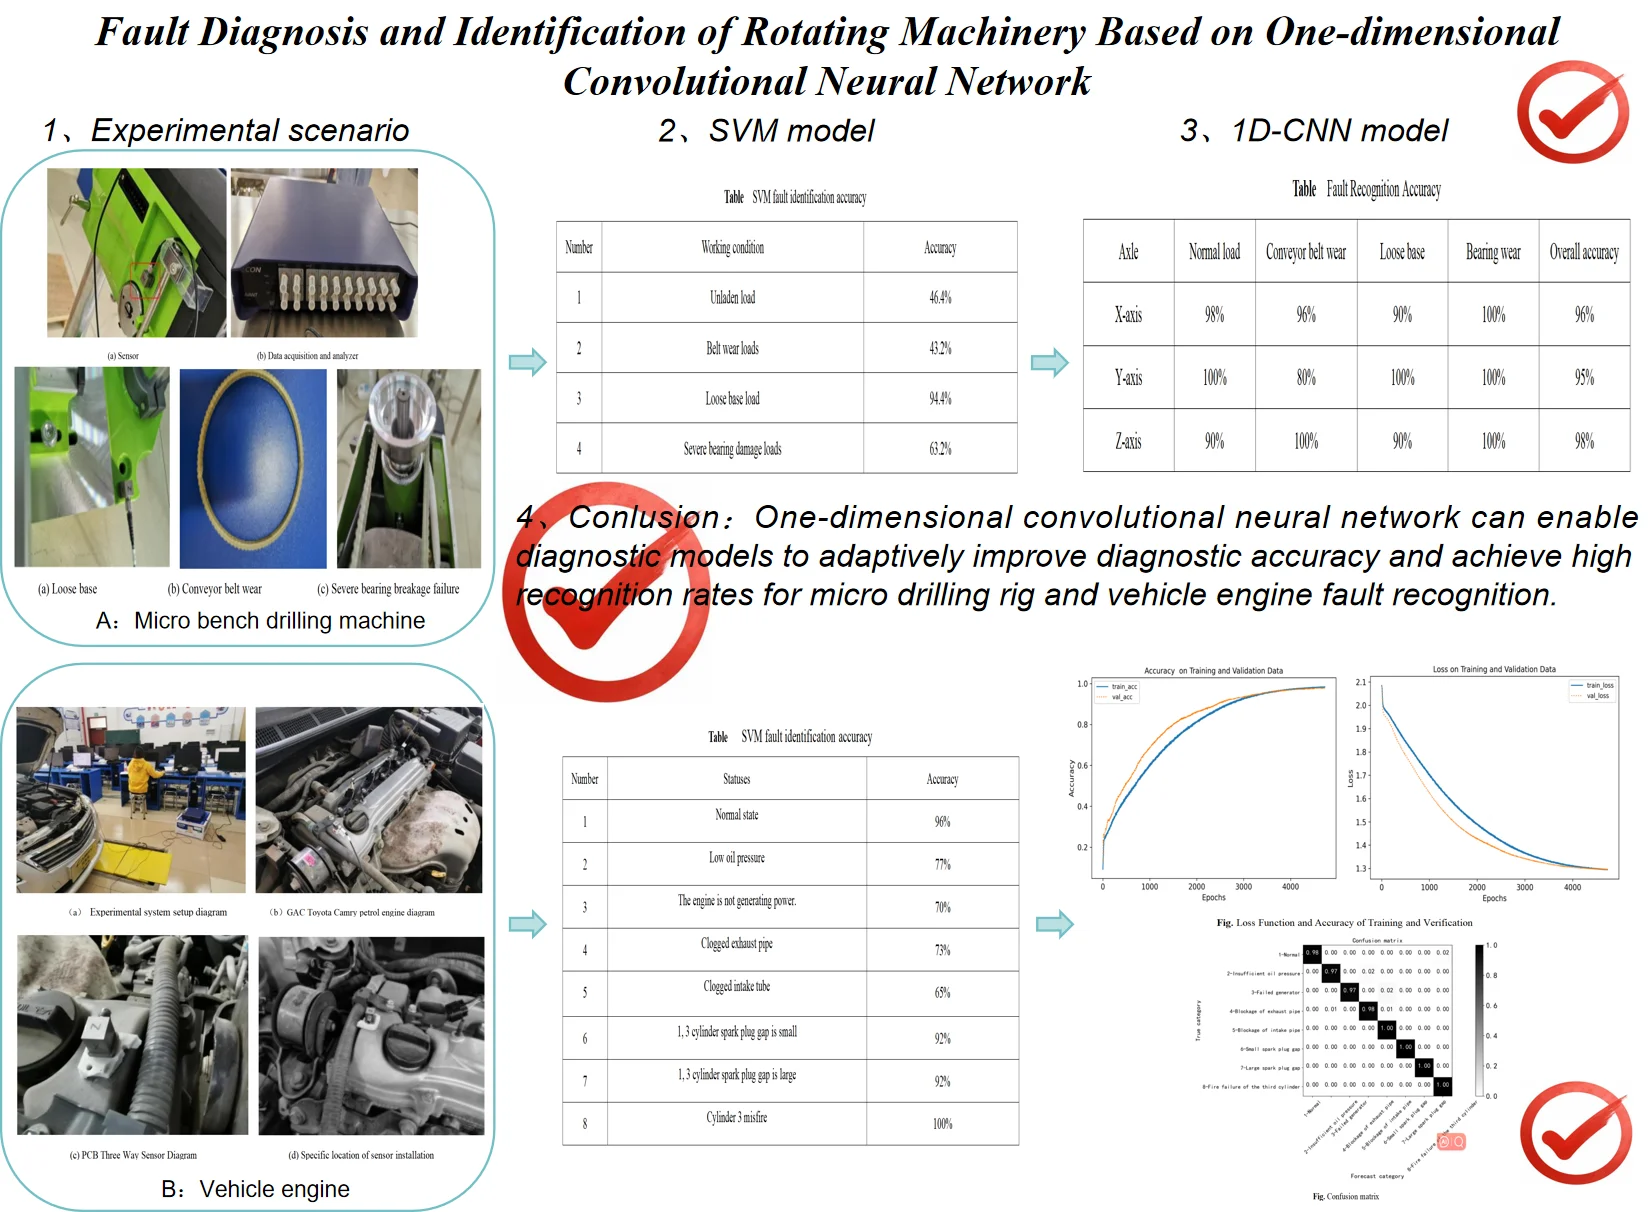
- One-dimensional convolutional neural network can enable diagnostic models to adaptively improve diagnostic accuracy and achieve high recognition rates for micro drilling rig and vehicle engine fault recognition.
- Compared with the traditional machine learning SVM model, it can be concluded that 1D-CNN on the type of faults can be a high degree of accuracy in the identification of the conclusion of the highest accuracy rate can reach 100%.
- For the shortcomings existing in traditional machine learning, proposes a one-dimensional convolutional neural network-based table drilling machine fault recognition, which makes use of the characteristics of CNN to automatically extract the eigenvalues under different faults instead of manually extracting the eigenvalues.
1. Introduction
Rotating machinery refers to equipment that achieves power output in the form of rotary motion. As a representative of mechanical equipment, rotating machinery is more widely used, accounting for 80 percent of the equipment, and occupies an important position in life production activities.
Bench drilling machines are typical rotating machines. Since the working environment of drilling machines is complex and not easy to dismantle, it is important to detect the status of bench drilling machines, accurately determine the type and location of faults, and carry out maintenance on them, so as to achieve the purpose of reducing losses. Yuqian Song of China Academy of Weights and Measures (CAWM) investigated the local mean decomposition (LMD) through repeated validation of measured and simulated signals, and concluded that the LMD algorithm had drawbacks on high-frequency noise. In order to make up for this shortcoming of LMD, a local mean improvement algorithm based on extracting the extreme points of the envelope was proposed, and a fault identification and analysis system was designed through LabVIEW development platform, and the results proved that the improved algorithm had a good accuracy [1]; Jiang Jian from China University of Mining and Technology proposed a fault feature extraction method combining VMD-EES and instantaneous frequency mean curve, and confirmed the accuracy of the used method through simulation and fault analysis, and also solved the problem that the vibration acceleration signals collected by the sensors had more interfering components and complex composition [2]; Song Lin et al. proposed a fault diagnosis method based on one-dimensional convolutional neural network and singular spectrum decomposition in order to reduce the interference of noise signals on vibration signals and improve the accuracy of fault diagnosis, and the training results surface that the accuracy and stability of this method were more excellent than the traditional methods [3]; Wu Chunzhi et al. proposed a CNN-based fault diagnosis model for gearboxes considering the problems of end-to-end fault diagnosis and the inconvenience of manually extracting the eigenvalues for classification, while using composite fault data to conduct comparative experiments between the traditional model and the CNN model, which confirmed the excellent accuracy of the one-dimensional convolutional neural network [4]; Ye Zhuang et al. from Tongji University proposed a multi-channel model based on 1D convolutional neural network in order to solve the instability of using single-channel signals as input signals, which obtained the 1D signal of multi-channel by empirical modal decomposition and performed feature extraction on the signal, and comparative experiments showed that the diagnostic performance of this method was obviously more stable than that of the traditional model [5].
Automobile engine also belongs to the category of rotating machinery. At present, neural network-based automotive fault diagnosis research is not only limited to automotive engines, but has included automotive gearboxes, ABS, transmissions, etc., even in many mechanical fields [4-6]. Direction of neurological fault diagnosis of automobile engine mainly includes based on engine vibration signal, emission exhaust gas, and sensor waveform. Xie Shuying based on the LMS algorithm using linear discriminant function to build engine fault state identification model for rapid judgement of the engine state, in the three-layer BP neural network to build a fault location classification model for fault classification of faulty engines, for automotive engine fault diagnosis providing intelligent technical means for automotive engine fault diagnosis. Measured data verified that the accuracy of the discrimination was high [7]. Lin Sumin et al. proposed an engine fault diagnosis system based on Telematics and improved neural network to identify the correct rate higher than the traditional OBD identification method, which realized the introduction of wavelet threshold denoising method and BP neural network into the automotive engine remote fault diagnosis system based on Telematics and endowed the method with scientificity through the final empirical evidence as a means of improving the efficiency and quality of automotive remote fault diagnosis of the engine [8]. Ren Yi et al. compared the accuracy of fault diagnosis results of PNN neural network with traditional BP neural network. The experimental results showed that the probabilistic neural network based fault identification method can quickly and accurately identify injector faults [9]. The neural network model based on sensor signals can identify the type of faults better, Li Wen et al. through testing and validation of the comparison, it can be seen that the probabilistic neural network (PNN network) is better than the BP neural network in terms of speed and accuracy, and it is more efficient [10]. Literature [11] used convolutional neural network to implement the problem of fault detection and classification of gearboxes. Mao et al [12] proposed a fuzzy sliding mode controller based on neural network and applied it to the anti-lock system, which can effectively control wheel slip.
The current research on fault diagnosis of automotive engines is dominated by the fault diagnosis of engine sensor waveforms and emission systems. Regarding to the fault diagnosis of engine system, since it is difficult to monitor directly through the relevant sensors, it is necessary to carry out the fault diagnosis through intelligent methods such as deep learning [13-15], due to its powerful multi-layer nonlinear feature learning capability.
Traditional frequency domain analysis methods like short-time Fourier transform, wavelet transform, etc., have certain limitations, which require rich professional experience knowledge. Therefore, it is difficult to popularize the use of frequency domain analysis methods, and difficult to be used for the lack of professional experience. The convenience is not strong. Compared to frequency domain analysis methods, more researchers believe that time-domain analysis methods are more effective. For example, Marcin Kluczyk et al. believed that in the time domain, the classification based fault diagnosis is used as a method for vibration analysis [16]. Time-domain analysis method was applied to the signals of the engine vibrations and noise recorded during the engine operation on a laboratory test stand [17-18]. For mechanical learning algorithms, although there are certain advantages, the simplicity of structural layer of most mechanical learning algorithms leads to bad effect of dealing with non-linear data. It also requires rich professional experience. Deep learning algorithms can achieve better results in fault identification compared with traditional mechanical learning algorithms, with good accuracy and stability, and the accuracy and recognition rate have been improved to a certain extent. In this paper, a fault diagnosis method based on vibration signal data and one-dimensional convolutional neural network is investigated for engine faults to diagnose faults related to mechanical system aspects of the engine, which provides more monitoring solutions to ensure the safe operation of the engine and to eliminate safety hazards.
In rest sections, Section 2 introduces the one-dimensional convolutional neural network; Section 3 gives the experiments on fault recognition of miniature table drilling rigs and engines based on the CNN model and simulation validation of each; Section 4 is the discussion and conclusion.
2. One-dimensional convolutional neural network
With the rapid development of computer computing speed and the proposal of deep learning theory, by two millennia after AD, the development of convolutional neural networks has been rapid, and the classical convolutional networks such as AlexNet, ZFNet, ResNet, and so on have appeared one after another, which are widely used in the fields of image recognition, natural language processing, and mechanical signal recognition. Convolutional neural network is one of the very representative algorithms of the current deep learning since decades of development, is a kind of feed-forward neural network, because of the depth and feedback, and most importantly, the use of convolutional computation, there is a local sensory field, and is capable of feature learning.
Convolutional neural network structure mainly has input layer, convolutional layer, pooling layer, fully connected layer, and output layer. Among them, convolutional layer and pooling layer are the most special layers of convolutional neural network. The convolutional neural network model is shown in Fig. 1.
Fig. 1Structure of convolutional neural network
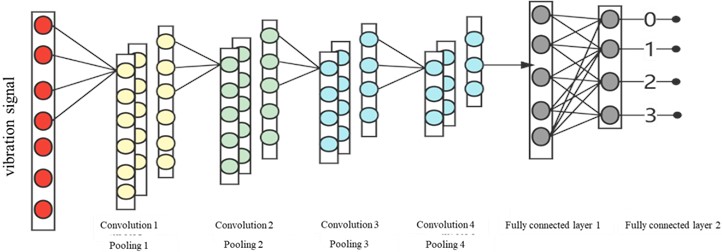
Convolutional layer is a unique network structure in convolutional neural network and is the basic structural unit of convolutional neural network. The Convoluted Layer compresses the redundant information without destroying the features through the convolution kernel, and maps the result of the convolution to the feature map. The specific calculation method of convolutional neural network is as follows:
where , , , represent the output values, input values, convolution kernel parameters and bias in the neuron respectively and represents the convolution operation.
Activation function is one of the keys of convolutional neural network, add nonlinear factors to the model to increase the ability of the model to deal with nonlinear data, three common activation functions are sigmoid function, tanh function, Relu function. Among them, the activation function chosen in this paper are Relu function, the model expression is:
The structure of the ReLu function is relatively simple, that is, when the input value is greater than 0 the output value is equal to the input value, when the input value is less than 0 the output value is equal to 0.
The pooling layer performs further feature sampling on the feature map output from the convolutional layer. The purpose is to continue to compress the feature data in order to reduce the amount of computation and prevent the emergence of overfitting, and further improve the computational speed. The pooling layer is mainly divided into two average pooling and maximum pooling as shown in Fig. 2.
Fig. 2Pooling layer working principle
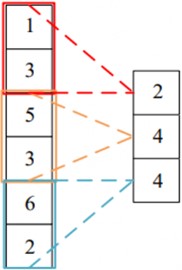
a) Average pooling operation
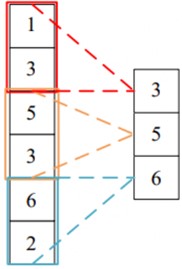
b) Max-pooling operation
Dropout is also added between the two fully connected layers and the average pooling layer. The purpose of Dropout is to improve the robustness of the model while preventing model overfitting. In the fully connected layer, the front and back neurons are fully connected to each other, and the addition of Dropout alleviates the synergistic effect between neurons to some extent.
The fully connected layer is located at the end of the convolutional neural network and integrates the obtained features into global features, which are fed into the fully connected layer for regression and classification operations. Finally, the output signal of the fully connected layer is connected to the Softmax classifier, which can achieve the function of classifying the input signal. The specific calculation is expressed as follows:
where is the eigenvector; is the weight matrix, is the bias matrix, in this paper, the activation function adopts the Softmax function, the specific expression of Softmax function is:
where and are the ith neuron output probability value and output value, respectively, and K corresponds to the fault category 4 in the number of categories in this paper.
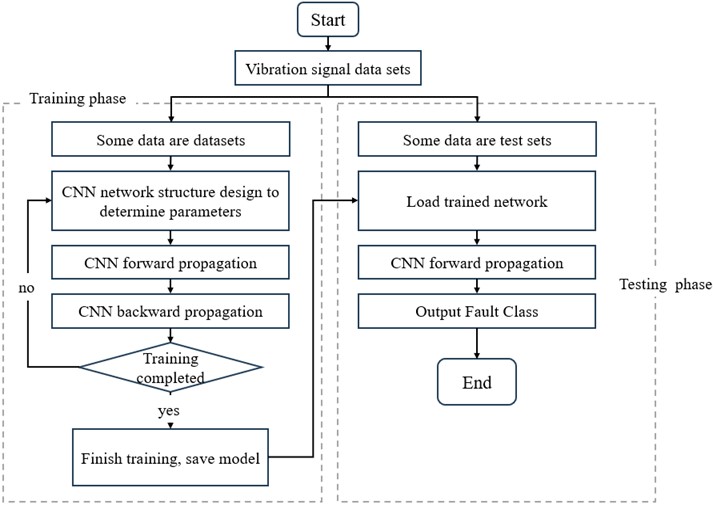
The analysis process of the CNN-based fault recognition method used in this paper is shown in Fig. 3 as follows, Step 1: The collected vibration signals are first pre-processed, and divided into training and test sets as needed; Step 2: The training set is used for the selection of the parameters of the network model as well as the adjustment and optimization, and the optimal network structure is continuously trained; Step 3: The test set is applied to the optimal network structure to output the accuracy of the recognition of each faulty state as well as the normal state.
Fig. 3CNN analysis flowcharts
3. Experimental validation
3.1. Micro bench drilling machine
3.1.1. Experimental programmes
The main equipment for this experiment includes three-axis vibration acceleration sensors and AVANT data acquisition and signal analysis instruments. The principle of the vibration acceleration sensor is to convert the input physical signal, namely the vibration signal, into an electrical signal output. The sensor is shown in the figure; The AVANT data acquisition and analysis instrument (MI-7016) is a comprehensive system for accumulating data acquisition and analysis. It connects to a PC via a high-speed USB port to transmit vibration acceleration signals from sensors and automatically generates test reports, as shown in Fig. 4(a) and (b).
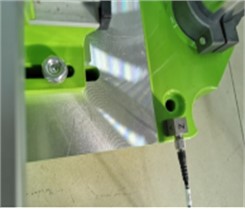
This paper addresses four common working conditions in the working environment of miniature table drilling rigs, with specific fault settings as shown in Fig. 5, namely: normal condition, conveyor belt wear, base loosening, and severe bearing breakage. In this paper, we study the vibration acceleration signals of the miniature table drilling rig in the , and axes direction under an acceleration sensor loaded with low speed. The vibration signal acquisition equipment is a three-axis sensor and an AVANT data acquisition and signal analyser, with a sampling rate of 6400 Hz, collecting a total of 48 groups of experimental data, with a total of 3,440,640 points per group, and with a uniform ratio of the data.
Fig. 4Experimental site diagram
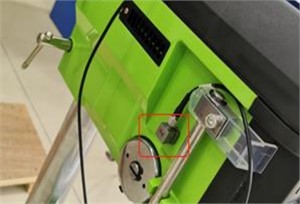
a) Sensor
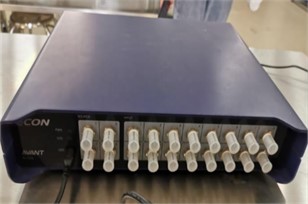
b) Data acquisition and analyzer
Fig. 5Malfunction graph
a) Loose base
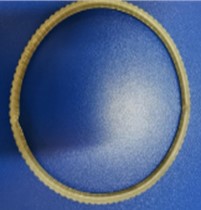
b) Conveyor belt wear
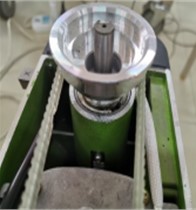
c) Severe bearing breakage failure
3.2. CNN model-based fault identification
3.2.1. Network model parameter
After the model is constructed, the fault signals are fed into the model as input signals, the model is trained with a training set, and the classification effect of the model is evaluated by inputting a validation set. The input of the 1D convolutional neural network model is a one-dimensional data set, and the original vibration signals can be directly input into the model, which improves the recognition efficiency.
The one-dimensional convolutional neural network model designed in this paper contains four convolutional and pooling layers, two fully connected layers, and two Dropout layers; the four convolutional and pooling layers alternate with each other, and the first four pooling layers are all maximal pooling layers, which are immediately followed by the fully connected layer and Softmax to classify the features of the extracted vibration signals.
Firstly, the input layer size is 1000×1, the size of convolution kernel is 8 and the number of convolution kernels is 16 with 1 as the step size to reduce the size of the matrix while extracting the features of the input matrix. Then the maximum pooling layer of size 2 is followed to further reduce the size of the input matrix and the resulting feature matrix is 466×16. The second convolutional layer has a convolutional kernel size of 4, the number of convolutional kernels is 64, and the step size is 1, followed by the maximum pooling layer of size 2, and the resulting feature matrix is 248×64. The third convolutional layer has a convolutional kernel size of 4, a convolutional kernel count of 256, and a step size of 1, again followed by the maximum pooling layer of size 2 and the resulting feature matrix is 248×64. The fourth convolutional layer has a convolutional kernel size of 2, the number of convolutional kernels is 512, the step size is set to 1, and it is followed by a maximum pooling layer of size 2. The resulting feature matrix has a size of 64×512. The compressed features are extracted by alternating the convolutional and pooling layers, and a final the mean pooling layer transforms the features into 512-dimensional vector form, and finally inputs them into the fully connected layer for fault type classification. The specific network structure and parameters of each layer are shown in Table 1.
Table 1One-dimensional convolutional neural network model parameters
Operation | Convolutional kernel size | Step | Activation function | Output size |
Convolution 1 | 8 | 1 | ReLU | 993×16 |
Pooling 1 | 2 | 2 | / | 496×16 |
Convolution 2 | 4 | 1 | ReLU | 496×64 |
Pooling 2 | 2 | 2 | / | 248×64 |
Convolution 3 | 4 | 1 | ReLU | 248,×256 |
Pooling 3 | 2 | 2 | / | 124×256 |
Convolution 4 | 2 | 1 | ReLU | 124×512 |
Pooling 4 | 2 | 2 | / | 62×512 |
Spreading layer | / | / | / | 512 |
Full connectivity layer | / | / | / | 4 |
3.2.2. Results
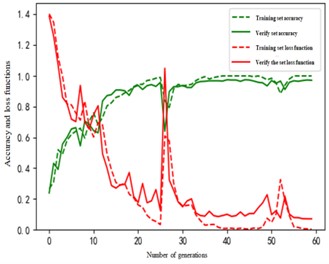
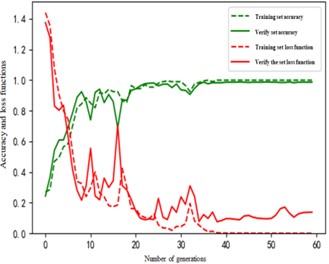
The input signal is a vibration acceleration fault dataset, which includes collected axis vibration signals under four fault states: normal load, conveyor belt wear, severe bearing damage, and unstable base. Due to the lack of missing data in the collected vibration data, there is no need for missing value processing. Instead, numerical data is collected, which eliminates the need for data encoding and other processes. Therefore, here, we only perform data standardization processing. Subsequently, a random equal amount of fault data was randomly extracted for each axis, with a total of 1000 sets of data selected as the experiment, including 600 sets as the training set, 200 sets as the validation set, and 200 sets as the testing set. The loss function variation curves of three sets of training and testing sets on the , , and axes of a one-dimensional convolutional neural network model are shown in Fig. 6.
Fig. 6The accuracy and loss function model: X, Y, Z axis function graph
a)
b)
c)
The loss function values of the three axes training set and test set show a general trend of gradually decreasing towards zero, but different axes have different amplitude oscillations in different periods, and the comparison of the accuracy and loss function curves of the training set and the test set clearly shows that the accuracy and the loss function change in the opposite trend, and the accuracy constantly tends to 1, while the loss function constantly tends to 0, and the images of the two functions have the same period of oscillations and amplitude. The period of oscillation and amplitude of the two function images is the same, it can be inferred that: through one of the curves can be roughly judged by the other tendency to change the trend has been the performance of the effect. Among the three axes, the accuracy of -axis and the loss function are the best among the three axes.
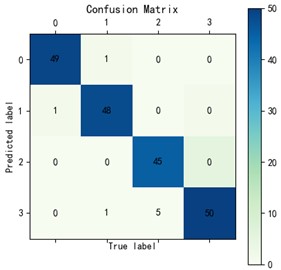
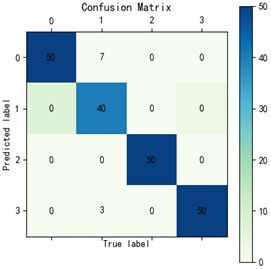
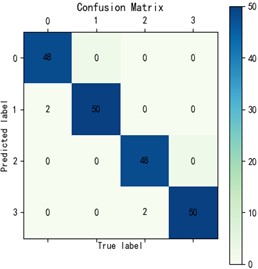
The classification effectiveness of the model is reflected by the confusion matrix, and the dataset used as a test was set up with 200 groups per axis and an average of 50 groups per type of fault. The classification results of the one-dimensional convolutional neural network model on the test set are shown in Fig. 7.
Fig. 7X, Y, Z axis confusion matrix
a)
b)
c)
In the rows and columns of the confusion matrix, 0, 1, 2 and 3 correspond to four types of faults: low speed with normal load, low speed with worn conveyor belt, low speed with loosened base, and low speed with severely damaged bearing. 0-0, 1-1, 2-2 and 3-3 represent the correct classification of the test set, and it can be seen that the classification of the test set in -axis, -axis and -axis is very good, in which the -axis has the best classification effect. In the -axis confusion matrix, 192 of the 200 fault data are successfully classified, and the classification effect is the best for the bearing severe breakage load low speed, in which the base loosening load low speed classification effect is the worst, and 5 samples are incorrectly classified as the bearing severe breakage load low speed; it can be roughly seen that the -axis confusion matrix is the poorer performance, with 190 correctly classified, in which the conveyor belt abrasion load low speed classification effect is the worst, and 10 incorrect samples are classified as the normal load low speed as well as the normal load low speed. The -axis confusion matrix is a poor performer with 190 correctly classified samples, in which conveyor belt wear load low speed is the worst classified, with 10 incorrect samples being classified as normal load low speed and bearing severely broken load low speed, but the other fault types are very well classified and all of them can be correctly classified; the -axis confusion matrix has the best performance, with 196 correctly classified samples, in which two incorrect classifications were made for both normal load low speed and base looseness load low speed, just as in the case of the accuracy and loss function curves.
Table 2Fault recognition accuracy
Axle | Normal load | Conveyor belt wear | Loose base | Bearing wear | Overall accuracy |
-axis | 98 % | 96 % | 90 % | 100 % | 96 % |
-axis | 100 % | 80 % | 100 % | 100 % | 95 % |
-axis | 90 % | 100 % | 90 % | 100 % | 98 % |
As can be seen from Table 2, among the four types of faults, the classification effect for conveyor belt wear load low speed is the worst, and the classification effect for bearing serious breakage load low speed is the best, which shows that the vibration acceleration characteristic of bearing serious breakage load low speed is the most obvious among the four types of faults; the total accuracy of fault classification on the -axis is the highest, and the total accuracy on the -axis is the lowest, but the normal load, base loosening and bearing breakage type results are excellent. Overall, the fault recognition on all three axes meets the expected standard and is able to recognize most fault classes.
The kernel function used in the SVM model is Gaussian, and cross validation is used to divide the validation set and test set. 1000 sets of -axis data are randomly shuffled as input arrays into the SVM model. For the SVM model, using the initial signal as the input signal cannot obtain an accurate machine learning model. According to the accuracy Table 3, directly inputting the original data as the input value into the SVM model has poor fault classification performance, with a total accuracy of only 61.8 %; Only the loose base load category can achieve normal accuracy, while the other three categories cannot accurately classify faults. Compared with Table 2 of the CNN analysis results, the recognition accuracy of each fault state is relatively low. The reason for this is that the SVM model has shortcomings such as the need for manual extraction of signal features, while deep learning and one-dimensional convolutional neural networks have the ability to automatically extract features from the original signal, which can effectively solve the problems of time-consuming and laborious machine learning, as well as relying on professional knowledge and experience. Therefore, the fault identification of micro drilling rigs based on one-dimensional convolutional neural networks proposed in this article has certain practical significance.
Table 3SVM fault identification accuracy
Number | Working condition | Accuracy |
1 | Unladen load | 46.4 % |
2 | Belt wear loads | 43.2 % |
3 | Loose base load | 94.4 % |
4 | Severe bearing damage loads | 63.2 % |
3.3. Vehicle engine
3.3.1. Experimental programmes
The engine of this experiment is a Guangzhou Toyota Camry gasoline engine, the experimental test system mainly includes PCB three-way sensor, PAK test and analysis software and MKII signal collector, the sensor , , -axis sensitivity were used 10.14, 10.04, 10.17. a sample data to be greater than the length of the engine a working cycle of the data, according to the experimental sampling rate for the 20480 Hz, the engine speed 2500 r/min, after the calculation was selected every 1024 data points divided into a sample, and according to the training set: testing set = 0.8: 0.2 ratio data. Experimental system setup diagram, the Guangzhou Toyota Camry petrol engine diagram, PCB three-way sensor, acceleration sensor specific location is shown in Fig. 8.
The specific fault setting and data setting experimental scenarios are shown in Table 4.
Fig. 8Experiment site
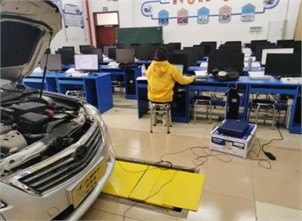
a) Experimental system setup diagram
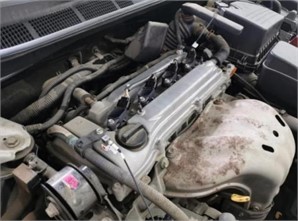
b) GAC Toyota Camry petrol engine diagram
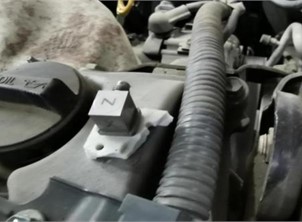
c) PCB three way sensor diagram
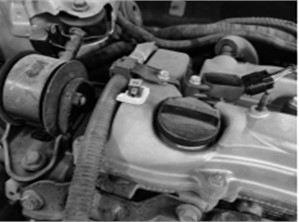
d) Specific location of sensor installation
Table 4Engine failure experiment test programmed form
Number | Statuses | Engine speed | Troubleshooting method | Sampling rate | Sampling time |
1 | Normal state | 2500 rpm | – | 20480 Hz/s | 10 seconds per time |
2 | Low oil pressure | Unplug the oil pump, use a battery to supply power, about 8-10V voltage supply, resulting in a reduction in the speed of the oil pump, oil pressure reduction | |||
3 | The engine is not generating power. | Unplug the engine, the battery is fully charged | |||
4 | Clogged exhaust pipe | Cloths or hard objects blocking the exhaust pipe causing poor exhaust flow | |||
5 | Clogged intake tube | Place a cloth at the air compartment | |||
6 | 1, 3 cylinder spark plug gap is small | Spark Plug Gap: 0.8-0.9 | |||
7 | 1, 3 cylinder spark plug gap is large | Spark plug gap: 1.4-1.5 | |||
8 | Cylinder 3 misfire | Close cylinder 3 |
3.4. CNN model based fault identification
3.4.1. Network architecture model
Due to the lack of missing data in the vibration data of the engine, there is no need for missing value processing, and only numerical data is collected, eliminating the need for data encoding and other processes. Therefore, here, this data analysis only involves standardization of the data. Because the amount of input sample data is relatively large (614400 data * 3 directions * 1 speed * 8 states), from the experience of many previous experiments, when the network level is not enough when the effect is not good, you need multiple layers of convolutional layers and pooling layers to downsample, but the network level is too much will lead to serious overfitting, so the network model at the beginning of the network model selected to use the most consistent with the current data network structure model for the 3-layer convolutional layer, which is a one-dimensional convolutional kernel size is set to 5, the step size is set to 1 and 2 pooling layers, the step size is set to 2, and then adjusted according to the effect of training analysis, at the same time, in order to increase the generality of the network structure also applies a number of anti-overfitting optimization, including batch normalization layer, Dropout, weight matrix initialization optimizations.
Table 5One-dimensional convolutional neural network structure parameter table
SN | Step | Layer (type) | Output Shape | Character |
1 | Input | Input | (None, 256, 3) | |
2 | Convolutional Layer and Pooling Layer | Conv1D | (None, 256, 64) | kernel_size = 5, padding = “same” |
3 | LeakyReLU | (None, 256, 64) | ||
4 | Conv1D | (None, 256, 64) | kernel_size = 5, padding = “same” | |
5 | LeakyReLU | (None, 256, 64) | ||
6 | MaxPooling1D | (None, 128, 64) | pool_size = 3, strides = 2, padding = “same” | |
7 | Conv1D | (None, 128, 128) | kernel_size = 5, padding = “same” | |
8 | LeakyReLU | (None, 128, 128) | ||
9 | MaxPooling1D | (None, 64, 128) | pool_size = 3, strides = 2, padding = “same” | |
10 | Full connected layer | Flatten | (None, 8192) | |
11 | Dense | (None, 128) | ||
12 | LeakyReLU | (None, 128) | ||
13 | Dropout | (None, 128) | ||
14 | Dense | (None, 32) | ||
15 | LeakyReLU | (None, 32) | ||
16 | Dropout | (None, 32) | ||
17 | Dense | (None, 8) | ||
18 | LeakyReLU | (None, 8) | ||
19 | Output | Softmax | (None, 8) | |
Total params: 1,115,752 Trainable params: 1,115,752 Non-trainable params: 0 | ||||
3.4.2. Results
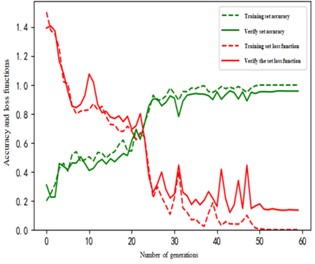
From Fig. 9, it can be seen that after performing about 4000 iterations, the loss values of the testing and validation sets are roughly in the range of 1.2 to 1.3, and the accuracies are in the range of 0.9 to 1.0, which makes the training more effective. According to the confusion matrix in Fig. 10, it can be seen that the recognition degree of each fault is 0.97 and above, and the recognition degree of intake pipe clogging, small spark plug gap, large spark plug gap, and the third cylinder misfire condition is 1.00. Building the SVM model(Among them, kernel = 'rbf', shrinking = False, gamma = 1.5, C = 1.5) to analyze the engine faults, the results it gets are not satisfactory enough, in which the intake pipe clogging condition is the lowest accuracy of 0.65, as shown in Table 6, which shows that based on the one-dimensional Convolutional Neural Network is of great accuracy in identifying engine faults. Compared with the SVM method, the accuracy rate has been greatly improved and is more satisfactory.
Fig. 9Loss function and accuracy of training and verification
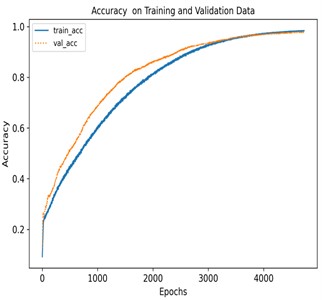
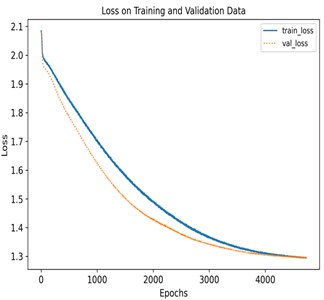
Fig. 10Confusion matrix
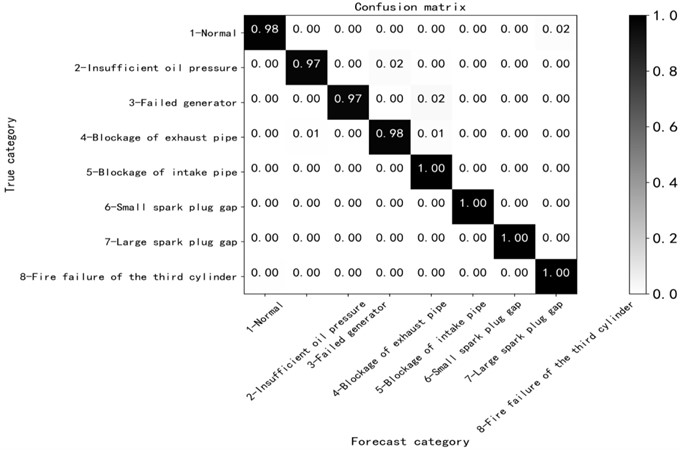
Table 6SVM fault identification accuracy
Number | Statuses | Accuracy |
1 | Normal state | 96 % |
2 | Low oil pressure | 77 % |
3 | The engine is not generating power. | 70 % |
4 | Clogged exhaust pipe | 73 % |
5 | Clogged intake tube | 65 % |
6 | 1, 3 cylinder spark plug gap is small | 92 % |
7 | 1, 3 cylinder spark plug gap is large | 92 % |
8 | Cylinder 3 misfire | 100 % |
4. Conclusions
In the current neural network extensive research and application in various fields of background, this paper based on the previous research results in the neural network diagnosis and identification of mechanical faults as the premise, proposed a one-dimensional convolutional neural network based on rotating machinery fault identification method and research, the main research content and ultimately obtained the relevant results are as follows:
1) This paper takes the miniature table drilling machine as the research object, and for the shortcomings existing in traditional machine learning, proposes a one-dimensional convolutional neural network-based table drilling machine fault recognition, which makes use of the characteristics of CNN to automatically extract the eigenvalues under different faults instead of manually extracting the eigenvalues. According to the characteristics of the experimental object and experimental equipment in this fault recognition test, four types of faults are set, and then the vibration acceleration signals of different fault states are collected through the experimental equipment, and the collected data are preprocessed and organized into a dataset, and finally it is concluded by comparing with the traditional machine learning SVM that the one-dimensional convolutional neural network can enable diagnostic models to adaptively improve diagnostic accuracy and achieve high recognition rates for micro drilling rig fault recognition.
2) At the same time to the car engine as the object of study, after a series of experiments, through the use of engine fault vibration acceleration signal as sample data, after data pre-processing, passed into the construction of a one-dimensional convolutional neural network for feature extraction and learning, compared with the traditional machine learning SVM model, it can be concluded that 1D-CNN on the type of faults can be a high degree of accuracy in the identification of the conclusion of the highest accuracy rate can reach 100 %.
References
-
Song Yuqian, “Research on failure analysis method and diagnosis system of rotating machinery,” China Institute of Metrology, Zhejiang, 2015.
-
J. Jiang, “Research on composite fault diagnosis method of rotating machinery based on deep convolutional neural network,” (in Chinese), China University of Mining and Technology, 2019.
-
Song Lin et al., “A rolling bearing fault diagnosis method based on SSD and 1DCNN,” (in Chinese), Journal of Huazhong University of Science and Technology, Vol. 48, No. 12, pp. 38–43, 2020.
-
Wu Chunzhi et al., “Gearbox fault diagnosis based on one-dimensional convolutional neural network,” (in Chinese), Vibration and Shock, Vol. 37, No. 22, pp. 51–56, 2018, https://doi.org/10.13465/j.cnki.jvs.2018.22.008
-
Ye Zhuang and Yu Jianbo, “Gearbox fault diagnosis method based on multi-channel one-dimensional convolutional neural network feature learning,” (in Chinese), Vibration and Shock, Vol. 39, No. 20, pp. 55–66, 2020, https://doi.org/10.13465/j.cnki.jvs.2020.20.008
-
An Jing, Ai Ping, Xu Sen, Liu Cong, Xia Jiansheng, and Liu Dakun, “An intelligent fault diagnosis method for rotating machinery based on one-dimensional convolutional neural network,” (in Chinese), Journal of Nanjing University, Vol. 55, No. 1, pp. 133–142, 2019, https://doi.org/10.13232/j.cnki.jnju.2019.01.014
-
X. Shuying, “Research on automotive engine fault diagnosis model based on LMS algorithm and BP neural network,” (in Chinese), Microcomputer Applications, Vol. 37, No. 12, pp. 44–47, 2021.
-
Lin Sumin, Liu Fang, and Duan Shaoyong, “Research on remote fault diagnosis of automobile engine based on vehicle networking,” Small Internal Combustion Engine and Vehicle Technology, Vol. 48, No. 1, pp. 57–60, 2019.
-
Ren Yi and Zhang Lei, “TSI engine fault identification method based on probabilistic neural network,” (in Chinese), Journal of Tianjin Vocational and Technical Normal University, Vol. 27, No. 3, pp. 34–38, 2017, https://doi.org/10.19573/j.issn2095-0926.201703008
-
Li Wen, Yu Feifei, Du Canyi, Li Feng, and Gong Yongkang, “Automotive engine fault identification method based on BP neural network and probabilistic neural network and comparative analysis,” (in Chinese), Small Internal Combustion Engine and Vehicle Technology, Vol. 49, No. 5, pp. 78–83, 2020.
-
Z. Chen, C. Li, and R.-V. Sanchez, “Gearbox fault identification and classification with convolutional neural networks,” Shock and Vibration, Vol. 2015, pp. 1–10, Jan. 2015, https://doi.org/10.1155/2015/390134
-
Y.-E. Mao, Y. Zhang, and T. Liu, “The sliding mode controller for automotive ABS based on the fuzzy neural network,” in 2010 Sixth International Conference on Natural Computation (ICNC), Vol. 3, pp. 1410–1413, Aug. 2010, https://doi.org/10.1109/icnc.2010.5582534
-
Qiang Miao, Jing Jiang, and Heng Zhang, “Aerospace smart engines in the context of industrial big data: opportunities and challenges,” (in Chinese), Journal of Instrumentation, Vol. 40, No. 7, pp. 1–12, 2019, https://doi.org/10.19650/j.cnki.cjsi.j1905076
-
Jiang Hongkai, Shao Haidong, and Li Xingqiu, “Intelligent fault diagnosis method for aircraft based on deep learning,” (in Chinese), Journal of Mechanical Engineering, Vol. 55, No. 7, pp. 27–34, 2019.
-
Lei Yaguo, Jia Feng, and Kong Detong, “Opportunities and challenges of intelligent fault diagnosis of machinery under big data,” Journal of Mechanical Engineering, Vol. 54, No. 5, pp. 94–104, 2018.
-
M. Pająk, M. Kluczyk, Muślewski, D. Lisjak, and D. Kolar, “Ship diesel engine fault diagnosis using data science and machine learning,” Electronics, Vol. 12, No. 18, p. 3860, Sep. 2023, https://doi.org/10.3390/electronics12183860
-
M. Pająk, Muślewski, B. Landowski, T. Kałaczyński, M. Kluczyk, and D. Kolar, “Identification of reliability states of a ship engine of the type Sulzer 6AL20/24,” SAE International Journal of Engines, Vol. 15, No. 4, pp. 527–542, Nov. 2021, https://doi.org/10.4271/03-15-04-0028
-
M. Pająk, Muślewski, B. Landowski, and A. Grządziela, “Fuzzy identification of the reliability state of the mine detecting ship propulsion system,” Polish Maritime Research, Vol. 26, No. 1, pp. 55–64, Mar. 2019, https://doi.org/10.2478/pomr-2019-0007
About this article

This research has been supported by the Guangdong Provincial Key Field Special Project (High and Equipment Manufacturing No. 2023ZDZX3009), the National Natural Science Foundation of China under Grant No. 52105087.
The datasets generated during and/or analyzed during the current study are available from the corresponding author on reasonable request.
Feifei Yu’s contributor role are supervision, conceptualization and methodology. Guoyan Chen’s contributor role are methodology, investigation, validation, writing-original draft preparation and writing-review and editing. Canyi Du’s contributor role are project administration, writing-review and editing. Liwu Liu’s contributor role are data curation and software. Xiaoting Xing’s contributor role are investigation, validation, translating and editing. Xiaoqing Yang’s contributor role are supervision and resources.
The authors declare that they have no conflict of interest.
