Abstract
Trenches, as important practical military facilities, have important theoretical and military value in evaluating the damage power of ammunition, operational application, and effective safety protection of personnel on the battlefield through the spatiotemporal evolution of explosive shock waves within them. At present, there is a lack of in-depth research on the distribution and impact of overpressure inside the trench. The paper constructed a typical finite element simulation model of a trench, numerically calculated the shock wave overpressure inside the trench and on the wall, analyzed the spatiotemporal distribution of shock wave pressure in various parts of the trench, conducted on-site explosion tests, and installed shock wave pressure sensor measurement points in the trench. The pressure time history curve was obtained, and verified and compared with the simulation calculation results. Research data shows that the peak overpressure of the shock wave in the trench increases sequentially from the front wall to the back wall. The peak overpressure of the shock wave at the front wall attenuates by 10 % to 20 % compared to the inside of the trench, and increases by 40 % to 60 % at the back wall; The peak overpressure in the trench exhibits a “V-shaped” distribution at different depths, decreasing first and then increasing as the depth increases. The maximum overpressure peak increases by 40 % to 50 % compared to the minimum; Based on simulation and measured data in the trench, as well as the distribution law of shock wave pressure, safety protection suggestions for on-site combat personnel in the trench are provided.
Highlights
- A typical finite element simulation model of a trench was established to numerically calculate the distribution of shock wave overpressure inside and on the wall of the trench.
- Clarified the pressure distribution patterns at different positions within the trench and the impact of the trench on pressure propagation patterns.
- The research results provide theoretical guidance for the design of protective engineering and have significant engineering application value.
1. Introduction
In recent years, the requirements for practical training in the military have become increasingly high. The military and weapon equipment research units are no longer satisfied with obtaining damage data and evaluating power under ideal explosion site conditions, but are more concerned with the spatiotemporal distribution of power in near actual combat scenarios. Trenches are typical practical military facilities. When ammunition explodes near the trench, we are interested in the spatiotemporal evolution of shock waves inside the trench, as this has important theoretical and military value for evaluating the damage power of ammunition in actual combat, operational applications, and protecting personnel on the battlefield.
In recent years, multiple units and researchers both domestically and internationally have paid attention to the distribution pattern of explosive damage power under special site conditions such as trenches and obstacles. Xu Q. P. et al. [1] obtained shock wave overpressure and impulse data under different terrain conditions through simulation, focusing on the impact of changes in trench width and depth on the first peak pressure and impulse at the bottom of the trench. Li S. M. et al. [2] studied the shock wave power and attenuation law generated by different types of explosives in tunnels. Chai Y. S. [4], Li S. Q. et al. [5] studied the propagation law of explosion shock waves generated by explosions in a semi enclosed space at the entrance of a subway. Sun Y. F. et al. [6] conducted research on the damage and protection of human bodies caused by explosive shock waves, and the research showed that the magnitude and duration of overpressure have a close impact on human mortality. The above research summarizes the propagation laws of shock waves in underground and semi underground structures such as trenches and tunnels, and also proposes the impact of explosion shock wave overpressure on the human body. Schleyer et al. [7] and Langdon et al. [8] studied the distribution of shock wave pressure peaks on stainless steel panels through experiments and numerical simulations, respectively. Li X. et al. [9] and Liang L. P. et al. [10] analyzed the distribution pattern of reflected overpressure along the retaining wall at different specific distances, and found that when the specific distance is close, the peak overpressure appears at the bottom of the retaining wall; As the specific distance increases, the peak overpressure tends to be uniformly distributed in the height direction. Zhang Q. L. et al. [11] found through experiments that the peak overpressure on the front of the explosion-proof wall first increases and then decreases with increasing height. Shi Y. C. et al. [12], Hong W. et al. [13], Liu X. F. et al. [14] proposed a formula for the reflection overpressure on the front and rear walls of obstacles based on their respective research. At present, there is no in-depth research and analysis on the distribution and impact of overpressure on the inner bottom and side walls of trenches in relevant literature.
This article simulates and tests the shock wave overpressure inside and on the walls of trenches based on their practical application scenarios. Based on simulation and experimental results, the peak overpressure inside and on the walls of transverse and longitudinal trenches was analyzed, and the distribution of shock wave pressure inside and on the walls of the trenches was studied. Based on the theory and data, this paper puts forward some suggestions on the safety protection of personnel in the trenches, which are also of reference value for the safety protection of personnel and equipment in the field Fortification.
2. Theory of shock wave distribution inside and outside the trench
After encountering objects with boundaries during the movement of shock waves in the air, a portion of the shock waves will propagate around obstacles and generate a circulation effect [15]. As shown in Fig. 1, when the shock wave encounters the boundary of the trench, the shock wave near the ground will expand due to a sudden increase in propagation space, accompanied by a decrease in pressure and temperature. There is a pressure difference between the two, causing the shock wave to move downwards and diffract, thereby affecting the interior of the trench. Due to the diffraction of the shock wave, the overpressure inside the trench will increase with the arrival of the diffraction wave. In addition, the reflection of diffracted waves on the wall and bottom of the trench can also make the distribution of shock waves inside the trench more complex.
Fig. 1Distribution of shock wave diffraction from outside to inside
3. Simulation analysis of shock wave pressure distribution in 2 trenches
3.1. Material parameters and simulation model
Establish a simulation model through AUTODYN. The air in the model is Ideal gas, and the Equation of state is:
where density 1.228 kg/m3; heat capacity ratio 1.4; Initial internal energy density 2.068×10⁵ kJ/kg.
The ground is made of sandy soil material with a density of 1.671 g/cm3.
TNT is used as explosive, and the Equation of state is JWL Equation of state:
where: , , , , all are material constants; η is the relative density; is the initial internal energy density. The main parameter values of explosives are shown in Table 1.
Table 1TNT material parameters
3.74×10⁵ MPa | 3.74×10³ MPa | 4.15 | 0.9 | 0.35 |
1.63g/cm3 | 6930 m/s | 6.0×10⁶ kJ/m3 | 2.1×10⁴ MPa |
The side view of the simulation model in this article is shown in Fig. 2. The lower half of the model is sandy soil, which simulates the actual scene by digging a trench in the sand, while the rest is filled with air. The size of the sand part is 3.68 m×3.04 m×1.024 m, with a visible air domain size of 3.68 m×3.04 m×1.568 m. The dimensions of the trenches are all 3 m×0.6 m×1 m, the projection distance from the explosion center is 3 m, and the height of TNT explosive is 1.5 m, equivalent to 1 kg. During the simulation process, Euler elements were used to model air, sand, and explosives, with a grid width of 16 mm. At the same time, 12 measuring points were arranged in the trench, including 4 measuring points on the front wall, 4 measuring points on the back wall, and 4 measuring points inside the trench, located at depths of 0, 0.2, 0.5, and 1 meter respectively.
Fig. 2Side view of numerical simulation model
3.2. Analysis of simulation results
Through simulation, overpressure data from 12 measuring points on the front and rear walls of the trench and inside were obtained, and the pressure distribution differences between different parts were analyzed. In the simulation, the peak overpressure data of each measurement point in the trench were obtained, as shown in Table 2. Based on the data in Table 2, a curve of the peak overpressure of the shock wave in the trench as a function of the distance between the explosion centers was plotted as shown in Fig. 3. At the same time, a curve of the peak overpressure of the shock wave in the trench as a function of depth was also plotted as shown in Fig. 4.
According to the results in Fig. 3, there is a negative correlation between the peak overpressure of the shock wave at the surface and the distance between the explosion centers. As the distance between the explosion centers increases, the peak overpressure gradually decreases. The peak overpressure at different depths within the trench is positively correlated with the distance between the explosion centers, meaning that within the trench, the peak overpressure at the same depth will increase from front to back. The peak overpressure at the front wall is the smallest, while the peak overpressure at the rear wall is the largest. Compared to the overpressure inside the trench, the overpressure at the front wall attenuates by 10 % to 20 %, while the overpressure at the rear wall increases by 40 % to 60 %. This is mainly because the shock waves inside the trench will gather near the rear wall after moving from front to back, leading to an increase in pressure there. In addition, the upper part of the rear wall of the trench will also be directly shot by the explosion shock wave, which is also one of the reasons for the high overpressure in this area.
Table 2Peak overpressure at each measuring point in the trench
Depth / m | 0 | 0.2 | 0.5 | 1 | surface |
Overpressure on the front wall of the trench / MPa | 0.1523 | 0.1400 | 0.1343 | 0.1618 | 0.2979 |
Overpressure inside the trench / MPa | 0.2029 | 0.1641 | 0.1398 | 0.2390 | 0.2738 |
Overpressure on the rear wall of the trench / MPa | 0.2832 | 0.2738 | 0.2084 | 0.2862 | 0.2522 |
According to the curve of the peak overpressure with depth shown in Fig. 4, we can observe a trend of decreasing and then increasing the peak overpressure on the front and rear walls of the trench and inside the trench as the depth increases. Overall, the peak overpressure in the trench exhibits a “V-shaped” distribution at different depths, with the lowest peak overpressure at a depth of 0.5 m and the highest peak overpressure at the bottom of the trench (at a depth of 1 m). As the depth of the trench increases, the diffraction wave and its reflected wave have an impact on the overpressure of the shock wave inside the trench. Diffraction waves have a certain degree of attenuation compared to incident waves, but after reflection, the peak overpressure significantly increases, even exceeding the overpressure of the incident wave. Therefore, the difference in overpressure peak values at various depths within the trench is mainly caused by diffraction and reflection waves. The difference in overpressure peak values varies at different depths at different locations. The difference in overpressure peak values at each depth on the front wall is relatively small, while the difference in overpressure peak values at the middle and rear walls of the trench is relatively large.
Fig. 3The variation of the peak overpressure in the trench with the distance between the explosion centers
Fig. 4The variation of peak overpressure in trenches with depth
As shown in Fig. 5, the variation rate of the peak overpressure of the shock wave on the front and rear walls and inside the trench at various depths relative to the surface can be observed. Based on the results of Figs. 3 and 5, it can be concluded that the peak overpressure at the front wall of the trench is smaller than that at the surface, and the rate of change relative to the surface is the smallest at the front wall. The overpressure at the front wall experienced significant attenuation, with attenuation amplitude ranging from 45 % to 55 %. The peak overpressure inside the trench is also smaller than the peak overpressure at the surface, but its attenuation effect is affected by depth. The attenuation amplitude of the overpressure peak varies between 12 % and 49 % at different depths. At the rear wall, the peak overpressure has the highest rate of change relative to the surface. Except for the position where the depth of the wall behind the trench is 0.5 m, the peak overpressure has a 17 % attenuation compared to the surface, while the peak overpressure at other depths is higher than the surface, with an increase of over 8 %. In summary, through the analysis of Figs. 3 and 5, it can be seen that there are differences in the peak overpressure and its rate of change at different positions. There is a significant attenuation effect at the front wall, and the attenuation amplitude inside the trench varies with depth. The peak overpressure at the back wall has the highest rate of change relative to the surface.
Fig. 5The relative changes of overpressure peak values at various points in the trench to the surface
Fig. 6Cloud map of peak overpressure distribution in the trench
Based on the above simulation data and analysis, a cloud map of the distribution of overpressure peak at the symmetrical axis of the trench was drawn, as shown in Fig. 6. According to the figure, it can be clearly observed that the low-pressure area in the trench is concentrated near the front wall of the trench, while there are two high-pressure areas in the trench, one near the top of the rear wall, and the other near the bottom of the rear wall and the bottom of the trench. Based on the above analysis, it can be concluded that in the face of a bomb attack, combined with the changes in shock wave overpressure in the horizontal direction, when a person is lying on the front wall of the trench facing the center of the explosion, the shock wave damage to the body is relatively small, and the best protection can be obtained. In addition, according to the vertical variation of shock wave overpressure, it is also possible to squat in a trench and place important parts of the body in a position with low overpressure to achieve protective purposes.
4. Experimental study on the distribution of shock wave pressure in three trenches
4.1. Layout of test site
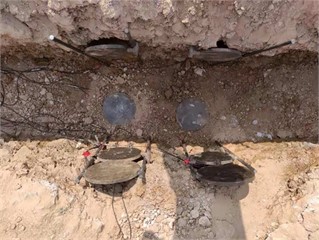
This study uses experimental methods to study the pressure distribution of shock waves in trenches. The overall layout of the test site is shown in Fig. 7. A 3 m long, 0.6 m wide, and 1m deep trench was excavated on an open and flat site. The distance between the trench and the ground projection of the explosion center is 3 m. In order to monitor the pressure changes at different positions, two pressure sensors are installed at a distance of 0.5 m from the bottom of the trench on both sides of the symmetrical axis of the front wall of the trench, two pressure sensors are installed at a distance of 0.5 m and 0.8 m respectively on both sides of the symmetrical axis of the rear wall, and two pressure sensors are installed on both sides of the symmetrical axis of the trench bottom.
Through these deployed pressure sensors, we can monitor and record the shock wave pressure data at different locations in real-time, thereby obtaining the pressure distribution inside the trench.
Fig. 7Site layout diagram
Fig. 8Site layout of measurement points in trenches
4.2. Test results and analysis
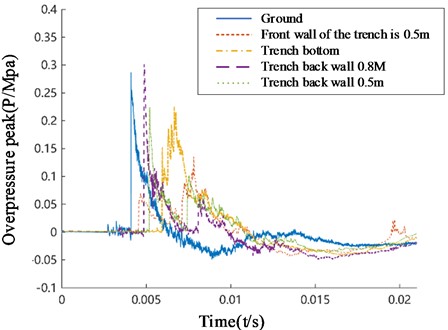
The pressure time history curves of various measuring points on the bottom surface of the trench and the front and rear walls of the trench obtained from the experiment are shown in Fig. 9. From the figure, it can be seen that the pressure changes in the trench are relatively complex. Affected by multiple reflections of the shock wave, the shock wave curve of the pressure measurement points in the trench exhibits a “multi peak” characteristic.
The peak overpressure values of each measuring point in the test are shown in Table 3. Comparing the peak overpressure values on the front and rear walls and inside the trench, it was found that the peak overpressure value on the front wall of the trench was smaller than that on the back wall, and the peak overpressure value at a depth of 0.5 m on the same wall was significantly smaller than that at a depth of 0.2 m. Compared to the bottom of the trench, the peak overpressure on the front wall is smaller than that on the bottom, while the peak overpressure on the rear wall is greater than that on the bottom. The peak overpressure at the front wall of the trench and the inner bottom of the trench is smaller than that at the surface. These laws are consistent with the simulation results.
Fig. 9Measured pressure time history curve
The peak overpressure data of each measurement point in the trench obtained through experiments are shown in Table 3. By comparing the peak overpressure values on the front and rear walls and inside the trench, it can be found that the peak overpressure on the front wall of the trench is smaller than that on the back wall. On the same wall surface, the peak overpressure at a depth of 0.5 m is significantly smaller than that at a depth of 0.2 m; Compared with the bottom of the trench, the peak overpressure on the front wall is smaller than that on the bottom, while the peak overpressure on the back wall is greater than that on the bottom; The peak overpressure at the front wall of the trench and the inner bottom of the trench should be smaller than the peak overpressure at the surface. These laws are consistent with the analysis of simulation results.
Table 3Peak overpressure at each measuring point in the trench
Position | Surface | Trench bottom surface | Front wall of trench | Rear wall of trench | |
Depth / m | 0 | 1.0 | 0.5 | 0.2 | 0.5 |
Overpressure / MPa | 0.2542 | 0.2125 | 0.1447 | 0.3062 | 0.2235 |
Fig. 10Cloud map of measured peak overpressure distribution in the trench
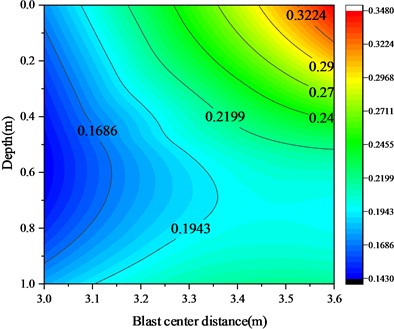
The cloud map of the measured overpressure peak distribution at the symmetrical axis of the trench was obtained through experiments, as shown in Fig. 10. Although the number of measurement points during the experiment was relatively small, making it impossible to fully reproduce the true pressure distribution, overall, the measured overpressure peak distribution at the symmetrical axis of the trench is consistent with the simulation results. Based on the measured results, the following characteristics can be observed: the low-pressure area near the front wall of the trench is the low-pressure area inside the trench, while the high-pressure area is near the rear wall of the trench. Especially the pressure increases most significantly at the top of the rear wall, the bottom of the rear wall, and the bottom of the trench.
Therefore, based on the experimental results and the distribution of shock wave overpressure peak in the trench, it can be concluded that workers in the trench also need to take effective protective measures in the low-pressure area near the front wall. This means that they need to be aware that the low-pressure area near the front wall of the trench may be affected by smaller shock waves, but corresponding protective measures still need to be taken to ensure its safety.
5. Conclusions
Based on the simulation and experimental results of the peak overpressure of the shock wave in the trench, the following conclusions can be drawn:
1) The peak overpressure at the same depth in the trench is positively correlated with the distance between the explosion center. The peak overpressure at the front wall is the smallest, while the peak overpressure at the back wall is the largest. Compared to the overpressure inside the trench, there is a 10 % to 20 % attenuation at the front wall, and an increase of 40 % to 60 % at the back wall.
2) The peak overpressure in the trench exhibits a “V-shaped” distribution at different depths, decreasing first and then increasing as the depth increases. The minimum overpressure peak is located at a depth of 0.5 m, and the maximum is located at a depth of 1 m.
3) Compared to the peak overpressure at the surface, the attenuation amplitude at the front wall of the trench ranges from 4 5% to 55 %, and the interior of the trench varies from 12 % to 49 % depending on the depth; At the rear wall of the trench, except for the depth of 0.5 m, the attenuation is 17 %, and at other depths, it is higher than the surface and the increase exceeds 8 %.
4) The area near the front wall of the trench is a low-pressure area within the trench, while the area near the top of the rear wall, the bottom of the rear wall, and the bottom of the trench are high-pressure areas. When using trenches for protection, important parts of the body should be located in areas with low overpressure peaks. Personnel can lie on the front wall of the trench or squat in a low-pressure area near the front wall to achieve protection purposes.
5) In this paper, a simulation test is carried out when the trench size is 3 m×0.6 m×1 m and the depth is 1m. In the next work, the overpressure distribution of trenches at different depths in the explosion will be further simulated to obtain more comprehensive results.
References
-
Q. P. Xu, Z. R. Li, G. Ding, J. J. Su, Y. Liu, and F. L. Huang, “Numerical simulation of the influence of trench terrain on the propagation law of shock waves,” Engineering Blasting, Vol. 26, No. 6, pp. 23–27, 2020.
-
S. M. Li, X. J. Li, and H. X. Li, “Numerical simulation study of shock waves caused by explosion in tunnels with temperature and pressure explosives,” Journal of Applied Mechanics, Vol. 29, No. 5, pp. 595–600, 2012.
-
K. Z. Yang and S. Liu, “Research progress on the propagation and attenuation of air shock waves,” Protective Engineering, Vol. 42, No. 3, pp. 1–10, 2020.
-
Y. S. Chai, Y. G. Wang, and Y. Zhang, “Research on the propagation law and overpressure load of explosion shock waves at the entrance of subway,” Protective Engineering, Vol. 41, No. 1, pp. 42–46, 2019.
-
S. Q. Li, X. Li, and G. Y. Wu, “Numerical simulation of explosion shock wave propagation in subway stations,” Vibration and Shock, Vol. 32, No. 7, pp. 175–178, 2013.
-
Y. F. Sun and X. Wang, “Analysis of human injury and protection from explosion shock waves,” Journal of Explosives, Vol. 31, No. 4, pp. 50–53, 2008.
-
G. K. Schleyer et al., “Experimental investment of blast wall panel under shock pressure loading,” International Journal of Impact Engineering, Vol. 34, No. 6, pp. 1095–1118, 2007, https://doi.org/10.1260/2041-4196.2.1.1
-
G. S. Langdon and G. K. Schleyer, “Deformation and failure of profiled stainless steel blast wall panels. Part III: finite element simulations and overall summary,” International Journal of Impact Engineering, Vol. 32, No. 6, pp. 988–1012, Jun. 2006, https://doi.org/10.1016/j.ijimpeng.2004.08.002
-
X. Li, G. Y. Wu, and H. K. Jia, “Numerical simulation of the influence of retaining wall on the propagation of explosion shock wave,” Applied Mechanics, Vol. 29, No. 2, pp. 245–250, 2012.
-
L. P. Liang and X. Li, “Three dimensional numerical simulation of the influence of retaining walls on the propagation of explosive shock waves,” Journal of Fuqing Branch of Fujian Normal University, No. 5, pp. 26–29, 2011.
-
Q. L. Zhang, Y. Zhang, and X. Z. Nian, “The influence of concrete blast walls on the propagation of explosion shock waves,” Vibration and Shock, Vol. 32, No. 24, pp. 192–197, 2013.
-
Y. C. Shi, H. Hao, and Z. X. Li, “Modeling of multi-channel ground shock and air blast pressure on nearby structures from surface explorations,” Shock Waves, Vol. 17, pp. 113–133, 2007.
-
H. Wu et al., “Research on the Calculation Method of Load on the Facing Surface of Rigid Explosion Proof Walls,” Applied Mechanics, Vol. 29, No. 11, pp. 228–235, 2012.
-
X. F. Liu et al., “The distribution pattern of overpressure reflected by shock waves along rigid walls,” Engineering Blasting, Vol. 21, No. 5, pp. 28–31, 2015.
-
J. P. Morris, “Simulations of underground structures subjected to dynamic loading using the distinct element method,” Shock Compression of Condensed Matter – 2003: Proceedings of the Conference of the American Physical Society Topical Group on Shock Compression of Condensed Matter, Vol. 706, No. 1, pp. 1470–1473, Jan. 2004, https://doi.org/10.1063/1.1780516
About this article

The authors have not disclosed any funding.
The datasets generated during and/or analyzed during the current study are available from the corresponding author on reasonable request.
Shang Fei is responsible for the overall conceptual design, data processing, manuscript writing and review of the paper; Wang Liangquan is in line with the review of the paper.
The authors declare that they have no conflict of interest.
