Abstract
As science and technology develop in recent years, the center of ship shafting has received high attention from the ship industry. The traditional ship shafting calibration mostly focuses on the issue that hull deformation cannot be accurately estimated. The ship is floating after entering the water, and this method is not conducive to the long-term stable operation of the ship shafting. To solve the above problems, the study establishes the optimization model of ship axis alignment based on slide alignment and finite element method. This model can be optimized by adopting the non-dominant sequencing genetic algorithm improved by elite strategy. The study verified the performance of the optimization model of ship axis alignment. The results showed that the adaptive value, super-volume value, and inverse generation distance of the improved genetic algorithm were 74.57, 0.38, and 0.03, respectively. In the application of a ship, the intermediate bearing position could be adjusted by the ship shafting optimization model based on the improved non-dominant sorting genetic algorithm. As a result, the shaft reaction under the ballast condition was reduced by 24019 N than before, making the bearing load of the ship shafting more uniform. To sum up, the proposed optimal model is robust, which can effectively reduce the impact of hull deformation, improve the optimal effect of ship shafting alignment and ensure the safe navigation of the ship.
1. Introduction
As the economy and technology develop, the ship industry is also seeking new breakthroughs [1, 2]. As one of the influential factors directly related to ship navigation safety, how to improve the alignment quality of ship shafting is important [3, 4]. Ship shafting alignment involves the adjustment of the height and position of each bearing to ensure that the static load distribution of each bearing aligns with the manufacturer’s specifications, to ensure the safe navigation and personnel safety [5, 6]. At present, the commonly used calibration method is reasonable calibration technology, which can ensure that the bearing load, the shaft section bending moment and the turning angle are within the reasonable range. However, reasonable calibration only considers the influence of various factors on the axial system under the static working condition and ignores the dynamic factors such as the hull deformation. Under the influence of temperature, loading, wave and other factors, the hull will deform to different degrees, which will change the relative height of the bearing and the bearing load. And the bending moment and corner of the shaft section will also change. Therefore, it is difficult to maintain the stability of the safe operation of the ship axle system for a long time [7]. To solve the above problems, a shipboard shafting optimization model is established based on slipway calibration and finite element method, and the non-dominated sorting genetic algorithm (NSGA) is improved by introducing elite strategy to obtain NSGA-II. The research aims to improve the shafting alignment ship quality, reduce adverse effects caused by hull deformation, and ensure the safe navigation of the ship. The research innovations mainly include the following two points. Firstly, the mathematical model of axon system is established by high-precision finite element analysis, which provides strong support for the establishment of alignment optimization model of axial system. Secondly, NSGA is improved by introducing elite strategy to obtain NSGA-Ⅱ algorithm for shafting optimization model. It forms the optimization model and provides a new design method for the ship shaft system.
The study includes four parts. The first part is a summary of the relevant research, the second part is the construction of the ship shafting optimization model based on NSGA-Ⅱ algorithm, the third part is feasibility verification of the model proposed in research, and the last part is a summary of the research.
2. Related works
Ship shafting alignment is the key to maintain the safe navigation of ship. Its alignment quality directly affects the navigation life of ship and the safety of ship personnel. How to improve the alignment quality of ship shafting has been deeply discussed by many scholars. To discuss shafting alignment effect on shaft vortex and bearing vibration, Lei et al. adjusted the ship shafting alignment under design conditions. The experimental results showed that adjusting the shafting alignment could significantly decrease the vortex and bearing vibration occurring in the shafting system. Moreover, the reduction of bearing vibration in the horizontal direction was observed to be more effective compared to the vertical direction [8]. Zhang et al. proposed a floating raft system including the floating raft, air spring installation system, etc. In addition, a test bench was built to test and monitor shafting alignment deformation. The results showed that emergency protection device of intelligent floating raft system could ensure system safety and alignment quality [9]. To reduce the possibility of bearing failure in the stern tube, Sun et al. designed some experiments. The diameter of the propeller shaft larger than 600 mm improved the shafting alignment mass due to the increase of the shaft stiffness, and promoted the ship to move forward [10]. Yibin et al. designed an algorithm to fit the shafting characteristic function, so as to accurately calculate displacement value. The results proved that it could be effectively used for installation and alignment of ship shafting [11].
NSGA is an algorithm that seeks the global optimal solution to multi-objective optimization problem. JaFari et al. balanced the energy consumption and delay of IOT equipment and solved the multi-objective problem by the metaheuristic algorithm obtained by combining NSGA and bees algorithms. The research findings demonstrated that the application of metaheuristic method not only had a negligible impact on energy consumption but also led to a substantial reduction in response time [12]. Babaeinesami et al. optimized NSGA to minimize both total cost and carbon dioxide emissions within a supply chain network. The simulation experiment showed that the algorithm could produce an effective Pareto solution and reduce total cost and carbon dioxide emission to a certain extent [13]. Aiming at optimizing the maximum completion time, Marri et al. designed a hybrid algorithm by NSGA and multi-objective energy sensing model. The simulation results proved that it performed well in terms of maximum completion time, delay time and energy [14]. Nikseresht et al. designed a mapping method by NSGA for the multi-objective problem in embedded system design. It showed a higher acceleration ratio than other task scheduling methods [15].
To sum up, there are many research results on ship shafting calibration and NSGA algorithm, but most of the shafting calibration is carried out after the ship is floating in the water, so the construction cost is high, and the construction period is long. Meanwhile, NSGA is mostly applied to other fields and rarely involved in ship calibration. To solve the above problems, an optimization model for ship alignment is established based on slipway alignment and finite element method, and NSGA-Ⅱ algorithm is used to improve ship shafting alignment quality and ensure the safe operation.
3. Ship shafting alignment optimization model construction based on NSGA-Ⅱ algorithm and slipway calibration
Ship shafting refers to a complete set of equipment from the output point of the main engine to the propeller. Its alignment quality is directly related to the safe operation of the whole ship and the safety of the crew. Therefore, the ship shafting alignment is very important. This chapter focuses on the establishment of optimal model for shafting alignment based on slipway calibration and NSGA-Ⅱ algorithm.
3.1. The ship shafting alignment optimization model based on ship bed calibration
Shipyard is the working platform for ship repair in the shipyard, which is the site facility for ship repair after manual processing. The ship shafting is generally calibrated based on the shipyard, which is an important part of the power plant. The axial pushing force generated by the rotation of the propeller is transmitted to the thrust bearing through the shafting, and then the thrust bearing directly acts on the hull, forcing the ship to move forward or backward [16, 17]. The arrangement of ship shafting is shown in Fig. 1.
Fig. 1Shift shifting layout
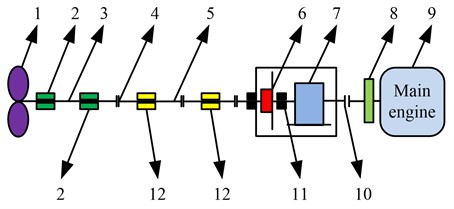
From No. 1 to No. 12 in Fig. 1 are respectively propeller, bearing, tail shaft, coupling, intermediate shaft, thrust bearing, reducer, flywheel, main engine, elastic coupling, thrust shaft and intermediate bearing. The shafting alignment means that the static load distribution of each bearing is reasonable and meets requirements of manufacturer by adjusting the height of each bearing [18, 19]. The quality of ship shafting alignments is important in normal operation of shafting and main engine. The shafting alignment calculation by the finite element method is to carry out optimal modeling of ship shafting [20]. The method principles are to disperse continuous solution area into a group of element combinations connected by finite nodes, and use the approximate function slices to represent unknown functions to be solved in all solution areas. The finite element method also requires assumptions of continuity, homogeneity, isotropy, small deformation, and load linearly related to deformation. The basic flow is shown in Fig. 2.
Fig. 2Basic flow of final element method
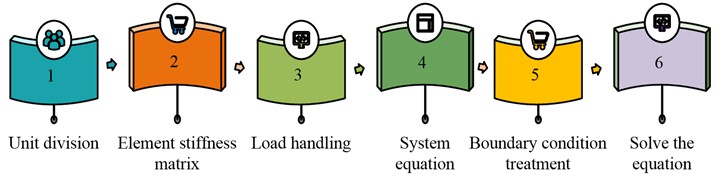
The basic flow in Fig. 2 includes element division, element stiffness matrix, load treatment, system equation, boundary condition treatment, and final solution equation. The load treatment is to discretize the whole system into element and generate respective element procedure during finite element modeling of the shaft system, so as to conduct system integration. The system equation is shown in Eq. (1):
is the system stiffness matrix. and respectively represent the node displacement vector and the system load vector. The purpose of shafting alignment optimization is to obtain a reasonable bearing height displacement value. For the shafting assembled based on the slipway, hull deformation and temperature rise of main engine shall be taken into consideration. Therefore, the shafting optimization model based on the feasible solution of the optimal design space has the characteristics of unknown, multi-dimensional, multi-peak, etc. Due to the cantilever action of propeller at the end of ship shaft system, the rear bearing capacity of tail tube is the largest. And because of the uneven pressure distribution, the bearing of rear shaft of tail tube is easy to form unilateral load and accelerate the bearing wear at this place. Therefore, the rear bearing capacity of tail tube is taken as the optimization objective function in the study, as shown in Eq. (2):
where, is counter-force of the rear bearing of the tail tube calculated by shafting alignment. and respectively represent the counter-force influence coefficient and bearing displacement. The load uniformity shall be measured considering the ship launching deformation, thermal expansion and other working conditions of main engine, bearing load uniformity and bending moment. Eq. (2) is the objective optimization function of the berth shaft system, shaft system cold state under pressure, hot state under pressure, full load cold state, and full load hot state, while the objective function of load uniformity is shown in Eq. (3):
where, is the load degree, and represents the supporting reaction of bearing . As there are up to six objective functions, it is difficult to optimize at the same time. Therefore, a three-objective function optimization model is established by converting the slipway shafting, full-load cold state and ballast cold state into constraint conditions, as shown in Eqs. (4)-(7):
where, , , and represent objective optimization functions of ballast thermal state, full-load thermal state and load uniformity. To ensure that the bearing load cannot be negative at this time, the minimum load requirements shall be met, as shown in Eq. (5):
where, and respectively represent the minimum allowable load and maximum allowable load of the bearing . Eq. (6) is the determination of :
where, , , and respectively represent the allowable pressure of the bearing , the length of the bearing lining and outer diameter of middle journal. The minimum allowable load is shown in Eq. (7):
where, and respectively represent the dead weight of the left and right span shafts of the bearing . represent the sum of the external load. Due to the limitation of the given shafting environment, the optimal model of ship shafting needs to be improved. Therefore, the variation of load force caused by the propeller convolution effect on the rear bearing of the stern shaft is also considered. The propeller convolution effect refers to the deflection of the propeller with the rotation of the shaft, the direction of its momentum moment vector changes constantly, and inertia force and moment on shaft are generated, as shown in Fig. 3.
Fig. 3Propeller friction effect
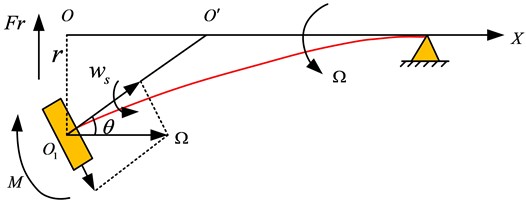
In Fig. 3, and are the rotational angular velocity and the rotational angular velocity, and respectively represent the inertia force and central deflection of the propeller, represent the inertia moment, and represent the rotational angle of the rotating shaft. The solution of inertia force and inertia moment is shown in Eq. (8):
where, is the propeller mass, and represent the inertia polar moment and inertia radial moment of propeller disc, and is the absolute angular velocity.
3.2. The design of NSGA-Ⅱ algorithm based on NSGA algorithm
Ship shafting system is a complex stressed system. To realize the shafting alignment on the berth, it must meet certain requirements under the berth and floating state. And the bearing force of the stern shaft shall be reduced as far as possible and the load shall be evenly distributed. Currently, the optimization of shafting alignment can be categorized as a multi-objective function optimization problem. It is important to note that the multi-objective optimization problem differs from a single-objective optimization problem. When there are multiple objective functions, it is important to find a solution to optimize all the objective functions at the same time due to the conflict between the objectives. Therefore, there is usually a Pareto optimal solution. To address the multi-objective function optimization, Pareto evaluation ranking method based on the relationship between the advantages and disadvantages of the solution can be used. The representative Pareto ranking method is NSGA algorithm. NSGA takes the non-dominated layer as its initial fitness value, and then uses the selection, cross, mutation and other operations of traditional genetic algorithm to generate sub-generation individuals. Finally, for the individuals on the same non-dominated layer, shared niche technology is used to re-designate virtual fitness value, so that Pareto optimal solution is evenly distributed. The Euclidean distance between individuals in the same non-governing layer shall be obtained first for the calculation of fitness value, as shown in Eq. (9):
where, is the number of target variables. and represent the upper and lower boundaries of non-governing layer . and are individuals and of the non-governing layer . Then the sharing function is used to calculate the relationship between individual and other individuals in the biotope population, as shown in Eq. (10):
where, is the shared radius, is the constant, and the small population number of the individual is shown in Eq. (11):
where, is the Niche Count of , and is the individual on the non-governing layer . Then the shared fitness value of is calculated in Eq. (12):
where, represents the individual fitness value of layer . Since the determination of needs to be determined manually, it often has a great contingency in the actual application, reducing the running efficiency and speed of the algorithm. An elite strategy is introduced to expand the NSGA algorithm to obtain the NSGA-Ⅱ. Fig. 4 is the composition of NSGA-II.
Fig. 4Composition of NSGA-Ⅱ
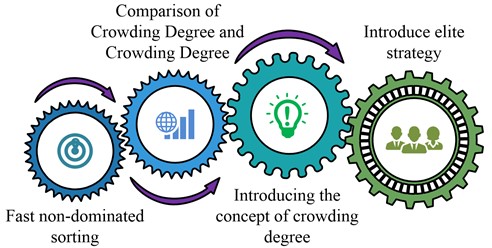
NSGA-II in Fig. 4 mainly consists of fast non-dominant sorting, crowding degree and crowding degree comparison, crowding degree concept introduction, and elite strategy introduction. Fast non-dominant sorting refers to reducing the time complexity from to and determining the population value by investigating the number of dominated individual and the dominated individuals set. Congestion degree refers to the average side length of the largest rectangle covering individual but excluding other individuals in the same non-dominated layer, and its calculation is shown in Eq. (13):
where, represents the degree of crowding. and respectively represent objective function value of and . and respectively represent the maximum and minimum values of . Crowding degree comparison operator shall be introduced to redefine the non-dominated relation of population after fast non-dominated sorting and crowding degree calculation. In the study, individuals and are selected for comparison. If any following conditions are met, individual is superior to individual , as shown in Eq. (14):
where, and respectively represent the non-governing layer between individuals and . and respectively represent crowding distance between and . Elitist strategy is to select the population composed of parent and descendant as the new parent . It eliminates the infeasible scheme, and sorts the population of the whole layer into according to the non-dominant order value. When the number of the whole layer reaches , individuals are added into according to the crowding degree to ensure that the population number is . Weighted evaluation method shall be used to evaluate Pareto optimal solution. First, normalization treatment shall be carried out for attribute value of objective function, as shown in Eq. (15):
where, represents the dimensionless utility value. and respectively represent the minimum value of objective function and all data. To reflect the order and mode selection of work execution, NSGA-II uses two-layer encoding to represent individuals, and its algorithm flow is shown in Fig. 5.
Fig. 5NSGA-Ⅱ algorithm flow diagram
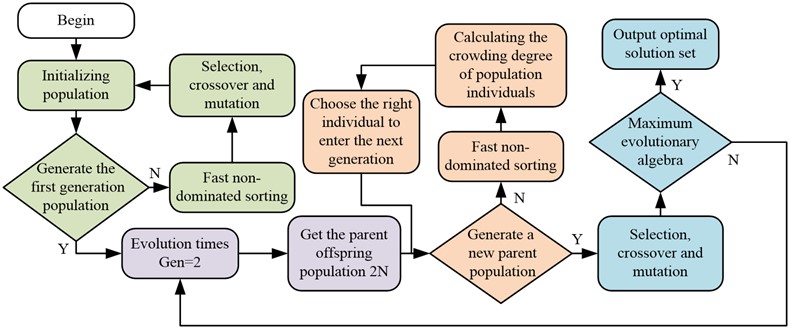
The algorithm flow in Fig. 5 is as follows: first, the solution approximates the Pareto optimal solution through fast non-dominant sorting. Then the population individual crowding degree is calculated and the appropriate individual is selected to generate a new parent population. Next, it determines whether the maximum evolution algebra is reached through selection, cross, mutation and other operations, so as to obtain the final Pareto optimal solution set.
3.3. Ship shafting optimization model results analysis based on NSGA-Ⅱ algorithm
To verify the feasibility of NSGA-Ⅱ by ship shafting optimization model, the study first compares NSGA-Ⅱ performance, and then applies ship optimization model to the propulsion shafting of a ship for practical application analysis. This chapter focuses on NSGA-Ⅱ performance and ship propulsion shaft optimization.
3.4. NSGA-Ⅱ performance analysis
To verify the effectiveness of NSGA-Ⅱ, MATLAB 2017a software is used for programming, and the Heuristic Particle Swarm Optimization (HPSO) and Ant Colony (AC) algorithms are used for comparative experiments. The experiment parameters of NSGA-Ⅱ algorithm are set as population 50, and the cross probability and variation probability are 0.8 and 0.2, respectively. The population size is 100 with a maximum iteration of 200. The test hardware environment: the host memory is 8 G, the processor is 8-core Intel (R) Core (TM) i7-7700 CPU @3.6 GHz, and the operating system is Windows 10. The performance indicators are adaptive value, Inverse Generation Distance (IGD) and Hyper Volume (HV). Smaller IGD means better algorithm convergence and distribution [19, 20].
Fig. 6Fitting results of four algorithms
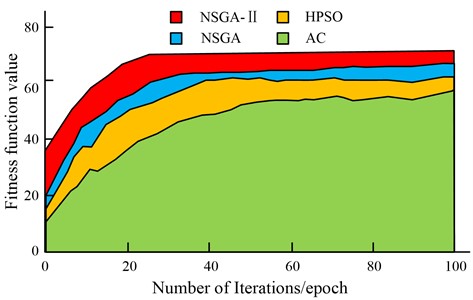
Fig. 6 shows the adaption values results. As the iteration number increases, the adaption values of the four algorithms are increased. After reaching a certain number of iterations, the curve of each adaption value tends to be flat. NSGA-Ⅱ algorithm has an adaptive value of 74.57 when the iteration number is 25 epoch. When the iteration number of NSGA algorithm is 34 epoch, the adaptive value is 58.77. HPSO algorithm has an adaptive value of 56.74 when the iteration number is 43 epoch. When the iteration number of AC algorithm is 62 epoch, the adaptive value is 52.33.
Fig. 7 shows the HV and IGD results. Fig. 7(a) shows the HV results. With the increase of the evaluation times, four HV values increase. When the evaluation times are 5000, the HV value of NSGA-II is 0.41, the HV value of NSGA is 0.38, the HV value of HPSO is 0.36, and the HV value of AC is 0.34. Fig. 7(b) shows the IGD results. As the evaluation times increase, the IGD values of four algorithms decline. When the evaluation times are 1000, the IGD values of NSGA-II are 0.92, and the IGD values of NSGA, HPSO, and AC algorithms are 1.25, 1.74, and 1.95, respectively. When the evaluation times are 5000, the IGD values of NSGA-II, NSGA, HPSO, and AC algorithms are 0.03, 0.06, 0.08, and 0.89, respectively. To further verify the performance of NSGA-II, Camel, Schaffer, and Goldstein-Price functions are used to test the four algorithms in Table 1.
Fig. 7HV and IGD results of four algorithms
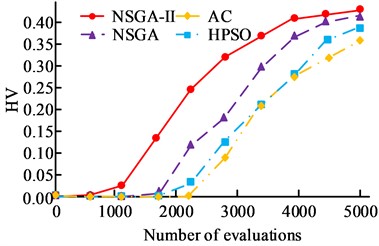
a) HV results of four algorithms
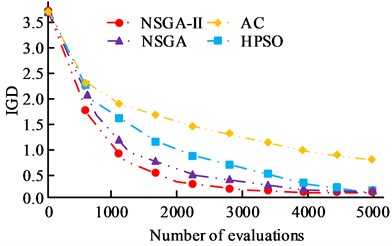
b) IGD results of four algorithms
Table 1Test results of four algorithms for optimizing three functions
Function | Experimental data | Algorithm category | Theoretical optimal value | |||
NSGA-Ⅱ | NSGA | HPSO | AC | |||
Camel | Convergence value | –1.0316 | –1.0321 | –1.0330 | –1.0301 | –1.0317 |
Time (ms) | 0.0341 | 0.0392 | 0.0422 | 0.0511 | ||
Schaffer | Convergence value | 1.0000 | 0.9998 | 0.9990 | 0.9984 | 1.0001 |
Time (ms) | 0.0732 | 0.0893 | 0.0944 | 1.0276 | ||
Goldstein-Price | Convergence value | 3.0001 | 3.2994 | 3.2987 | 3.2980 | 3.0003 |
Time(ms) | 0.0051 | 0.0841 | 0.0912 | 0.0988 | ||
In Table 1, the convergence time of NSGA, HPSO and AC algorithms for Camel function is 0.0392 ms, 0.0422 ms, and 0.0511 ms, respectively, which is lower than 0.0341 ms of NSGA-II. The convergence value of NSGA-Ⅱ for Schaffer function is 1.0000, and the convergence values of NSGA, HPSO, and AC algorithms are 0.9998, 0.9990, and 0.9984, respectively. For Goldstein Price function, the convergence time and experimental error of NSGA-Ⅱ algorithm are significantly lower than those of other three algorithms. Based on the above results, NSGA-Ⅱ algorithm has excellent performance and can significantly improve the effect of ship shafting alignment optimization.
3.5. Ship shafting optimization model application analysis based on NSGA-Ⅱ algorithm
To verify practicability of NSGA-Ⅱ-based ship shafting optimization model, the propulsion shafting of a ship is selected for application analysis. The shafting is connected with the main engine by a tail shaft and an intermediate shaft. The tail shaft is supported by two bearings, and intermediate shaft is provided with one bearing. Table 2 shows the basic parameters of the shafting.
Table 2Basic parameters of shifting
Basic parameter | 1# | 2# | 3# | 4# | 5# | 6# | 7# |
Axial position (mm) | 1920 | 4979 | 8356 | 12531 | 13289 | 14131 | 14980 |
Vertical position (mm) | –0.051 | 0.0051 | –0.062 | –0.028 | –0.008 | –0.021 | –0.013 |
Counter force (N) | 245082.4 | -25351.4 | 62819.3 | 107813.3 | 28626.5 | 78461.3 | 42958.7 |
In Table 2, there are 7 bearings in the propulsion shaft of a ship. The maximum load of bearing 1 is 245082.4 N, close to the maximum allowable pressure of 267000 N, and its value is several times that of other six bearings. The negative load of No. 2 bearing is –25351.4 N, and the vertical position is 0.0051 mm. Meanwhile, the load difference between adjacent bearings is very uneven, which affects the installation quality of shafting of a ship. When the relative rigidity of the shafting increases, the hull deformation of a ship will be more sensitive. To explore the influence of hull deformation on shafting, the bearing force of each bearing under ballast and full load is analyzed.
Fig. 8Impact of ball and full load deformation on axial system action force
a) Influence of ballast deformation on axle system reaction force
b) Influence of full load deformation on axle system reaction force
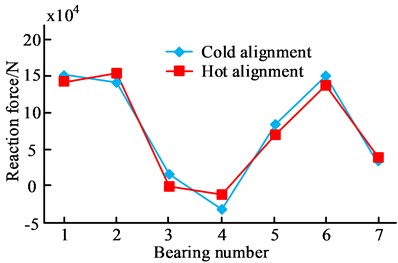
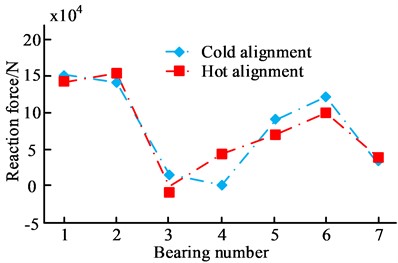
Fig. 8 shows the deformation influence on shaft counter-force of each bearing under ballast and full load. Fig. 8(a) shows the ballast deformation influence on the shaft counter-force. When the shaft counter-force of other bearings is positive, the shaft counter-force of 4# bearing under cold and hot alignment is –47514 N and –18973 N, respectively. Fig. 8(b) shows the influence of full-load deformation on the shaft system reaction. The shaft system reaction of No. 3 bearing under cold alignment is 14523 N, and the shaft system reaction under hot alignment is –8741 N. From Fig. 8, the deformation of the hull makes the bearing load meeting the original alignment requirements negative, which is not conducive to the safe operation of the ship's shafting. To solve the above problems, the deformation data of the ship hull are integrated into the optimal scheme, and the position of the intermediate bearing of the shafting is adjusted, so that the optimal result can be obtained for a ship’s shafting.
Fig. 9Impact response display change and optimization results after position adjustment
a) Impact response displacement change
b) Comparison of optimal load between ballast and full load
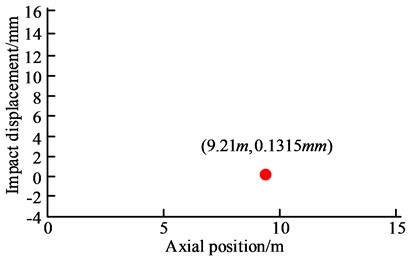
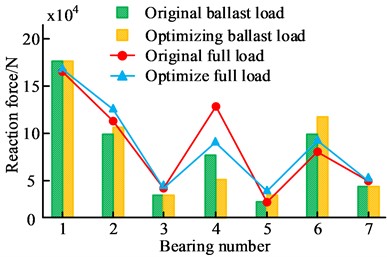
Fig. 9 is the optimization result of the impact response displacement change and the adjusted position of the intermediate bearing, and Fig. 9(a) is the impact response displacement change curve of the intermediate bearing. When the axial position 9.21 m, the impact displacement is 0.1315 mm, where the impact peak load is the minimum. Fig. 9(b) shows the optimization results when the intermediate bearing is adjusted to (9.21 m, 0.1315 mm). Under the ballast, the load of 4# bearing before adjustment is 74010 N, and its load is 49991 N after adjustment. Under the full load, the load of 4 # bearing before and after adjustment is 124023 N and 78453 N, respectively. According to Fig. 8, the load non-uniformity is greatly improved after adjusting intermediate bearing position. When the ship runs normally in the water, the gyroscopic effect of the propeller always exists. Based on the above, the thermal state of ballast and full load is used to analyze the shafting alignment under the gyroscopic effect.
Fig. 10Impact of gyro effect on axle alignment in full load hot state and ballast hot state
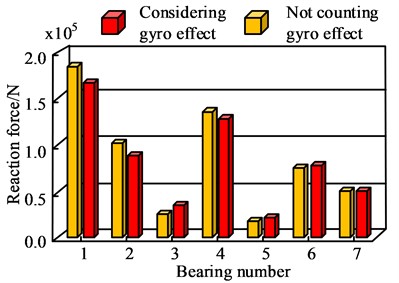
a) Full-load thermal gyro effect
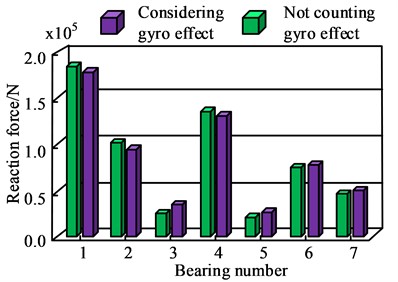
b) Ballast thermal gyro effect
Fig. 10 shows the influence of gyro effect on shafting alignment under full load thermal state and ballast thermal state. Fig. 10(a) shows the influence of gyro effect on shafting alignment under full load thermal state. When the gyro effect is not included in bearing 4, the shaft reaction force is 141971 N, and when the gyro effect is included in bearing 4, the shaft reaction force is 137487 N. Fig. 10(b) shows the influence of gyroscopic effect on shafting alignment under ballast thermal state. The shaft reaction of bearing 4 without and with gyro effect is 140784 N and 136458 N, respectively. To sum up, the proposed shafting alignment optimization model has theoretical feasibility and can meet the safe operation requirements of the ship.
4. Conclusions
The ship shafting is vital in the power plant of a ship, and its alignment condition is crucial for ensuring the safe operation of the entire shafting system. Enhancing the alignment quality of ship shafting has emerged as a prominent focal point in the ship industry, given its significance in maintaining operational safety. Due to the difficulty in accurately estimating the hull deformation, the traditional shafting alignment is mostly carried out after the ship is floating, which cannot ensure the long-term stable safe operation of the ship's shafting. To solve the above problems, an optimization model of ship shaft system based on slipway assembly and finite element method is proposed, and NSGA-Ⅱ can solve optimization model. The results showed that in terms of algorithm performance, when the evaluation time was 5000, the HV value of NSGA-Ⅱ was 0.41, which was higher than other algorithms; while the IGD value of NSGA-Ⅱ was only 0.03, which was lower than other algorithms. In the application of ship axis optimization model, when the position of bearing 4 of the ship shaft system was adjusted to (9.21 m, 0.1315 mm), the shaft counter-force under the ballast and full load was 49991 N and 78453 N, respectively, which was reduced by 24019 N and 45570 N, respectively, compared with that before the adjustment. Under the ballast thermal state, the shafting reaction of bearing 4 with gyro effect included was 136458 N, lower than 140784 N without gyro effect included. To sum up, the NSGA-Ⅱ-based ship shafting optimization model is robust, which can effectively shorten the construction period and reduce the construction cost. However, since the optimization model proposed by the study was only verified by theoretical calculation and not verified by practical application, the effect of more than a dozen applications is still unknown, so the research focus of the fence is how to place it with the actual installation process of the ship shaft.
References
-
K. Jain and A. Saxena, “Simulation on supplier side bidding strategy at day-ahead electricity market using ant lion optimizer,” Journal of Computational and Cognitive Engineering, Vol. 2, No. 1, pp. 17–27, Mar. 2022, https://doi.org/10.47852/bonviewjcce2202160
-
M. Hassel, I. B. Utne, and J. E. Vinnem, “An allision risk model for passing vessels and offshore oil and gas installations on the Norwegian continental shelf,” Proceedings of the Institution of Mechanical Engineers, Part O: Journal of Risk and Reliability, Vol. 235, No. 1, pp. 17–32, Sep. 2020, https://doi.org/10.1177/1748006x20957481
-
S. Sahoo, S. P. Parida, and P. C. Jena, “Dynamic response of a laminated hybrid composite cantilever beam with multiple cracks and moving mass,” Structural Engineering and Mechanics, Vol. 87, No. 6, pp. 529–540, Sep. 2023, https://doi.org/10.12989/sem.2023.87.6.529
-
S. P. Parida and P. C. Jena, “International journal of innovative technology and exploring engineering,” International Journal of Innovative Technology and Exploring Engineering, Vol. 8, No. 10, pp. 4389–4394, Feb. 2024, https://doi.org/10.35940/ijitee
-
Z. Yin, Z. Huang, and H. Zhang, “Experimental study on steel plate shear walls with partially encased composite columns composed of thin steel plate,” KSCE Journal of Civil Engineering, Vol. 27, No. 3, pp. 1118–1135, Jan. 2023, https://doi.org/10.1007/s12205-023-0017-0
-
D. Yang, H. Qin, X. Xie, and Z. Zhang, “Suppression of lateral vibration in a shafting system via an auxiliary active magnetic bearing with position control,” Proceedings of the Institution of Mechanical Engineers, Part C: Journal of Mechanical Engineering Science, Vol. 237, No. 7, pp. 1581–1594, Nov. 2022, https://doi.org/10.1177/09544062221130275
-
S. Sahoo and P. C. Jena, “Effect of lamina orientation, crack severity, and fillers on dynamic parameters of hybrid composite cantilever beam with double transverse cracks,” Materialwissenschaft und Werkstofftechnik, Vol. 54, No. 6, pp. 737–750, Jun. 2023, https://doi.org/10.1002/mawe.202200205
-
J. Lei, R. Zhou, H. Chen, Y. Gao, and G. Lai, “Experimental investigation of effects of ship propulsion shafting alignment on shafting whirling and bearing vibrations,” Journal of Marine Science and Technology, Vol. 27, No. 1, pp. 151–162, May 2021, https://doi.org/10.1007/s00773-021-00822-0
-
Y. Zhang, W. Xu, Z. Li, and L. Yin, “Alignment and safety analysis of marine propulsion shafting using intelligent floating raft system,” Journal of Marine Science and Technology, Vol. 26, No. 2, pp. 323–330, May 2020, https://doi.org/10.1007/s00773-020-00738-1
-
J.-S. Sun, Y.-G. Kim, and U.-K. Kim, “Study on shaft alignment of propulsion shafting system depending on single reaction force supporting position of aft stern tube bearing,” Journal of Marine Science and Technology, Vol. 26, No. 4, pp. 1340–1357, Mar. 2021, https://doi.org/10.1007/s00773-021-00803-3
-
D. Yibin, Y. Xiaogang, H. Yanling, P. Tian, and Z. Hanhua, “Calculation method of intermediate bearing displacement value for multisupported shafting based on neural network,” Journal of Ship Research, Vol. 65, No. 4, pp. 286–292, Dec. 2021, https://doi.org/10.5957/josr.02200007
-
V. Jafari and M. H. Rezvani, “Joint optimization of energy consumption and time delay in IoT-fog-cloud computing environments using NSGA-II metaheuristic algorithm,” Journal of Ambient Intelligence and Humanized Computing, Vol. 14, No. 3, pp. 1675–1698, Jul. 2021, https://doi.org/10.1007/s12652-021-03388-2
-
A. Babaeinesami, H. Tohidi, P. Ghasemi, F. Goodarzian, and E. B. Tirkolaee, “A closed-loop supply chain configuration considering environmental impacts: A self-adaptive NSGA-II algorithm,” Applied Intelligence, Vol. 52, No. 12, pp. 13478–13496, Jan. 2022, https://doi.org/10.1007/s10489-021-02944-9
-
N. P. Marri and N. R. Rajalakshmi, “MOEAGAC: An energy aware model with genetic algorithm for efficient scheduling in cloud computing,” International Journal of Intelligent Computing and Cybernetics, Vol. 15, No. 2, pp. 318–329, Apr. 2022, https://doi.org/10.1108/ijicc-07-2021-0134
-
M. Nikseresht and M. Raji, “MOGATS: A multi-objective genetic algorithm-based task scheduling for heterogeneous embedded systems,” International Journal of Embedded Systems, Vol. 14, No. 2, p. 171, Jan. 2021, https://doi.org/10.1504/ijes.2021.113811
-
N. Kumar and S. C. Sharma, “Shear-thinning and piezoviscous lubricant behavior of spiral grooved hybrid thrust pad bearing configurations,” Proceedings of the Institution of Mechanical Engineers, Part J: Journal of Engineering Tribology, Vol. 237, No. 2, pp. 335–355, Aug. 2022, https://doi.org/10.1177/13506501221115314
-
J. J. Prabhu, A. K. Dash, V. Nagarajan, and M. R. Sunny, “Vibration analysis of cycloidal propeller blade during ship maneuvering,” Journal of Marine Science and Technology, Vol. 28, No. 1, pp. 44–71, Oct. 2022, https://doi.org/10.1007/s00773-022-00899-1
-
P. Kaewkhiaw, “Numerical study of propeller boss cap fins on propeller performance for Thai Long-Tail Boat,” Ocean Systems Engineering, Vol. 11, No. 4, pp. 373–392, Dec. 2021, https://doi.org/10.12989/ose.2021.11.4.373
-
P. S. Rao, “Wideband mimo antenna with reduced mutual coupling,” Analog Integrated Circuits and Signal Processing, Vol. 114, No. 3, pp. 451–458, Feb. 2023, https://doi.org/10.1007/s10470-023-02139-x
-
X. Zhou, “Response of characteristics of subway vibration load based on finite element method,” Journal of Testing and Evaluation, Vol. 51, No. 1, pp. 85-96, Jan. 2023, https://doi.org/10.1520/jte20210783
About this article

The authors have not disclosed any funding.
The datasets generated during and/or analyzed during the current study are available from the corresponding author on reasonable request.
The authors declare that they have no conflict of interest.
