Abstract
Based on fuzzy rough set and whale optimization algorithm, the automatic fault detection method of high-voltage electric energy metering transformer is studied to improve the fault diagnosis effect and efficiency. On the basis of constructing the mathematical model of gradual fault of high-voltage electric energy metering transformer, the fuzzy rough set theory is used to reduce the data attributes of fault samples, eliminate similar attributes, determine the minimum fault feature set, and complete the fault feature selection, which is used as the input of the fault detection model based on Whale Optimization Algorithm-based Support Vector Machine (WOA-SVM). After the kernel parameters and penalty factors of SVM are optimized by whale optimization algorithm, the type of gradual fault of high-voltage electric energy metering transformer is identified. The experimental results show that the reduced fault attributes are distributed differently in the sample data, and the fault detection accuracy can be improved by 9.5 % through fault feature selection. The fault diagnosis model with Gaussian radial basis function, kernel parameter of 0.05 and penalty factor of 10 has the best performance. This method can identify the gradual fault types of high-voltage electric energy metering transformers, and the fault diagnosis effect is outstanding.
1. Introduction
As an important metering and relay protection equipment in power system, high-voltage electric energy metering transformer mainly provides primary current information for electric energy metering and relay protection [1] in the station, and its technical level and quality are directly related to the accuracy of current information measurement. Once the high-voltage electric energy metering transformer fails, it will bring great influence on the safe and reliable operation of substation [2]. With the rapid development of smart grid and the continuous improvement of current transmission level, some problems have been exposed in the reliability of high-voltage electric energy metering transformers [3]. In practical work, the high-voltage electric energy metering transformer will be affected by many factors such as temperature and vibration, and its reliability will be reduced. Lossy devices such as optical devices and electronic devices used in high-voltage electric energy metering transformers will gradually deteriorate in the harsh environment of substations for a long time [4]. On the other hand, the short-circuit fault, grounding fault and the interference caused by the switching operation of substation will also have an impact on the high-voltage electric energy metering transformer [5]. These factors will lead to the decline of measurement accuracy of high-voltage electric energy metering transformers, and even lead to serious failures. When the high-voltage electric energy metering transformer has a gradual fault, the output signal will drift slightly. It is of great significance to analyze the output signals at different fault stages and extract the fault characteristics that characterize the gradual fault trend [6].
A new fault diagnosis method based on memory spike neural network proposed by Cabrera L. V. et al. can distinguish between real faults and false faults caused by measurement tampering attacks, and effectively reduce the fault diagnosis range by finding suspicious fault sections under the condition of determining the existence of real faults, but this method is affected by model parameters and fails to achieve outstanding detection results [7]; Nguyen T. N. and others use artificial neural network to diagnose equipment faults, but the convergence speed of this network is slow and it is easy to fall into local optimal problems [8]; Althubaiti A. et al. studied the early fault diagnosis method of equipment in order to reduce the maintenance cost and prolong the service life of equipment. After extracting the fault features by decomposing the output signal of equipment in time and frequency domain, support vector machine was used to identify the fault type. A large number of redundant information in the fault signal of equipment was the main reason for the low fault diagnosis accuracy [9]. Kazemi Z. et al. estimated the three-phase current in the primary winding of the transformer by using the extended Kalman filter, but when the transformer fails, the estimated current will contain a large number of residual signals, and the estimation error covariance matrix is used as the basis for fault location and identification, and the transformer fault diagnosis is completed by support vector machine, which has the problem of low fault diagnosis accuracy [10]; Illias H. A. et al. proposed to optimize the fault diagnosis model based on support vector machine based on mixed feature selection of transformer fault signals, but the convergence speed of the optimization model was too slow [11]. Rough set theory has been widely used in data mining in recent years [12]. Rough set can realize data attribute reduction only by the influence of attribute data on sample labels when the qualitative relationship between attributes is unknown, but its structured information representation also causes its limitations [13]. (Fuzzy rough sets,FRS) optimizes rough sets through fuzzy similarity relation, and the two can complement each other well, thus completing the determination of the minimum fault feature set [14]. Whale optimization algorithm is a new intelligent optimization algorithm inspired by humpback whales' predation behavior, which has the characteristics of simple structure and fast convergence. Compared with traditional optimization algorithms, whale optimization algorithm has stronger global optimization ability [15]. Therefore, this paper studies the automatic fault detection method of high-voltage electric energy metering transformer based on the fuzzy rough set and whale optimization algorithm, which improves the fault detection effect and efficiency. Based on the progressive fault mathematical model of high-voltage power metering transformer, fuzzy rough set theory is used to reduce the attribute of fault sample data, and the fault feature selection is realized by eliminating similar attributes and determining the minimum fault feature set, which is used as the input of the fault detection model based on WOA-SVM. At the same time, Whale optimization algorithm is used to optimize the kernel parameters and penalty factors of support vector machine to realize the identification of progressive fault types of high-voltage power metering transformers.
2. Automatic detection of gradual fault of high-voltage electric energy metering transformer
2.1. Mathematical model of gradual fault of high-voltage electric energy metering transformer
As an important measuring and sensing equipment in the power grid, the reliability of high-voltage electric energy metering transformer will affect the safe and stable operation of the power grid. The faults of high-voltage electric energy metering transformer can be divided into sudden faults and gradual faults, among which the signal change rate of sudden faults is large, and its output signal will change obviously when faults occur, which is easy to diagnose. The signal of gradual fault changes slowly, which is not easy to be found by conventional monitoring methods. With the deepening of fault degree, it may cause great harm and affect the safe operation of power grid. Therefore, this paper studies the gradual fault detection method of high-voltage electric energy metering transformer to ensure the safe and stable operation of the power grid.
2.1.1. Drift deviation fault
The sensor head of the high-voltage electric energy metering transformer is easily influenced by temperature, which leads to the deterioration of the performance of optical or electronic components and the drift of the measured value with time. It is defined as the drift deviation fault, which is described by the following Eq. (1):
where: the signal drift fault coefficient is expressed as , which is a constant; any time after the failure is expressed as , the starting time of the fault is expressed as .
2.1.2. Variation deviation fault
Due to the influence of temperature or aging on magneto-optical materials, the transformation ratio changes suddenly, which leads to the distortion of the output signal of high-voltage electric energy metering transformer, which is called transformation ratio fault. This kind of fault is characterized by that the frequency and phase of the measured value are consistent with the normal waveform, but the amplitude changes in proportion. This kind of fault signal can be described by the following Eq. (2):
Among them: is a constant, and the true current amplitude is , and true angular frequency and phase are expressed as , , the measurement time is expressed as .
From the above analysis, it can be seen that the measurement deviation of high-voltage electric energy metering transformer is mainly caused by drift deviation and ratio deviation fault. Because the free noise and system deviation have been dealt with inside the protection device, this paper only considers drift deviation fault and ratio deviation fault, and the mathematical model of high-voltage electric energy metering transformer fault is as follows:
where: the output current and voltage signals of the high-voltage electric energy metering transformer are expressed as , , the corresponding actual amplitudes are respectively , ; Gradual fault deviation is expressed as . For different fault types, there is a functional form corresponding to Eq. (1) or (2).
At the initial stage of gradual fault, the difference between the output signal of faulty equipment and the output signal of normal equipment is small, which has little influence on the stability of power grid operation. With the passage of time, the degree of fault gradually deepens, and when a serious fault occurs, it will cause serious harm to the safe operation of the power grid. Different from abrupt fault, the gradual fault of high-voltage electric energy metering transformer can be accurately judged by analyzing its output signal characteristics, so as to eliminate the fault as soon as possible.
2.2. Selection of gradual fault characteristics of high-voltage electric energy metering transformer based on fuzzy rough set
The influencing factors of gradual failure of high-voltage electric energy metering transformer are complex, and the number of fault sample data attributes is large, which leads to long data processing time and is not conducive to fault classification. Because there are a large number of similar attributes in fault data, and these similar attributes have similar effects on the results of fault classification, the difference is minimal, so the subsequent data classification can be carried out through fault attribute reduction, that is, a main attribute replaces the similar attributes. The fuzzy rough set algorithm is used to reduce the fault data, and the fault features of the fault data are selected. By selecting the fault features, the minimum fault feature attribute set of the data is obtained, which can improve the speed of subsequent fault diagnosis.
2.2.1. Fuzzy rough set attribute reduction algorithm
For vague and incomplete information, rough set can describe the data in the boundary area only through sample data without any prior information outside the data set. Attribute reduction through rough set and selection of effective fault features can reduce data dimension and unnecessary conditional attributes, thus simplifying calculation and reducing the complexity of fault diagnosis model.
Both fuzzy sets and rough sets can describe the uncertainty of data information. Compared with fuzzy sets, which need to subjectively determine the membership degree by expert experience, rough sets are more objective and convincing in describing data. However, the structure of rough sets itself also brings some limitations, and the vague concepts are too simple to describe, and there is no mechanism to deal with uncertain original data [16]. Rough set based on fuzzy dependence is a simple and reliable attribute reduction algorithm, which can combine the advantages of rough set and fuzzy set, study the upper and lower approximations of rough set through fuzzy approximation relationship, and use fuzzy rough set to reduce attributes to describe the data set more accurately [17].
Set is a fuzzy approximate space, is the fuzzy equivalence relation on universe , attribute set , is a conditional attribute set, is the decision attribute set. Using attribute sets ’s fuzzy set of to describe fuzzy decision-making , for any element in , is its relationship equivalent classes in , is membership of object to fuzzy sets and the lower approximate membership function description Eq. (5) is:
The description Eq. (6) of the upper approximate membership function is:
is in a fuzzy approximation space of the fuzzy rough sets based on . indicates that it definitely belongs to the membership of , indicates that it might belong to the membership degree of .
Construct the decision table of , the Eq. (7) of membership degree belonging to fuzzy positive domain of is:
According to the fuzzy positive domain, the ambiguous dependence of the decision attribute on the conditional attribute can be obtained, the calculation Eq. (8) is:
Set conditional attributes , the property for all conditional attributes the relative importance of can be described by the following Eq. (9):
2.2.2. Fault feature selection based on fuzzy rough set
Fault attribute is a continuous attribute. Because the conditional attribute of fuzzy rough set is fuzzy, there is no need to discretize the data. Firstly, the data of the same fault attribute are normalized by using min-max standardization. For the fault data under attributes , the result of sample of the normalized is described by the following Eq. (10):
where: , are respectively the maximum and minimum values of the fault data of each attribute.
The fault attribute is regarded as the conditional attribute set of fuzzy rough set , the category label as the decision attribute set , establish a fault diagnosis decision table, blur the conditional attributes into fuzzy equivalent classes, and calculate the attribute dependence of fault attributes on fault categories according to Eq. (8) .
Calculate the relative importance of the attributes of the condition according to Eq. (9), and the fault attributes are reduced, the threshold of relative importance is set, and the attributes with low dependence are eliminated to get the minimum fault feature set.
2.3. Gradual fault detection model of high-voltage electric energy metering transformer based on WOA-SVM
2.3.1. Whale optimization algorithm
Whale Optimization Algorithm (WOA) is a new heuristic algorithm inspired by the predation behavior of humpback whales [18]. Humpback whales have a unique hunting method-bubble net foraging, which feeds through the mechanism of continuous contraction and encirclement, spiral position updating and random hunting. Here are three behaviors of humpback whales during foraging.
(1) Surround the prey. Humpback whales can identify the location of their prey and surround them. Because the position of the optimal individual in the search space is not known a priori, the whale optimization algorithm assumes that the position of the individual with the highest fitness is the target position or near the optimal position. After defining the best individual, other individuals will try to update their position towards the position of the best individual. The expression of this behavior is:
where: the current iteration number is expressed as , the coefficient variable is expressed as , , is the position vector of the current best individual, is the position vector, is an operator that takes an absolute value, is an element-by-element multiplication. Coefficient variable , can be determined by the following Eq. (13, 14):
Among them: is a coefficient that decays from 2 to 0 as the iteration begins, , is a random variable in the [0, 1] interval.
(2) Bubble net attack. Whale Optimization Algorithm Two methods are designed to simulate the bubble net behavior of humpback whales on the mathematical model.
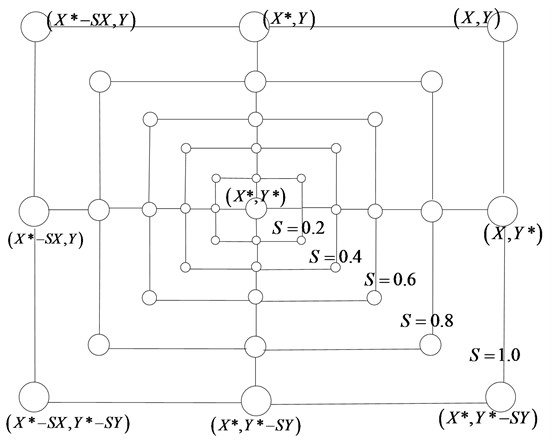
a) Contraction surrounding mechanism. This behavior is achieved by reducing the coefficient in Eq. (12) to achieve it. From Eq. (13), the fluctuation range of the coefficient is affected by coefficient , actually is a random value between . With coefficientfrom 2 to 0, the position of individual update is getting closer and closer to the current position of the best individual. Fig. 1 shows that when , the possible position of the whale individual in the process of contracting to the optimal individual.
Fig. 1Schematic diagram of shrink wrap mechanism
b) Spiral update position. This method first calculates the distance from the individual position to the optimal individual position, and then uses the helix Eq. (15) to simulate the spiral surrounding behavior of humpback whales, which is described as:
Among them: represents the distance between the individual position and the optimal individual position; is a constant that defines the shape of the helix; is a random number between [–1, 1].
Humpback whales shrink their encirclement while spiraling around their prey. In order to simulate these two behaviors at the same time by mathematical model, it is assumed that there is a 50 % probability to choose the contraction surrounding behavior and the spiral updating behavior respectively. The mathematical model of bubble net attack is as follows:
Among them: is a random number in the interval [0, 1].
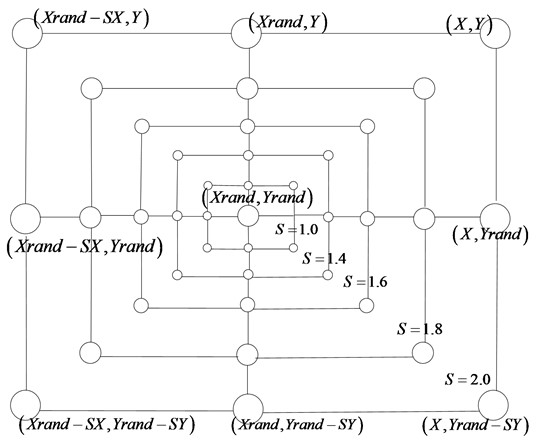
(3) Randomly update the location. Similarly, changes in variables can be used to search for prey. In fact, humpback whales search randomly according to each other’s position. Therefore, set when , the humpback whale is forced to update its position according to the randomly selected individual instead of the optimal individual, which makes the WOA algorithm have stronger global search ability. The mathematical model is as follows:
Among them: is an individual randomly selected from the current group. When , the possible position of the individual is shown in Fig. 2.
Fig. 2Schematic diagram of random search mechanism
2.3.2. SVM parameter optimization based on WOA
In practical application, most fault sample data are linearly inseparable. As an effective and widely used mainstream classification algorithm [19] in machine learning, Support Vector Machine (SVM) can not only classify linearly separable data, but also have excellent classification effect on nonlinear separable and nonlinear inseparable data. Support vector machine can balance the relationship between learning ability and the complexity of fault classification model according to the known fault sample data, and it does not need a lot of fault sample data, so it is very suitable for fault classification of complex chemical systems [20]. However, SVM parameters are an important factor affecting its classification performance. In order to improve the detection accuracy of gradual fault of high-voltage electric energy metering transformer, this paper uses WOA algorithm to optimize it.
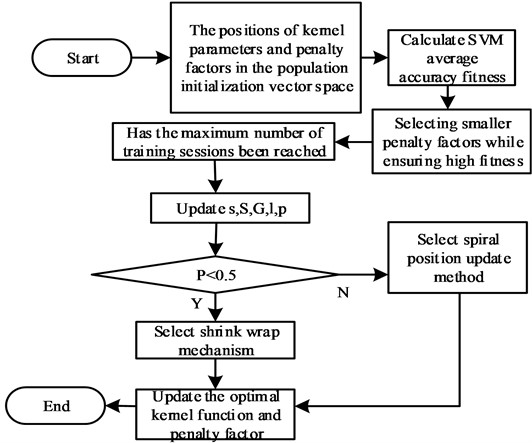
The optimization process of SVM parameters based on WOA is as follows: firstly, whale individuals are randomly generated in the search space to form an initial population; Then, in the process of evolution, the population updates their positions according to the current optimal whale individual or randomly selects a whale individual; Then, according to the randomly generated number, it is decided whether the whale individual makes spiral motion or encirclement motion; Finally, the loop iterates until the WOA algorithm meets the termination condition. The flow chart of SVM parameter optimization based on WOA is shown in Fig. 3. By optimizing the parameters of SVM through WOA, the traditional manual trial and error process can be avoided. Combined with the characteristics of WOA algorithm, such as few adjustment parameters, simple structure and fast convergence speed, the penalty factor and kernel parameters of SVM can be quickly optimized to improve the accuracy of state recognition of WOA-SVM. In the experiment, the average classification accuracy of support vector machine in the sense of cross-validation is used as fitness function to evaluate the fitness of each individual in the whale population, and the members with higher fitness are retained, trying to find the penalty factor and kernel parameters corresponding to the best fitness in the search space. At the same time, the WOA-SVM is improved in view of the fact that the penalty factor is too large, which will lead to the over-fitting phenomenon and reduce the generalization ability of the classifier:
where: , are the best punishment factor and fitness of current whales; The penalty factor and fitness of sequence whales are expressed as follows , , is allow the threshold of fitness to be lowered, it is possible to obtain a higher fitness and a smaller penalty factor.
Fig. 3Flow chart of SVM parameter optimization based on WOA
2.4. Model structure and process of gradual fault detection for high-voltage electric energy metering transformer
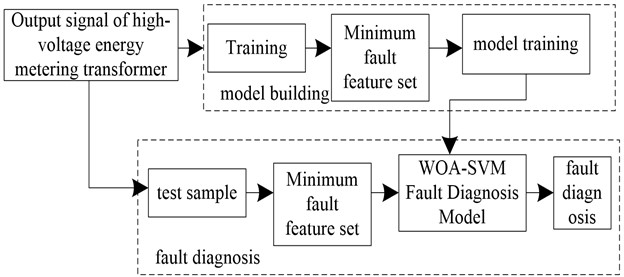
SVM is trained by using the feature vector constructed by the historical output signal of high-voltage electric energy metering transformer, and the parameters of SVM are optimized by WOA algorithm, and the fault diagnosis model based on WOA-SVM is obtained. According to the fuzzy rough set theory, the real-time output signal of high-voltage electric energy metering transformer is processed, and the fault feature vector is constructed, which is used as the WOA-SVM fault diagnosis model to realize the on-line detection of gradual fault of high-voltage electric energy metering transformer. The progressive fault detection model of high-voltage electric energy metering transformer based on WOA-SVM is shown in Fig. 4.
Based on WOA-SVM, the gradual fault detection process of high-voltage electric energy metering transformer is as follows:
(1) Historical fault signal acquisition: the output signals of high-voltage electric energy metering transformers under different operating conditions are acquired to obtain historical fault sample data.
(2) Fault feature extraction: the original fault feature signal of high-voltage electric energy metering transformer is analyzed by fuzzy rough set algorithm to obtain the minimum fault feature set.
(3) Taking the minimum fault feature set as the input of SVM, the SVM is trained and learned by using the feature vector set and the corresponding fault label set, and its parameters such as penalty factor and kernel function are optimized by WOA algorithm to determine the gradual fault detection model of high-voltage electric energy metering transformer.
(4) The trained gradual fault detection model is used to identify the fault types of the test samples, and the gradual fault detection of the high-voltage electric energy metering transformer is realized.
Fig. 4WOA-SVM based gradient fault detection model for high-voltage energy metering transformers
3. Experimental analysis
By using sensors or instruments to monitor the all-fiber current transformer in a high-voltage electric energy metering system, the original output signals under different operating states are collected, and a sample data set is constructed, including one data set under normal operating state and four data sets under preset fault state. Each dataset consists of 400 samples with a corresponding number of observed variables of 40. The four preset faults are represented by H1-H4. The collected sample data set is reduced by fuzzy rough set theory, similar properties are eliminated, and the minimum fault feature set is determined as the input for further analysis. The whale optimization algorithm is applied to the optimization of kernel parameters and penalty factors of support vector machine (SVM) model. The maximum number of iterations of whale optimization algorithm is 500 times, the size of whale population is 80 times, and the range of kernel parameters and penalty factor of support vector machine is 0.100, within which the optimal solution is searched. Using the reduced minimum fault feature set as input, a progressive fault automatic detection model is constructed based on the optimized SVM model. This method is used to detect the gradual fault of a fiber optic current transformer, and its fault detection performance is analyzed. The all-fiber current transformer in the high-voltage electric energy metering system is shown in Fig. 5.
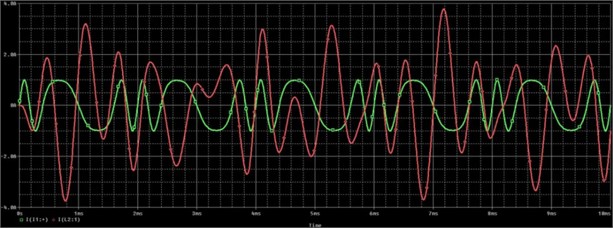
The original output signals under different operating states are shown in Fig. 6.
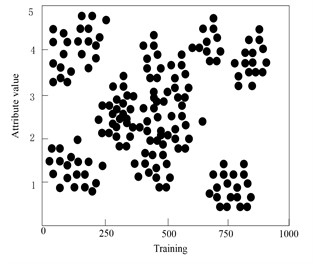
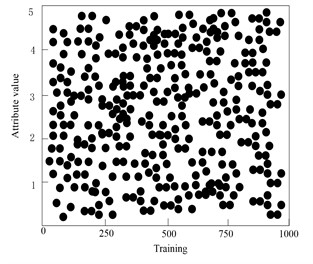
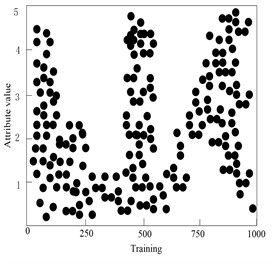
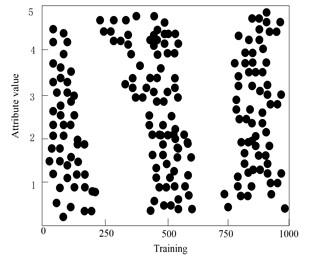
200 samples from each sample data set are selected as training sample data, and the fault features of the training samples are selected by this method. In order to clearly present the results of fault feature selection, this paper makes multidimensional visual analysis of the reduced fault feature attributes, and the experimental results are shown in Fig. 6. The -axis label represents the attribute value, that is, how a particular attribute changes during training. The -axis label represents the progress of the training, that is, the different iterations or time steps in the training process. By matching the attribute value with the training process, we can observe the change trend of different attributes in different training stages. This helps analyze the impact of attributes on algorithm performance and determine when the optimal attribute configuration or algorithm state is reached.
Fig. 5All-fiber current transformer in high-voltage electric energy metering system
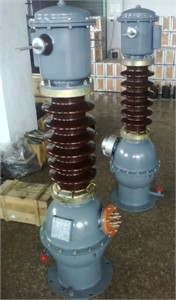
Fig. 6Original output signals under different operating states
From the analysis of Fig. 7, it can be seen that the fault features of 1000 selected sample data are selected by this method, and the conditional attribute set consisting of 40 observation variables and the decision attribute set consisting of five fault category labels together constitute the fault attribute set of sample data. On the basis of sample data normalization, the fault features are reduced by calculating the relative importance of 40 fault attributes of sample data, setting the relative importance threshold to 0.78, and eliminate all the fault attributes of 0.78, after reduction, the minimum fault feature set containing 6 fault attributes is finally obtained. Each fault attribute presents the characteristics of differential distribution in the training samples, which will be beneficial to the accurate detection of gradual faults of high-voltage electric energy metering transformers.
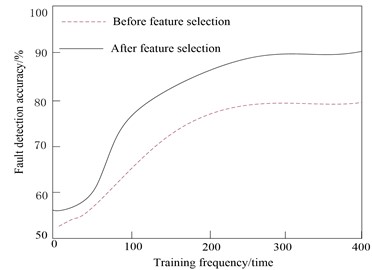
On the basis of extracting the minimum fault feature set, the gradual fault of high-voltage electric energy metering transformer is detected by this method, and the fault detection accuracy is taken as the evaluation index. By comparing and analyzing the difference of fault detection accuracy before and after fault feature reduction, the fault feature selection performance of this method is verified. The experimental results are shown in Fig. 8.
From the analysis of Fig. 8, it can be seen that with the increase of training times, the fault detection accuracy is increasing, and the highest fault detection accuracy of training samples can reach 80 % before fault feature selection. Using this method to select the features of the training sample data of the output signal of the high-voltage electric energy metering transformer, the redundant attribute data in the sample can be effectively eliminated, and the reduced minimum fault feature set is used as the input of the fault detection model, which effectively improves the fault detection effect and improves the fault detection accuracy by 9.5 %. The experimental results show that this method has the ability of fault feature selection, and the reduction of fault attributes has a favorable impact on the improvement of fault detection effect.
Fig. 7Reduced sample data fractal dimension visualization results
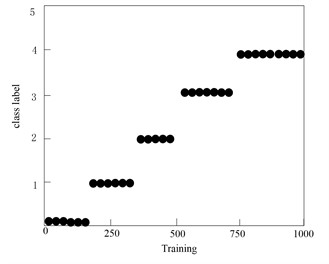
a) Distribution of 5 categories of labels in the sample
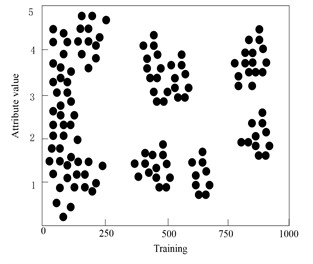
b) Distribution of attribute feature 1
c) Distribution of attribute feature 2
d) Distribution of attribute feature 3
e) Distribution of attribute feature 4
f) Distribution of attribute feature 5
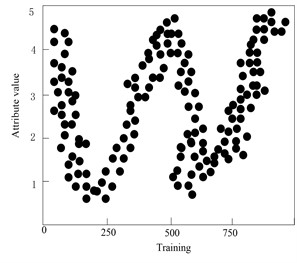
g) Distribution of attribute feature 6
Fig. 8Comparison of fault feature selection performance of the method in this article
The performance of fault detection model has a direct impact on the gradual fault detection effect of high-voltage electric energy metering transformer. In order to analyze the influence of SVM kernel function on the gradual fault detection effect of high-voltage electric energy metering transformer, this paper selects polynomial kernel function, Gaussian radial basis function and sigmoid kernel function, and the comparative analysis results of fault detection effects under different kernel functions are shown in Table 1.
Table 1Comparative analysis of fault detection effects under different kernel functions
Kernel function | Fault detection accuracy / % | Model training time / s |
Polynomial kernel function | 71.14 | 0.106 |
Gaussian radial basis kernel function | 84.64 | 0.0441 |
Sigmoid kernel | 82.14 | 0.0628 |
From the analysis of Table 1, it can be seen that the selection of kernel function has an influence on the gradual fault detection effect of high-voltage electric energy metering transformer. Under polynomial kernel function, the fault detection accuracy is the lowest, only 71.14 %, and it takes more time to complete the fault detection model training. Selecting sigmoid kernel function can effectively improve the fault detection effect of the model, and the fault detection accuracy can be improved by 11 %. Using Gaussian radial basis function, the fault detection accuracy is the highest, which can reach 84.64 %, the model training time is also the shortest, and the fault detection model performance is the most outstanding. Therefore, the SVM classifier in this paper chooses Gaussian radial basis kernel function.
Penalty factor and kernel parameters have great influence on the performance of fault detection model. Kernel parameters can control the shape of the classification hyperplane and determine the distribution of the original data mapped to a high-dimensional space. The larger the value, the fewer support vectors, and the number of support vectors affects the speed of model training. The penalty factor determines the training error of the model. The larger the penalty factor is, the more complicated the model will be. The smaller the parameter is, the less the model will be fitted. The parameters of fault detection model are optimized by this method, and the parameter optimization effect of this method is studied by comparing and analyzing the performance differences of model fault detection under different parameter optimization combinations. The experimental results are shown in Table 2.
From the analysis of Table 2, it can be seen that when the parameters of the fault detection model are optimized by this method, the penalty factor increases with the increase of the penalty factor when the kernel parameters are fixed, and when the value is 10, the fault detection accuracy reaches the maximum value of 92 %, and the model training time is the shortest, only 0.0243 s; When the penalty factor is fixed, the fault detection accuracy first increases and then decreases with the increasing of the kernel parameters. When the kernel parameter is 0.05, the fault detection accuracy is the highest, and the optimal parameter combination is (0.05, 10).
Table 2Performance comparison and analysis of fault detection models under different parameter optimization combinations
Kernel parameter, penalty factor | Fault detection accuracy / % | Model training time / s |
(0.05, 1) | 90 | 0.0674 |
(0.05, 5) | 92 | 0.0274 |
(0.05, 10) | 92 | 0.0243 |
(0.01, 10) | 89 | 0.0812 |
(0.1, 10) | 90.5 | 0.1314 |
(1, 10) | 89.6 | 0.0714 |
(5, 10) | 84.3 | 0.128 |
(10, 10) | 82.4 | 0.1413 |
(20, 10) | 80.7 | 0.1846 |
The experimental results show that this method has the performance of model parameter optimization, and the performance of fault detection model after parameter optimization is effectively improved.
500 samples are randomly selected from the sample data set as test sample data, and the gradual fault of high-voltage electric energy metering transformer is detected by this method. By analyzing the fault detection results, the fault detection performance of this method is verified. The experimental results are shown in Table 3.
Table 3Analysis of fault detection results
Fault type | Quantity / piece | Correct diagnosis / piece | Error diagnosis / piece |
Normal | 80 | 80 | 0 |
H1 | 120 | 118 | 2 |
H2 | 90 | 90 | 0 |
H3 | 150 | 150 | 0 |
H4 | 60 | 60 | 0 |
From the analysis of Table 3, it can be seen that the method in this paper can identify the gradual fault types of high-voltage electric energy metering transformers by fault detection. Normal samples and H2, H3 and H4 fault samples are correctly detected, and there are two false detections in H1 fault samples. The experimental results show that this method has the ability of gradual fault detection of high-voltage electric energy metering transformer, and the fault detection effect is outstanding.
In order to further verify the effectiveness of the proposed method, the proposed method is compared with the method in literature [7] and the method in literature [8]. The test index is fault detection accuracy, and the specific comparison results are shown in Table 4.
Table 4Comparison of fault detection accuracy of different methods / %
Number of iterations | This paper method | Literature [7] method | Literature [8] method |
10 | 96.42 | 86.62 | 84.98 |
20 | 96.35 | 84.25 | 86.26 |
30 | 95.42 | 87.42 | 83.64 |
40 | 94.15 | 89.36 | 84.55 |
50 | 96.47 | 87.15 | 83.64 |
60 | 98.15 | 86.26 | 87.46 |
As can be seen from Table 4, the fault detection accuracy of the proposed method is the highest 98.15 %, and the fault detection accuracy of the method [7] and the method [8] is the highest 89.36 % and 87.46 %, respectively. Compared with the two methods, the fault detection accuracy of the proposed method is higher.
4. Conclusions
Taking the all-fiber current transformer as the experimental object, the fault diagnosis of its output signal sample data is carried out by this method, and the effectiveness of this method is verified by analyzing the ability of fault feature selection, the influencing factors of fault detection model performance and the detection results. The experimental results show that:
1) The method in this paper can reduce the fault attribute features of samples, and determine the minimum fault feature set with six attributes, which improves the fault detection accuracy by 9.5 %.
2) The fault detection model with Gaussian radial basis function, kernel parameter of 0.05 and penalty factor of 10 has the best performance and the shortest training time.
3) The method in this paper can identify the gradual fault type of high-voltage electric energy metering transformer, and the fault detection effect is outstanding.
References
-
N. Marriott, “New efficient ac/dc ma current transformer for electric vehicle charging,” (in Chinese), Electrical engineering, Vol. 402, No. 3, p. 123474, 2021.
-
E. Gulski et al., “Discussion of electrical and thermal aspects of offshore wind farms’ power cables reliability,” Renewable and Sustainable Energy Reviews, Vol. 151, p. 111580, Nov. 2021, https://doi.org/10.1016/j.rser.2021.111580
-
S. Sanati and Y. Alinejad-Beromi, “Avoid current transformer saturation using adjustable switched resistor demagnetization method,” IEEE Transactions on Power Delivery, Vol. 36, No. 1, pp. 92–101, Feb. 2021, https://doi.org/10.1109/tpwrd.2020.2983484
-
J. Gajewski and D. Vališ, “Verification of the technical equipment degradation method using a hybrid reinforcement learning trees-artificial neural network system,” (in Chinese), Tribology International, Vol. 153, p. 106618, Jan. 2021, https://doi.org/10.1016/j.triboint.2020.106618
-
M. Berger, I. Kocar, E. Farantatos, and A. Haddadi, “Modeling of Li-ion battery energy storage systems (BESSs) for grid fault analysis,” Electric Power Systems Research, Vol. 196, p. 107160, Jul. 2021, https://doi.org/10.1016/j.epsr.2021.107160
-
M. Andreev et al., “Development and research of mathematical model of current transformer reproducing magnetic hysteresis based on Preisach theory,” IET Generation, Transmission and Distribution, Vol. 14, No. 14, pp. 2720–2730, May 2020, https://doi.org/10.1049/iet-gtd.2018.6796
-
T. Wang, W. Liu, L. V. Cabrera, P. Wang, X. Wei, and T. Zang, “A novel fault diagnosis method of smart grids based on memory spiking neural systems considering measurement tampering attacks. Information Sciences,” (in Chinese), Information Sciences, Vol. 596, pp. 520–536, 2022.
-
T. N. Nguyen, R. Ponciroli, P. Bruck, T. C. Esselman, J. A. Rigatti, and R. B. Vilim, “A digital twin approach to system-level fault detection and diagnosis for improved equipment health monitoring,” Annals of Nuclear Energy, Vol. 170, p. 109002, Jun. 2022, https://doi.org/10.1016/j.anucene.2022.109002
-
A. Althubaiti, F. Elasha, and J. A. Teixeira, “Fault diagnosis and health management of bearings in rotating equipment based on vibration analysis – a review,” Journal of Vibroengineering, Vol. 24, No. 1, pp. 46–74, Feb. 2022, https://doi.org/10.21595/jve.2021.22100
-
Z. Kazemi, F. Naseri, M. Yazdi, and E. Farjah, “An EKF‐SVM machine learning‐based approach for fault detection and classification in three‐phase power transformers,” (in Chinese), IET Science, Measurement and Technology, Vol. 15, No. 2, pp. 130–142, Jan. 2021, https://doi.org/10.1049/smt2.12015
-
H. A. Illias, K. C. Chan, and H. Mokhlis, “Hybrid feature selection-artificial intelligence-gravitational search algorithm technique for automated transformer fault determination based on dissolved gas analysis,” IET Generation, Transmission and Distribution, Vol. 14, No. 8, pp. 1575–1582, Mar. 2020, https://doi.org/10.1049/iet-gtd.2019.1189
-
M. R. Sardar and M. K. Chakraborty, “Some implicative topological quasi-Boolean algebras and rough set models,” (in Chinese), International Journal of Approximate Reasoning, Vol. 148, pp. 1–22, Sep. 2022, https://doi.org/10.1016/j.ijar.2022.05.008
-
S. Abdullah, M. M. Al‐Shomrani, P. Liu, and S. Ahmad, “A new approach to three-way decisions making based on fractional fuzzy decision-theoretical rough set,” (in Chinese), International Journal of Intelligent Systems, Vol. 37, No. 3, pp. 2428–2457, Dec. 2021, https://doi.org/10.1002/int.22779
-
N. Rehman, A. Ali, and K. Hila, “Note on "tolerance-based intuitionistic fuzzy-rough set approach for attribute reduction",” (in Chinese), Expert Systems with Applications, Vol. 175, No. 8, p. 114869, 2021.
-
K. Vanchinathan, K. R. Valluvan, C. Gnanavel, C. Gokul, and J. R. Albert, “An improved incipient whale optimization algorithm based robust fault detection and diagnosis for sensorless brushless DC motor drive under external disturbances,” International Transactions on Electrical Energy Systems, Vol. 31, No. 12, Dec. 2021, https://doi.org/10.1002/2050-7038.13251
-
A. Campagner, D. Ciucci, and E. Hüllermeier, “Rough set-based feature selection for weakly labeled data,” (in Chinese), International Journal of Approximate Reasoning, Vol. 136, No. 9, pp. 150–167, Sep. 2021, https://doi.org/10.1016/j.ijar.2021.06.005
-
A. Hadrani, K. Guennoun, R. Saadane, and M. Wahbi, “Fuzzy rough sets: Survey and proposal of an enhanced knowledge representation model based on automatic noisy sample detection,” Cognitive Systems Research, Vol. 64, No. 12, pp. 37–56, Dec. 2020, https://doi.org/10.1016/j.cogsys.2020.05.001
-
M. H. Qais, H. M. Hasanien, and S. Alghuwainem, “Whale optimization algorithm-based Sugeno fuzzy logic controller for fault ride-through improvement of grid-connected variable speed wind generators,” Engineering Applications of Artificial Intelligence, Vol. 87, No. 6, p. 103328, Jan. 2020, https://doi.org/10.1016/j.engappai.2019.103328
-
K. Ganesh and B. Vani, “An efficient COVID-19 pandemic survival analysis to compare random forest and support vector machine for classifying performance in censored data,” (in Chinese), ECS Transactions, Vol. 107, No. 1, pp. 12993–13004, Apr. 2022, https://doi.org/10.1149/10701.12993ecst
-
S. P. Singh and U. C. Jaiswal, “Audio classification using grasshopper‐ride optimization algorithm‐based support vector machine,” IET Circuits, Devices and Systems, Vol. 15, No. 5, pp. 434–447, Mar. 2021, https://doi.org/10.1049/cds2.12039
About this article

The authors have not disclosed any funding.
The datasets generated during and/or analyzed during the current study are available from the corresponding author on reasonable request.
Chunguang Wang, Zhiwu Wu and Tianfu Huang wrote the main manuscript text. Xiang Wu and Hanbin Huang prepared all data, figures and tables. All authors reviewed the manuscript.
The authors declare that they have no conflict of interest.
