Abstract
An improved theoretical calculation method was proposed to determine the transverse load distribution of airport and highway bridges under heavy loads using the rigid-joint girder (RJG) method. The effects of torsion, distortion, and vertical inclination of the adjacent box girder joints under an eccentric heavy load were considered. The coefficients and influence lines of a taxiway bridge and a highway bridge were calculated using the proposed method, the RJG method, and the modified RJG methods. The accuracies of the three methods were evaluated by the refined finite element model, and the cosine similarity and peak deviation rate were used as quantitative indices. The results showed that the cosine similarity obtained from the proposed method for the taxiway bridge was 0.996 compared with the finite element method (FEM). The maximum peak deviation rate of the transverse load distribution coefficient for the proposed method was 14.88 % and obviously lower than 34.74 % for the RJG method. For the highway bridge, the cosine similarity of the influence line derived from the proposed method was 0.995, and the maximum peak deviation rate of the transverse load distribution coefficient for the proposed method was 6.66 % and lower than 16.14 % for the RJG method. The results indicate that the proposed method can be used to calculate the transverse load distribution of wide box girder bridges accurately and efficiently.
Highlights
- An improved theoretical calculation method was proposed to determine the transverse load distribution of bridges under heavy loads.
- A reasonable numerical model was developed considering material and contact nonlinear behaviors based on the ABAQUS.
- The proposed method was applied to airport and highway bridges.
1. Introduction
Due to technological advances in transportation, a growing trend of the construction of wide highway bridges and airport bridges is occurring. These bridges experience significant bidirectional forces and spatial effects; thus, the accurate and efficient calculation of their transverse forces is critical in their design. The transverse load distribution coefficient is an essential parameter in the design of bridges. It is required to calculate the internal force responses of the main girders by transforming a spatial problem into a planar one.
Although viable methods exist to calculate the moment and shear demands, such as the finite-element method (FEM), bridge design engineers typically prefer to use theoretical analysis methods or the live load distribution factors (LLDF) equation based on the American Association of State Highway and Transportation Officials (AASHTO) Load and Resistance Factor Design (LRFD) specifications [1]. Three theoretical analysis methods are widely used: the eccentric compression, rigid-joint girder (RJG), and Guyon-Massonnet (G-M) methods. Scholars have improved traditional theoretical methods to simplify them and obtain more accurate results using comparative analysis of tests and FEM for different bridge types with complex mechanical characteristics.
Zhao [2] conducted a comparative analysis of the transverse load distribution coefficient obtained from on-site experiments, finite element simulations, and the AASHTO LRFD equation. The results indicated that the AASHTO LRFD equation provided more conservative results than other methods. Tevfik [3] evaluated the applicability of the AASHTO equation to a wide-flange beam bridge in Texas and considered the cantilever length and vehicle distance from the bridge edge to perform adjustments. Kong [4] improved the transverse load distribution calculation for steel-concrete composite box girder bridges using the AASHTO equation. They incorporated the main girder deformation parameters from the RJG method and determined the effect of their weights on the transverse load distribution coefficient. Hu [5] analyzed precast box girder bridges with transverse post-tensioning tendons and introduced a reduction coefficient into the force equation to account for the initial stress reduction of the transverse post-tensioning tendons. Amin [6] introduced bending and torsional parameters using a harmonic series to calculate the transverse load distribution and verified the results’ accuracy through finite element simulations. Qian [7] utilized the RJG method and considered the distortional displacement at the corner points of small box girders with straight webs. Zhang [8] modified the RJG method based on the conversion section method by combining the flexural and torsional stiffness of large cantilever prestressed composite deck slabs in the longitudinal direction of the pickets. Yu [9] considered the constraints of the torsional effects of the main girder and the wing slab of the box girder in calculating the flexibility coefficient matrix. Ma [10] derived a theoretical equation for the transverse load distribution coefficient based on the RJG method for single-box, multi-chamber waveform steel web box girders and tested its accuracy by FEM and single-point loading tests. Xiang [11] introduced an interface slip effect parameter to modify the transverse load distribution calculation method for steel-concrete box girder bridges. They conducted a comparative study of narrow and wide bridges and found that the RJG method with the slip correction was applicable to wide bridges. The eccentric compression method was more suitable for narrow bridges. Zhong [12] used the eccentric compression method, elastic mechanics, and contact theories to calculate the transverse load distribution coefficient of simply supported composite beams after joint reinforcement. Wang [13] compared girder bridges with orthotropic plates and proposed an analytical method to obtain the transverse load distribution based on plate theory and the G-M method. Numerical simulations demonstrated that the proposed method had high accuracy and applicability. Li [14] investigated an in-service assembled bridge and introduced a main girder damage discount factor into the equation to calculate the transverse load distribution coefficient based on the G-M method. They considered the main girder damage and utilized multiple nonlinear regression analysis.
Various methodological modifications and comparative studies have been carried out to perform theoretical analyses of the transverse load distribution of small- and medium-span highway bridges. The eccentric compression and RJG methods are widely applicable to box girder bridges, and the torsion and distortion effects of the main girders of wide bridges are significantly increased under heavy loads. However, existing studies have not considered the structural torsion and distortion effects under eccentric loads. In addition, the design of taxiway bridges bearing aircraft loads is based on the same method as that of highway bridges, ignoring the joint effects of torsion and distortion. Therefore, an accurate assessment of the effects of torsion and distortion of wide taxiway bridges and highway box girder bridges subjected to heavy loads on the transverse load distribution is required. We conduct a theoretical analysis of the effects of torsion and distortion of box girder bridges on the transverse load distribution coefficient using the RJG method. Torsion and distortion parameters are incorporated into the force matrix equation according to the relationship between force and deformation. An improved method to calculate the transverse load distribution is proposed. It considers the effects of torsion, distortion, and vertical inclination of adjacent box girder joints of wide bridges under eccentric heavy loads. The accuracies of the RJG method, two modified RJG methods, and the proposed method are quantified in a case study of an airport taxiway bridge and a wide highway box girder bridge using FEM and the cosine similarity and peak deviation rate as evaluation indices.
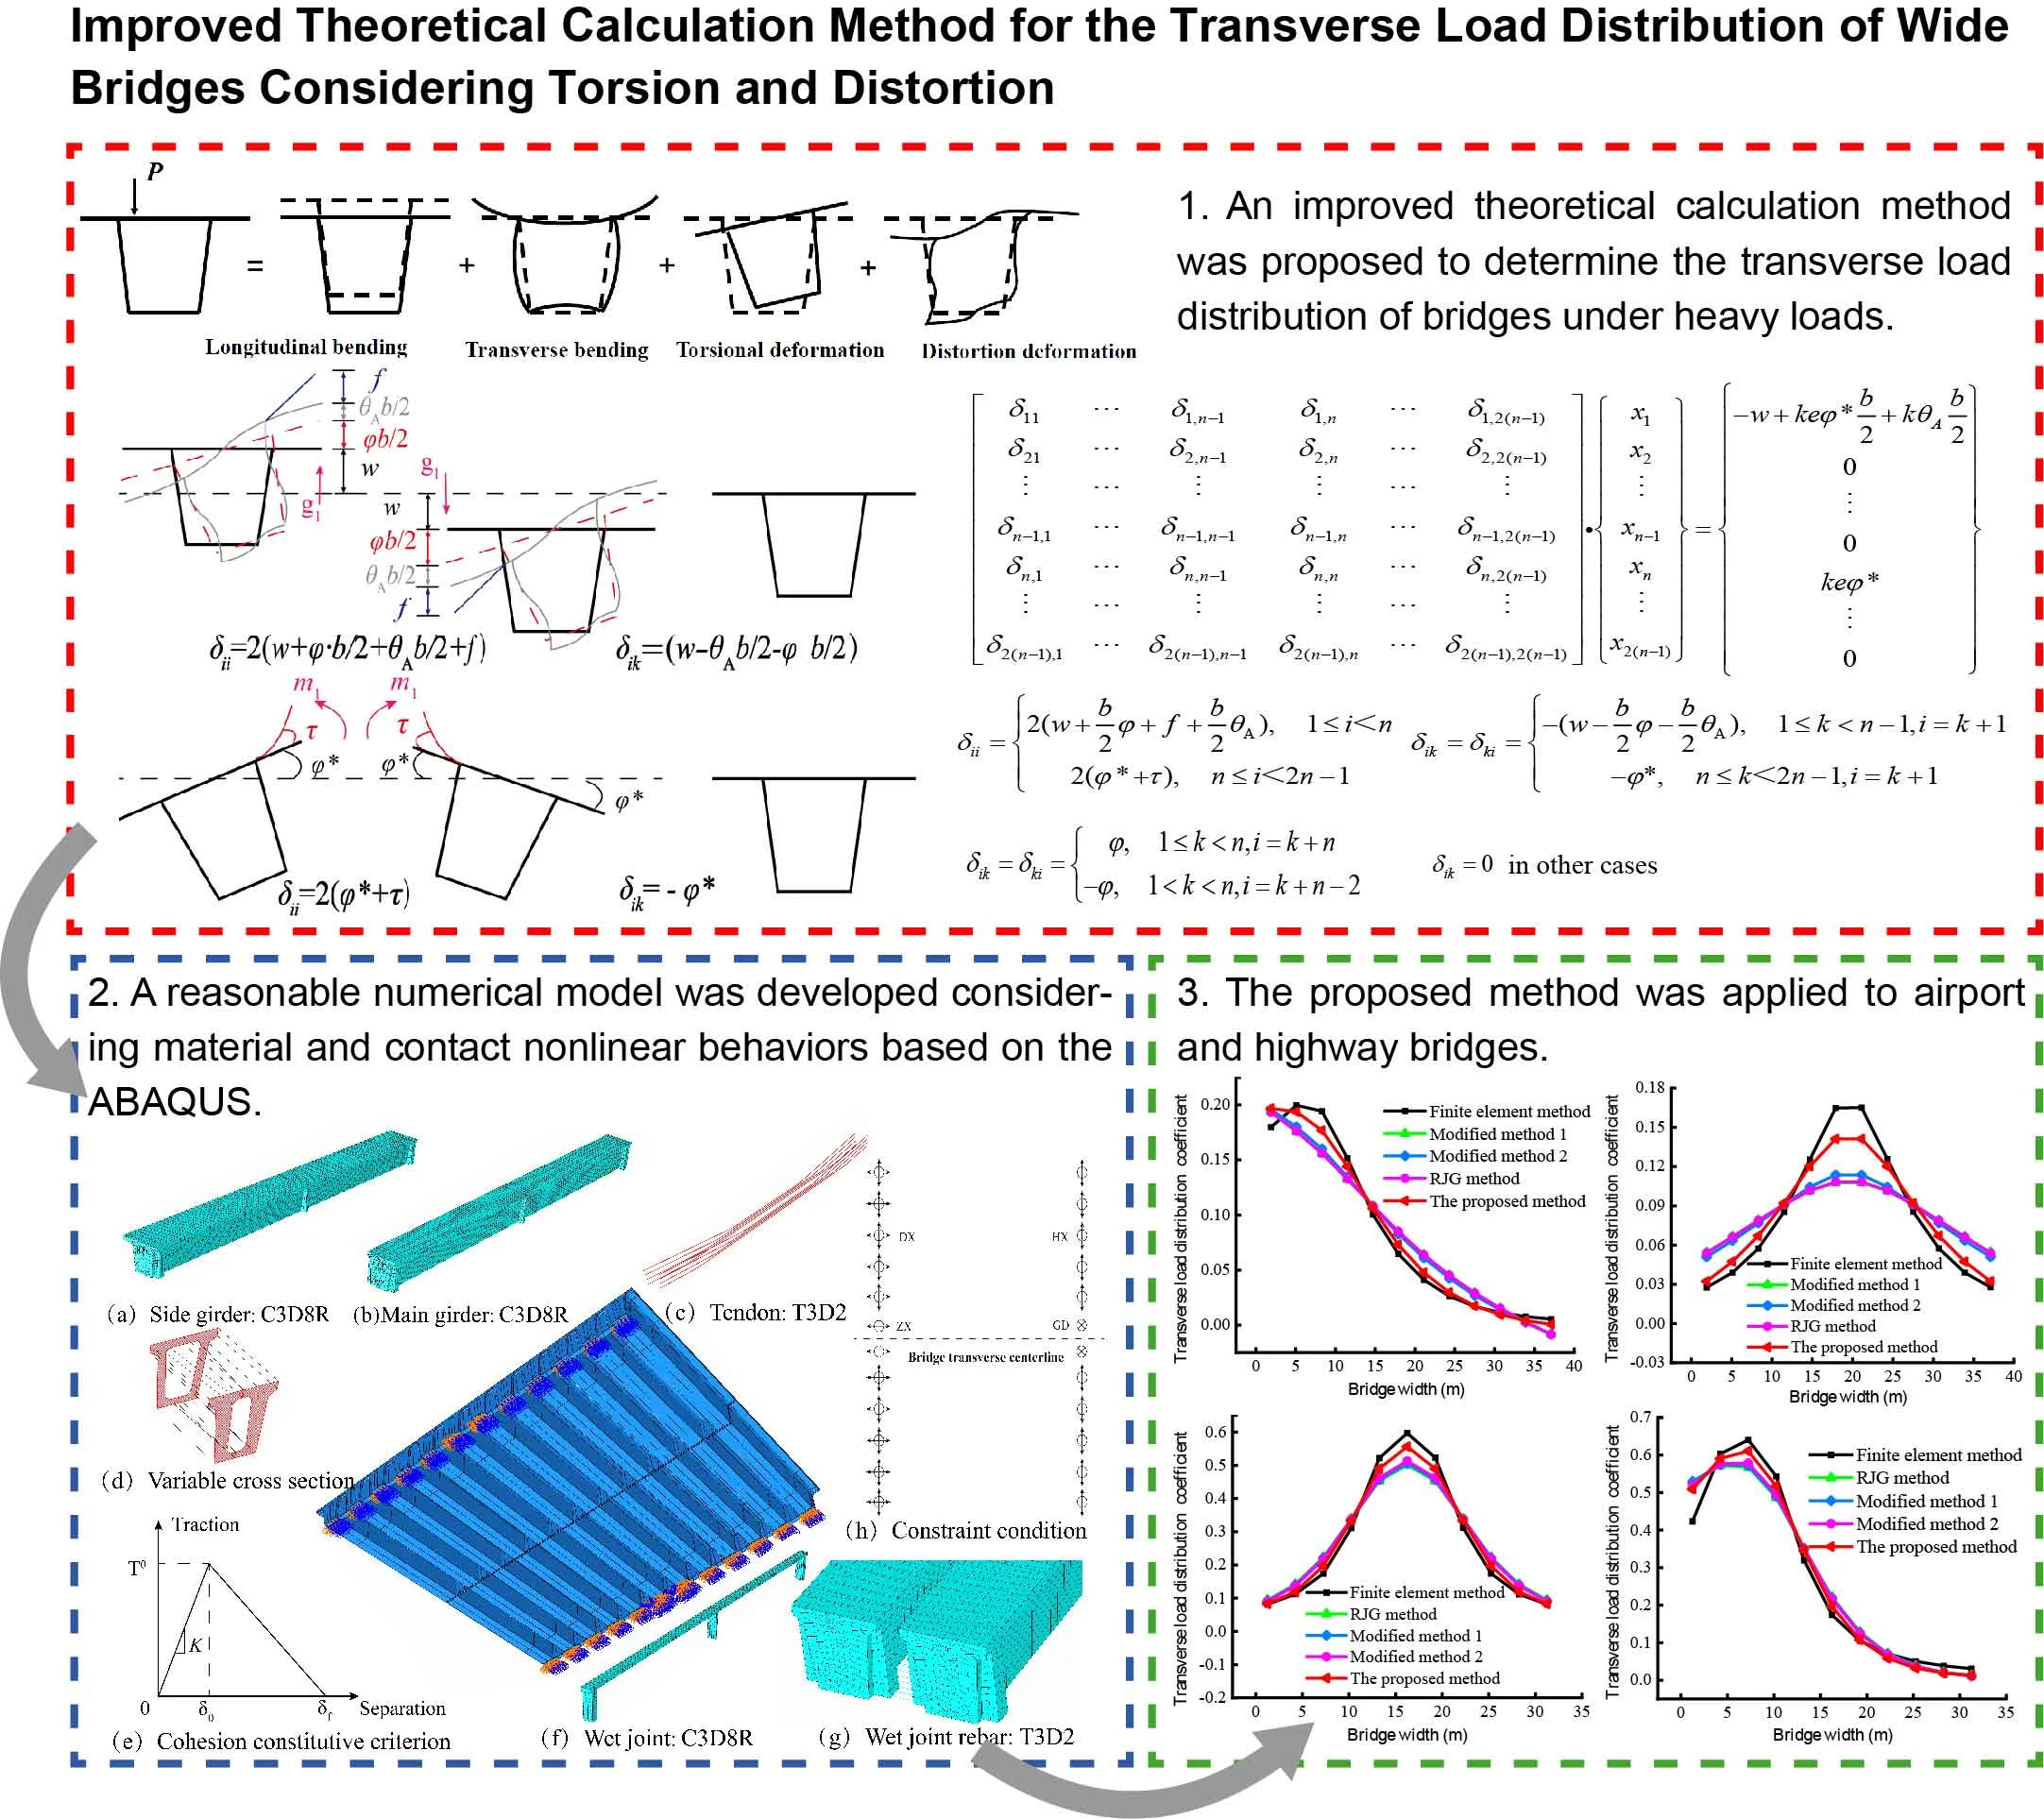
2. Calculation principle of torsion and distortion of box girder
2.1. Analysis of mechanical characteristics of a box girder under an eccentric load
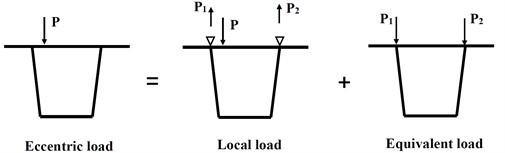
The primary loads sustained by thin-walled concrete box girders comprise constant loads and live loads. The latter is typically an eccentric load, causing longitudinal bending, transverse bending, torsion, and distortion deformation of the box girder. The complex deformations can be simplified through decomposition. Fig. 1 illustrates the decomposition of the deformation, and Fig. 2 depicts the load decomposition. As shown in Fig. 2(a), the eccentric load can be decomposed into local and equivalent loads, and the latter can be decomposed into symmetrical and asymmetric loads (Fig. 2(b)). As displayed in Fig. 2(c), the asymmetric load can be divided into a torsion load with rigid peripheral deformation and a distortion load with self-equilibrium [15].
Fig. 1Decomposition of box girder deformation
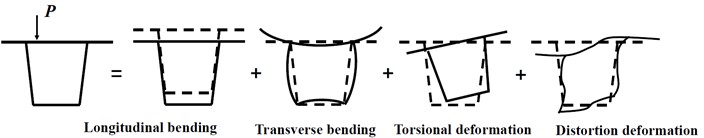
Fig. 2Decomposition and equivalence of an eccentric load
a) Eccentric load decomposition
b) Equivalent load decomposition
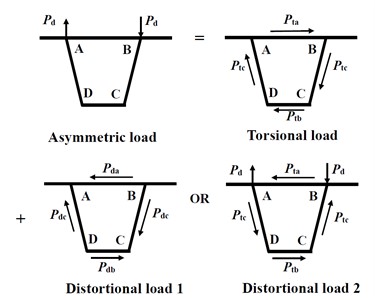
c) Asymmetric load decomposition
Simultaneous torsion and distortion occur when the top slab of a box girder is subjected to vertical eccentric loads, particularly heavy loads [16]. This distinctive deformation characteristic has significant implications, especially for wide-span taxiway bridges in airports and wide highway box girder bridges. Hence, it is imperative to consider the individual effects of these phenomena during the mechanical analysis of the structures.
2.2. Torsion
When a uniformly distributed torque is loaded on the axis of a simply supported girder, the differential equation can be obtained according to the torsion theory of the girder, as shown in Eq. (1):
where is the shear modulus, is the torsional moment of inertia of the box girder section and is the torsional angle acceleration of the main girder.
The torsion angle equation can be obtained by integrating Eq. (1) step by step and solving the integral constant based on the boundary condition of the simply supported girder (considering the torque as the half-wave sinusoidal load as an example):
where is the amplitude of the half-wave sinusoidal load, is the distance between the center lines of adjacent box girders (hereafter referred to as “girder spacing”), and is the span of a simply supported girder bridge.
Without considering the deflection of the cantilever, the torsion angles of the main girder and the joint end are the same per unit torque. From , the torsion angle of the main girder caused by the unit torque at the joint can be obtained by Eq. (3):
Therefore, when the half-wave sinusoidal load is loaded at the corner of the box girder [9], the vertical displacement at the joint caused by the torsion of the box girder is:
where is the distance from the corner of the box girder to the central axis, , and is the distance from the flange of the box girder to half of the wet joint. The size of the box girder is shown in Fig. 3(a).
2.3. Distortion
The static method is used to derive the distortion deflection at the corner of the box girder with an inclined web and the vertical inclination angle of the adjacent joints caused by the distortion. The bottom plate of the box girder frame is cut from the midpoint. Thus, this structure is statically indeterminate, as shown in Fig. 3(b). An antisymmetric redundant shear force occurs at the midpoint [15]. The force method equation is obtained:
where is the flexural rigidity per unit length of each plate, is the elastic modulus; is the Poisson’s Ratio, , , and are the dimensions of the box girder, and is the thickness of the plate. The girder spacing .
The frame moments of the box girder based on the internal shear force are shown in Figs. 3(b)-(d). Graph multiplication is used to calculate the distortion deflection of the box girder corner per unit load:
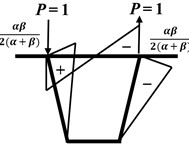
As shown in the distortion deformation diagram of the box girder in Fig. 4, the vertical inclination angle of the adjacent joint resulting from the distortion can be determined:
Fig. 3Schematic diagram of graph multiplication for the box girder
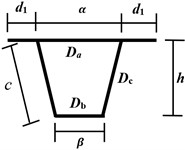
a) Box girder size
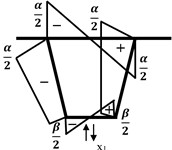
b) M1 graph
c) Mp graph
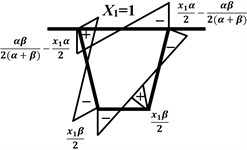
d) M = X1M1 + Mp graph
Fig. 4Distortion deformation of the box girder
3. Improved theoretical calculation method for the transverse load distribution considering torsion and distortion of the girder
3.1. Transverse load distribution derived from the RJG method
3.1.1. Basic assumptions
The following assumptions are made:
(1) The wet joint connection between the main girders is a rigid connection, and only the vertical shear force and the transverse redundant moment are transmitted at the joint.
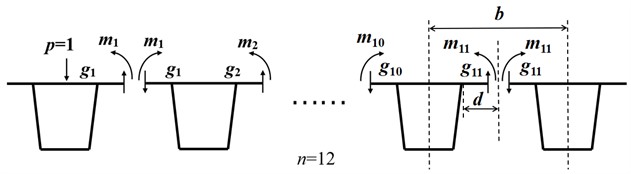
(2) The applied load is approximately a half-wave sinusoidal load , which is distributed in the bridge’s longitudinal direction. It acts on the center line of the box girder and the left and right corners of the section, as shown in Fig. 5 (the loading of the No. 1 girder of the bridge composed of 12 box girders is used as an example, denotes the number of girders).
Fig. 5Load applied to the box girder using the RJG method
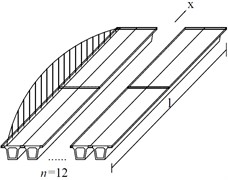
a) Load on the left corner
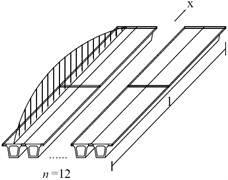
b) Load on the center line
c) Load on the right corner
3.1.2. Establishment of the force equation
When the half-wave sinusoidal load acts on the axis of each girder, a cut is performed on the midline of the wet joints of each box girder. At each joint, a sinusoidal redundant force element is applied (where represents the shear force, and represents the moment). The diagram of the force analysis is shown in Fig. 6. The vertical displacement of two adjacent girders at the joint is zero to meet the deformation compatibility assumption. The matrix equation is defined as follows:
where:
where is the flexibility coefficient of the redundant element, representing the relative vertical displacement of the redundant element 1 at joint , and is the vertical displacement coefficient of the external load at joint .
Fig. 6Diagram of the force analysis
3.2. Calculation and correction of the coefficient matrix
A parameter is introduced to improve the simulation accuracy of the loading conditions of the box girder cross-sections. This parameter has values of 1, –1, and 0 when a unit half-wave sinusoidal load is applied at the left corner, right corner, and center line, respectively.
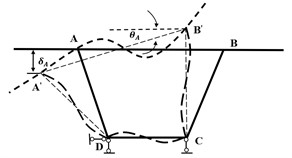
The vertical displacement (Eq. (13)) at the adjacent joints caused by the torsion of the box girder when the load acts on the corner point is used as the torsion correction parameter. The vertical deformation (Eq. (14)) and the joint inclination angle (Eq. (8)) caused by the distortion are used as the distortion correction parameters:
Fig. 7Deformation of the box girder
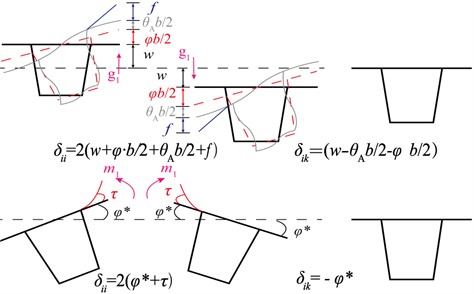
According to the relationship between force and deformation, the coefficients of the matrix equation are determined considering the effects of torsion and distortion (Fig. 7). The correction parameters are incorporated into the matrix equation coefficient . A positive value is assigned when the displacement and redundant elements are consistent, and a negative value is assigned otherwise. Eqs. (9)-(14) are used to calculate the resulting values:
The flexibility coefficients of the joint shear forces and the moments’ redundant elements are modified with the torsion and distortion correction parameters (Eqs. (16)-(17)):
where , , and are the peak values of the mid-span vertical deflection, mid-span vertical torsion angle, and flange vertical deflection, respectively, and and are the main girder torsion angle and the local torsion angle of the wing plate caused by the unit moment at the end of the joint, respectively.
3.3. Regularization equation of statically indeterminate internal force
The matrix equation is regularized by dividing the coefficients and by , as described in Section 2.2, resulting in , , and . The following expressions are obtained after substituting these values into the equations for the girder deflection and torsional angle :
where . The flexibility coefficients of the joint shear forces and moments are defined in Eqs. (16)-(22), assuming that the lower rows of Eq. (10) are multiplied by /2, (1 ≤ ), and , ():
The redundant elements of the simplified regularization equation and the displacement coefficient caused by the external load can be expressed as follows:
The excess vertical shear forces at each joint, accounting for the effects of torsion and distortion, can be determined by solving for in the force method equation, facilitating the calculation of the distributed reactions on the main girders due to vertical loading. The expressions of the reaction forces of the main girders are obtained, assuming that a unit load is applied to the No. 1 main girder:
Similarly, the main girder reaction forces of the main girders when the unit load acts on the No. 2-12 girders can be calculated.
When the bridge is symmetrical in the transverse direction, Eq. (30) can be used to calculate the vertical values of the influence lines of the girders. The vertical values are obtained based on the reaction forces of the six main girders:
4. Verification of the proposed method
A taxiway bridge and a wide highway bridge were used in a case study to validate the proposed method’s rationality and accuracy. The influence lines of the transverse load distribution and the transverse load distribution coefficients under unfavorable load conditions were calculated. The calculation accuracy of the RJG method, two modified RJG methods, and the proposed method were quantified using the cosine similarity and peak deviation rate as evaluation indicators. The simulation results of the FEM were used as the benchmark. This strategy provides a robust evaluation of the proposed method and demonstrates its potential applicability in engineering practice.
4.1. Case study of a taxiway bridge
4.1.1. Engineering background
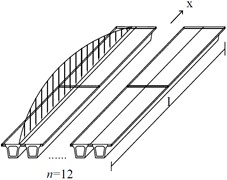
The taxiway bridge at a Southern Chinese airport is constructed with prefabricated elements and comprises two simply supported prestressed reinforced concrete girder bridges. The span length and width of the bridge are 35.0 m and 39.0 m, respectively. The superstructure of the bridge is comprised of 12 prestressed concrete box girders interconnected using wet joints after pouring. Each girder has a height of 250 cm; the middle girder has a width of 250 cm, and the side girder has a width of 315 cm. The width of the wet joint is 70 cm. The bridge is equipped with two end crossbeams and a middle transverse diaphragm. The mid-span section of the bridge is illustrated in Fig. 8.
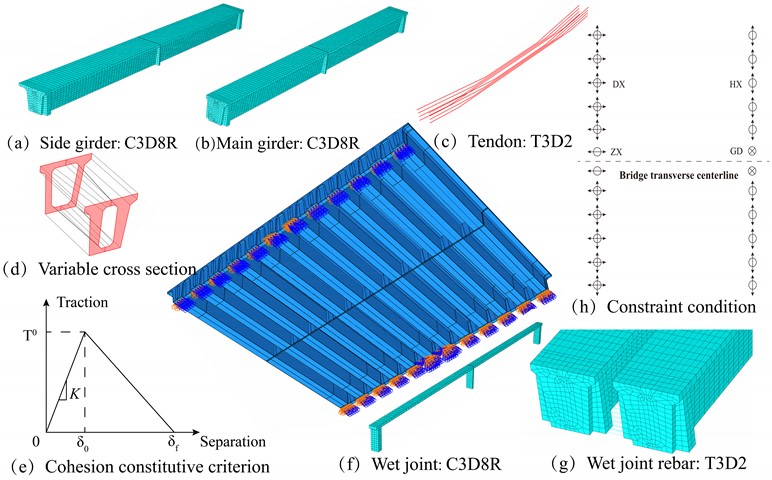
4.1.2. Refined model establishment and load application method
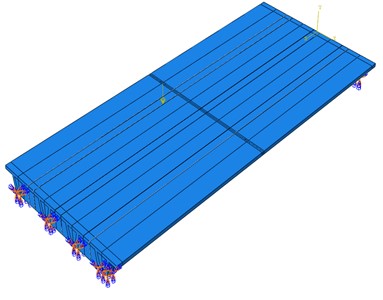
A refined numerical model of the bridge’s main girder was established using the ABAQUS platform. The girders, wet joints, and transverse diaphragm were simulated using three-dimensional solid reduced-integration elements (C3D8R). The nonlinear contact between the main girder and the wet joint was modeled by surface-based cohesive behavior. The constitutive relationship of the cohesive force is described using the traction-separation criterion [17-18]. Truss elements (T3D2) were utilized to simulate the non-bonded post-tensioning tendons and joint reinforcement steel bars. Prestressed tendon tensioning requires timely grouting and anchoring. This analysis ignored the bonding and slip that might occur between the prestressed tendons and the grouting materials, as well as the friction between the grouting material and the duct. The prefabricated box girders had prestressed tendons, and the initial stress method was utilized to simulate prestressing. The degrees of freedom corresponding to the node in the corresponding direction were constrained according to the supports at both ends of the box girder, as shown in Fig. 9.
Fig. 8Taxiway bridge mid-span section (Unit: cm)
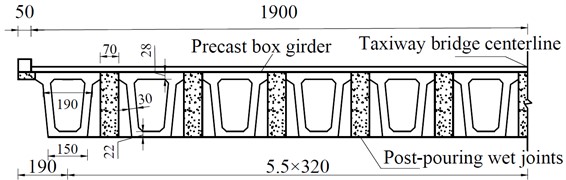
Fig. 9Refined numerical model of the taxiway bridge girders
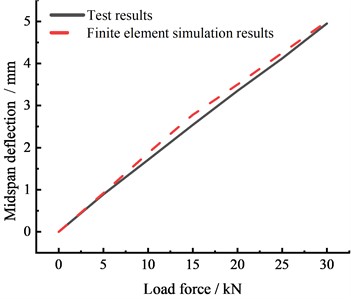
A refined finite element model of the main girder described in [19] was developed using the same numerical simulation method to verify the accuracy of the modeling method (Fig. 10). The bridge dimensions can be found in [19]. The load-displacement curves obtained from the experiment and the finite element model for the No. 1 girder are shown in Fig. 10(b). The results are in good agreement. Table 1 lists the deviations between the simulation and experimental results. The deviations of deflection do not exceed 10 % at different load levels, indicating that the simulation method can accurately simulate the mechanical properties of the connection between multiple small box girders and wet joints. Thus, the method can be used for further analysis.
The aircraft load is applied as a surface force using the DLOAD subroutine. The design aircraft load is based on the requirements of the “Aerodrome technical standards” (MH 5001-2021) and the “Guidance for design of aircraft bridge in civil airport” (MH/T 5063-2023) for E-class aircraft. A Boeing 747-400 was selected. It has a maximum axle load of 950 kN, a coefficient of impact of 0.45, and two sets of wheels as the landing gear, as shown in Fig. 11.
Fig. 10Verification of numerical simulation method
a) Refined numerical model of [19]
b) Comparison of load-displacement curves
Table 1Deviation in the midspan deflection of the No. 1 main girder for different loads obtained from the experiment and the simulation
Load level (kN) | Test results (mm) | Simulation result (mm) | Relative deviation (%) |
5 | 0.89 | 0.91 | 2.25 |
10 | 1.71 | 1.87 | 9.36 |
15 | 2.54 | 2.78 | 9.45 |
20 | 3.35 | 3.50 | 4.48 |
25 | 4.12 | 4.25 | 3.16 |
30 | 4.95 | 5.00 | 1.01 |
Fig. 11Schematic diagram of loading (Unit: m)
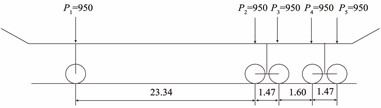
a) Elevation
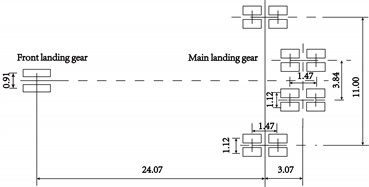
b) Plan
The transverse load distribution influence line was calculated by applying a half-wave sinusoidal load, and the transverse distribution coefficient was calculated (Fig. 11). The vertical value of the influence line [20] and the transverse load distribution coefficient [11, 21] was calculated as followed based on the deflection:
where represents the number of lanes of the highway bridge. When the bridge load is an airplane, it is recommended to use 1 for . and , respectively, represent the mid-span deflection used to calculate the influence line’s vertical values and the transverse load distribution coefficient.
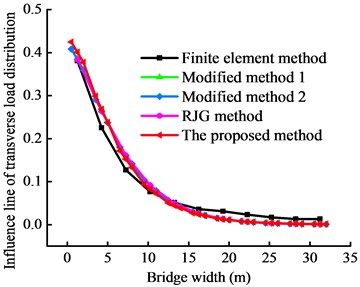
4.1.3. Comparison and validation
Fig. 12 shows the transverse load distribution influence lines obtained from the finite element simulation and the proposed method. Due to the transverse symmetry of the superstructure, only the figures for the side girder (No. 1 girder) and the middle girder (No. 6 girder) are presented. The results demonstrate that the highest vertical value occurs on the main girder bearing the half-wave sinusoidal load. The value decreases toward the adjacent girders, with consistent trends for all girders. The RJG method, modified RJG method 1 (which considers the distortion and displacement of the box girder), and modified RJG method 2 (which considers the box girder’s torsional properties) are compared with the finite element simulation results. The different methods have similar influence line trends as the finite element simulation.
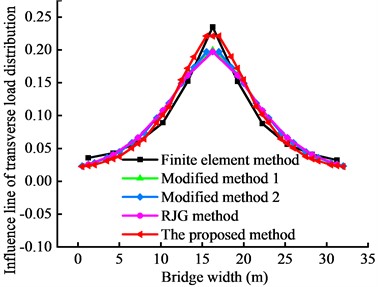
Fig. 12Transverse load distribution influence lines obtained by different methods
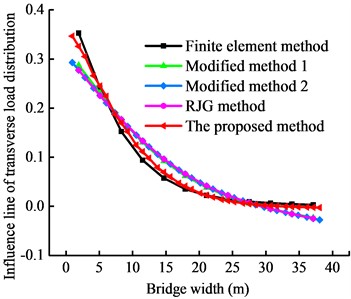
a) No. 1 main girder
b) No. 6 main girder
The cosine similarity [22] is used as an evaluation indicator of the transverse load distribution influence line (Table 2). The results demonstrate that the RJG method and its modifications have relatively low cosine similarity values because the deformation of the box girder under heavy loads is not considered. The values are lower than 0.978, with a minimum of 0.952. In contrast, the proposed method considers the influence of torsion and distortion effects under heavy loads and the displacement caused by the main girder’s distortion and inclination. It has a cosine similarity of 0.996, indicating a higher calculation accuracy than the RJG method and its modifications.
Table 2Cosine similarity of transverse load distribution influence lines
Number of girders | RJG method | Modified method 1 | Modified method 2 | The proposed method |
No. 1 | 0.973 | 0.978 | 0.973 | 0.997 |
No. 6 | 0.952 | 0.964 | 0.953 | 0.996 |
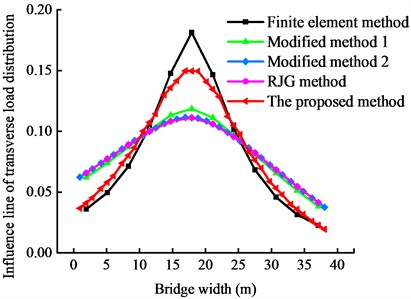
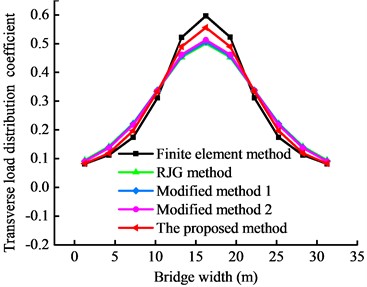
Fig. 13 displays the transverse load distribution coefficients obtained from the different methods. The results indicate that the transverse load distribution coefficient peaks at the primary girder at the loading position for all four calculation methods and exhibits the same trend as the FEM results. The coefficients exhibit a symmetrical distribution for central loading and decrease from the loading position toward the other side girder.
Table 3 presents the transverse load distribution coefficients and deviation rates of different methods and the FEM for the No. 1-6 girders under a load of the aircraft’s front wheel. To accurately evaluate the fitting performance, the peak deviation rate was used as a local error evaluation index in addition to the cosine similarity (Table 4).
Fig. 13Transverse load distribution coefficients obtained from different methods
a) Side loading of front wheel set
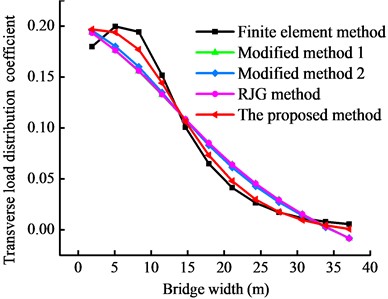
b) Side loading of rear wheel set
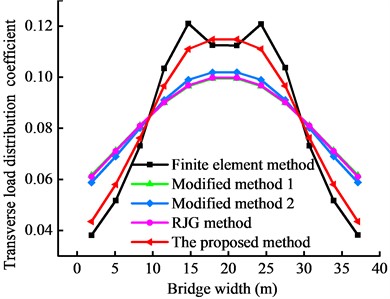
c) Central loading of front wheel set
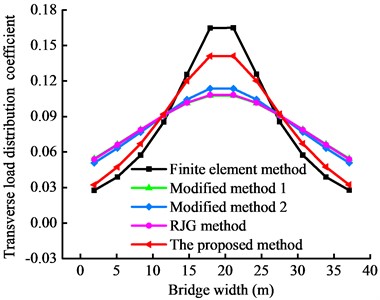
d) Central loading of rear wheel set
The results in Tables 3 and 4 show that the proposed method outperforms the RJG method and the two modified methods in determining the transverse load distribution coefficients for landing gear loads applied to the center and the side of the bridge’s mid-span. Specifically, when the front wheel load of the aircraft’s landing gear is applied to the center, the peak deviation rate of the transverse load distribution coefficients of the No. 6 girder is significantly lower for the proposed method (0.89 %) than for the RJG method (11.59 %) and the modified methods (9.46 % and 11.33 %). For side loading of the No. 1 girder, the peak deviation rates are 12.82 % (RJG method), 11.29 % and 13.00 % (modified methods), and 7.56 % (proposed method). For loading by the aircraft’s rear wheel, the peak deviation rates of the transverse load distribution coefficients obtained from the RJG method and the two modified methods do not exceed 34.74 %. After accounting for the joint displacement due to torsion, distortion, and vertical inclination of the adjacent joints of box girders, the peak deviation rate is 14.88 % for the proposed method. Additionally, the lowest cosine similarity values are 0.949 for the RJG method and 0.993 for the proposed method. These results indicate that the proposed method has higher accuracy than the other methods for estimating the transverse load distribution of taxiway bridges and other wide bridges.
4.2. Case study of a highway bridge
4.2.1. Engineering background
The proposed method can enhance the precision of calculating the transverse load distribution of a taxiway bridge, as outlined in Section 4.1. We analyzed and verified the method’s results for a simply supported girder bridge with a width-span ratio of 1.3 to assess its suitability for wide highway bridges. The bridge has a width of 32.5 m and a span of 25.0 m and consists of 11 prefabricated post-tensioned concrete inclined web box girders connected via cast-in situ wet joints. The girders are spaced 3.0 m apart, with a wet joint width of 80 cm and have only end crossbeams and no internal crossbeams. The structural details of the bridge have been described in [23]. The modeling approach for the refined numerical bridge model was the same as in Section 4.1.2. The vehicle load was applied as a surface force using the DLOAD subroutine, with an axle load of 156 kN. The impact factor was determined according to the General Specifications for the Design of Highway Bridges and Culverts (JTG D60-2015) and was based on the bridge’s fundamental frequency of 0.3 at the mid-span. The bridge has three traffic lanes, and biased and centered loads were applied.
Table 3Transverse load distribution coefficients and deviation rates obtained from different methods
Condition | Number of girders | Distance from bridge edge (m) | Results of finite element calculation | Transverse load distribution coefficient | Deviation rate / % | ||||||
RJG method | Modified method 1 | Modified method 2 | Proposed method | RJG method | Modified method 1 | Modified method 2 | Proposed method | ||||
Load in the center | No. 1 | 1.9 | 0.0381 | 0.0616 | 0.0588 | 0.0611 | 0.0436 | 61.51 | 54.17 | 60.20 | 14.30 |
No. 2 | 5.1 | 0.0517 | 0.0713 | 0.0690 | 0.0711 | 0.0582 | 37.96 | 33.51 | 37.58 | 12.58 | |
No. 3 | 8.3 | 0.0731 | 0.0811 | 0.0801 | 0.0810 | 0.0765 | 10.91 | 9.55 | 10.78 | 4.61 | |
No. 4 | 11.5 | 0.1034 | 0.0900 | 0.0911 | 0.0902 | 0.0973 | 12.98 | 11.92 | 12.79 | 5.93 | |
No. 5 | 14.7 | 0.1211 | 0.0965 | 0.0990 | 0.0968 | 0.1109 | 20.29 | 18.22 | 20.04 | 8.41 | |
No. 6 | 17.9 | 0.1126 | 0.0995 | 0.1019 | 0.0998 | 0.1136 | 11.59 | 9.46 | 11.33 | 0.89 | |
Load on the side | No. 1 | 1.9 | 0.2288 | 0.1995 | 0.2030 | 0.1991 | 0.2115 | 12.82 | 11.29 | 13.00 | 7.56 |
No. 2 | 5.1 | 0.1780 | 0.1746 | 0.1765 | 0.1744 | 0.1795 | 1.93 | 0.86 | 2.04 | 0.83 | |
No. 3 | 8.3 | 0.1454 | 0.1508 | 0.1519 | 0.1509 | 0.1531 | 3.74 | 4.49 | 3.80 | 5.32 | |
No. 4 | 11.5 | 0.1351 | 0.1282 | 0.1296 | 0.1285 | 0.1335 | 5.07 | 4.04 | 4.85 | 1.18 | |
No. 5 | 14.7 | 0.1105 | 0.1059 | 0.1066 | 0.1063 | 0.1090 | 4.12 | 3.49 | 3.76 | 1.35 | |
No. 6 | 17.9 | 0.0740 | 0.0842 | 0.0835 | 0.0844 | 0.0794 | 13.80 | 12.85 | 14.07 | 7.35 | |
Table 4Cosine similarity and peak deviation rates of transverse load distribution coefficients
Condition | Calculation method | Loading of landing gear front wheel set | Loading of landing gear hind wheel set | ||
Cosine similarity | Peak deviation rate / % | Cosine similarity | Peak deviation rate / % | ||
Load in the center | RJG method | 0.980 | 20.29 | 0.949 | 34.74 |
Modified method 1 | 0.984 | 18.22 | 0.960 | 31.16 | |
Modified method 2 | 0.980 | 20.04 | 0.950 | 34.37 | |
Proposed method | 0.998 | 8.41 | 0.993 | 14.88 | |
Load on the side | RJG method | 0.994 | 12.82 | 0.986 | 11.85 |
Modified method 1 | 0.995 | 11.29 | 0.989 | 9.80 | |
Modified method 2 | 0.994 | 13.00 | 0.986 | 11.80 | |
Proposed method | 0.998 | 7.56 | 0.997 | 3.49 | |
4.2.2. Comparison and validation
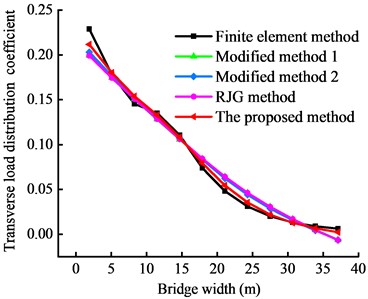
The refined FEM was used to calculate the transverse load distribution influence lines and coefficients of the main girders of the bridge, and the results were compared with those of the four theoretical methods. The transverse load distribution influence lines and their cosine similarity obtained from different methods are presented in Fig. 14 and Table 5, respectively. The influence lines are consistent with those of the taxiway bridge. The results of the four theoretical methods are in good agreement with the finite element simulation results, and the trends of the cosine similarities do not exhibit significant differences. However, the proposed method exhibits a higher accuracy than the RJG method and its modifications. The cosine similarities of the side and middle girders are 0.995 and 0.996, respectively. These results indicate the higher accuracy of the proposed method for estimating the transverse load distribution.
Fig. 14Transverse load distribution influence lines of the highway bridge obtained from different methods
a) No. 1 main girder
b) No. 6 main girder
Table 5Cosine similarity of transverse load distribution influence lines of the highway bridge
Number of girders | RJG method | Modified method 1 | Modified method 2 | Proposed method |
No. 1 | 0.994 | 0.994 | 0.994 | 0.995 |
No. 6 | 0.992 | 0.993 | 0.994 | 0.996 |
Fig. 15 and Table 6 present the transverse load distribution coefficients, cosine similarity, and peak deviation rates obtained from different methods. The RJG method exhibits the highest peak deviation rate, with rates of 16.14 % and 11.38 % for center and side loading, respectively. The peak deviation rates for the modified methods are 15 % and 10 %. In contrast, the proposed method achieves peak deviation rates of 6.66 % and 4.55 % and cosine similarities of 0.998 and 0.996 for center and side loading, respectively, demonstrating that the proposed method’s results are closer to the load characteristics of the actual bridge. Therefore, the proposed method is highly applicable to wide highway bridges and superior to other theoretical calculation methods for calculating the transverse load distribution.
Table 6Cosine similarity and peak deviation rates of transverse load distribution coefficients of the highway bridge
Calculation method | Load in the center | Load on the side | ||
Cosine similarity | Peak deviation rate / % | Cosine similarity | Peak deviation rate / % | |
RJG method | 0.990 | 16.14 | 0.991 | 11.38 |
Modified method 1 | 0.991 | 15.24 | 0.991 | 10.76 |
Modified method 2 | 0.993 | 14.05 | 0.993 | 9.67 |
Proposed method | 0.998 | 6.66 | 0.996 | 4.55 |
Fig. 15Transverse load distribution coefficients of the highway bridge obtained from different methods
a) Load in the center
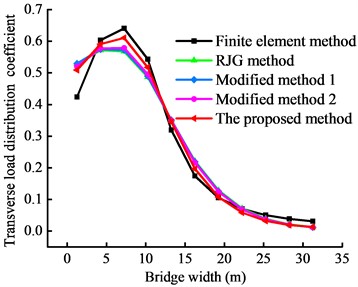
b) Load on the side
5. Conclusions
The RJG method results in deviations from the refined FEM results for estimating the transverse load distribution of a wide box girder bridge. It does not consider the effects of torsion, distortion, and vertical inclination of the adjacent joints of box girders. This paper proposed a theoretical calculation method considering torsion and distortion for estimating the transverse force distribution of wide box girder bridges under heavy loads.
The proposed method exhibited higher accuracy than traditional methods and their modifications for estimating the transverse load distribution and simulating the mechanical characteristics of bridges. The refined finite element model results were used as the benchmark, and the cosine similarity and peak deviation rate were used as quantitative indices to evaluate the accuracy of the proposed method, RJG method, and the modified RJG methods. The cosine similarity of the influence line for taxiway bridges was 0.996 for the proposed method. The maximum peak deviation rate of the transverse load distribution coefficient under center and side loading was 34.74 % for the RJG method and 14.88 % for the proposed method. For highway bridges, the cosine similarity of the influence line was 0.995 for the proposed method. The maximum peak deviation rate of the transverse load distribution coefficient was 16.14 % for the RJG method and 6.66 % for the proposed method. The results verify the proposed method's accuracy and applicability in calculating the transverse load distribution of taxiway bridges and wide highway bridges.
Unlike the FEM, the proposed method considers the mechanical characteristics of box girders under an eccentric load. The matrix equation of the regularized statically indeterminate force method was constructed to solve the transverse load distribution based on deformation compatibility. Thus, the method has higher computational efficiency and is more convenient for designers than traditional methods.
At present, the proposed method has good applicability in simple supported beam bridges with a span of less than 35 m and a wide-span ratio of less than 1.3. However, the calculation of transverse load distribution for larger spans and complex types of bridges still needs further study.
References
-
“AASHTO LRFD Bridge Design Specification, 9th Edition,” American Association of State Highway and Transportation Officials: Washington DC, USA, 2020.
-
Y. Zhao, X. Cao, Y. Zhou, G. Wang, and R. Tian, “lateral load distribution for hollow slab bridge: field test investigation,” International Journal of Concrete Structures and Materials, Vol. 14, No. 1, pp. 1–13, Dec. 2020, https://doi.org/10.1186/s40069-020-0397-1
-
T. Tevfik, B. D. H. Mary, and B. M. John, “Live load distribution factors for spread slab beam bridges,” Journal of Bridge Engineering, Vol. 22, No. 10, p. 04017, 2017.
-
S. Kong, L. Zhuang, M. Tao, and J. Fan, “Load distribution factor for moment of composite bridges with multi-box girders,” Engineering Structures, Vol. 215, No. 10, p. 110716, Jul. 2020, https://doi.org/10.1016/j.engstruct.2020.110716
-
Z. Hu, X. Li, and Y. I. Shah, “Simplified method for lateral distribution factor of the live load of prefabricated concrete box-girder bridges with transverse post-tensioning,” KSCE Journal of Civil Engineering, Vol. 26, No. 8, pp. 3460–3470, Aug. 2022, https://doi.org/10.1007/s12205-022-0757-2
-
A. Rafizadeh and A. Gharighoran, “Evaluation of load distribution factors on AASHTO LRFD Design parameters of the bridges deck by harmonic analysis,” KSCE Journal of Civil Engineering, Vol. 23, No. 6, pp. 2550–2560, Jun. 2019, https://doi.org/10.1007/s12205-019-1917-x
-
R. L. Qian, P. Su, and X. G. Wu, “Calculation method of transverse distribution of multi-beam small box girder bridge with distorted displacement,” Journal of Railway Science and Engineering, Vol. 15, No. 9, pp. 2270–2275, 2018.
-
Y. Zhang et al., “Applied computational method of long cantilevered prestressed composite bridge deck,” China Journal of Highway and Transport, Vol. 215, No. 6, pp. 79–84, 2007.
-
Z. N. Yu et al., “Calculation of transverse load distribution of multi-beam short box girder bridge considering influence of torsional resistance,” China Journal of Highway and Transport, Vol. 33, No. 7, pp. 104–113, 2020.
-
L. Ma et al., “Load transverse distribution of single box multi-cell girder with corrugated steel webs,” Journal of Southeast University (Natural Science Edition), Vol. 44, No. 1, pp. 145–149, 2014.
-
Y. Q. Xiang et al., “Lateral load distribution of multi-box steel-concrete composite girder bridges for considering slipping effect,” Journal of Harbin Institute of Technology, Vol. 44, No. 8, pp. 113–118, 2012.
-
C. Zhong, X. Cong, Y. Zhang, and J. Wang, “Research on transverse distribution coefficient of external prestressing and carbon fiber reinforced beam,” Journal of Vibroengineering, Vol. 20, No. 5, pp. 1966–1981, Aug. 2018, https://doi.org/10.21595/jve.2018.18901
-
B. Y. Wang et al., “Analytical method for plate theory-based calculation of bridge transverse load distribution coefficient,” Applied Mechanics and Materials, pp. 3207–3210, 2013.
-
Y. J. Li et al., “Calculation of transverse load distribution coefficient of assembled girder bridge considering main girder damage,” (in Chinese), Journal of Railway Science and Engineering, Vol. 16, No. 6, pp. 1459–1465, 2019.
-
Xu Xun and Qiang Shi-Zhong, “Research on distortion ananlysis theory of thin-walled box girder,” (in Chinese), Engineering Mechanics, Vol. 30, No. 11, pp. 192–201, 2013, https://doi.org/10.6052/j.issn.1000-4750.2012.07.0554
-
J. R. Mei, “Distortional calculation of trapezoidal box section girder with single-cell,” (in Chinese), Highway Engineering, Vol. 2, pp. 8–23, 1983.
-
F. Feng, F. Huang, W. Wen, P. Ge, and Y. Tao, “Enhanced ultimate shear capacity of concave square frustum-shaped wet joint in precast steel-concrete composite bridges,” Applied Sciences, Vol. 11, No. 4, p. 1915, Feb. 2021, https://doi.org/10.3390/app11041915
-
W. Shi, B. Shafei, Z. Liu, and B. Phares, “Longitudinal box-beam bridge joints under monotonic and cyclic loads,” Engineering Structures, Vol. 220, No. 10, p. 110976, Oct. 2020, https://doi.org/10.1016/j.engstruct.2020.110976
-
T. Yan, “Research on structural improvement technical study on improvement technology of lateral connection of small box bridge,” (in Chinese), Chongqing Jiaotong University, Chongqing, 2018.
-
H. Chen, Y. N. Zhang, and S. J. Ge, “Strengthening assembly slab bridges by imposing transverse external prestress,” (in Chinese), Journal of Railway Science and Engineering, Vol. 5, No. 6, pp. 22–25, 2008.
-
Y. Deng, B. M. Phares, and P. Lu, “Lateral live-load distribution of dual-lane vehicles with nonstandard axle configurations,” Journal of Bridge Engineering, Vol. 22, No. 4, p. 04016, 2017.
-
F. Qiao, L. E. Guan, and Q. L. Wang, “A fast similarity calculation method based on cotangent similarity and BP neural network,” (in Chinese), Journal of Tongji University (Natural Science), Vol. 49, No. 1, pp. 153–162, 2021.
-
S. F. Li, “Analysis of transverse load distribution of multi-box girder bridge and its experimental study,” (in Chinese), Southwest Jiaotong University, Chengdu, 2007.
About this article

The authors thank the staff of China Airport Planning and Design Institute Co. Ltd., who assisted in various ways throughout this study. The generous support of the Science Fund of the Beijing Municipal Natural Science Foundation (No. 8192035); Research Project of China Airport Planning and Design Institute Co., Ltd. (No. JSRDKYN20220202) is to be acknowledged.
The datasets generated during and/or analyzed during the current study are available from the corresponding author on reasonable request.
Ji Wen: conceptualization, methodology, project administration, writing - review and editing. Xinyi Ma: methodology, writing- original draft, software, investigation, visualization, writing-review and editing. Hui Jiang: conceptualization, methodology, supervision, funding, writing-review and editing. Chen Li: conceptualization, software, investigation, validation, writing-review and editing. Cong Zeng: writing-review and editing, visualization, data curation. Zengqing Bai: validation, visualization, data curation.
The authors declare that they have no conflict of interest.
