Abstract
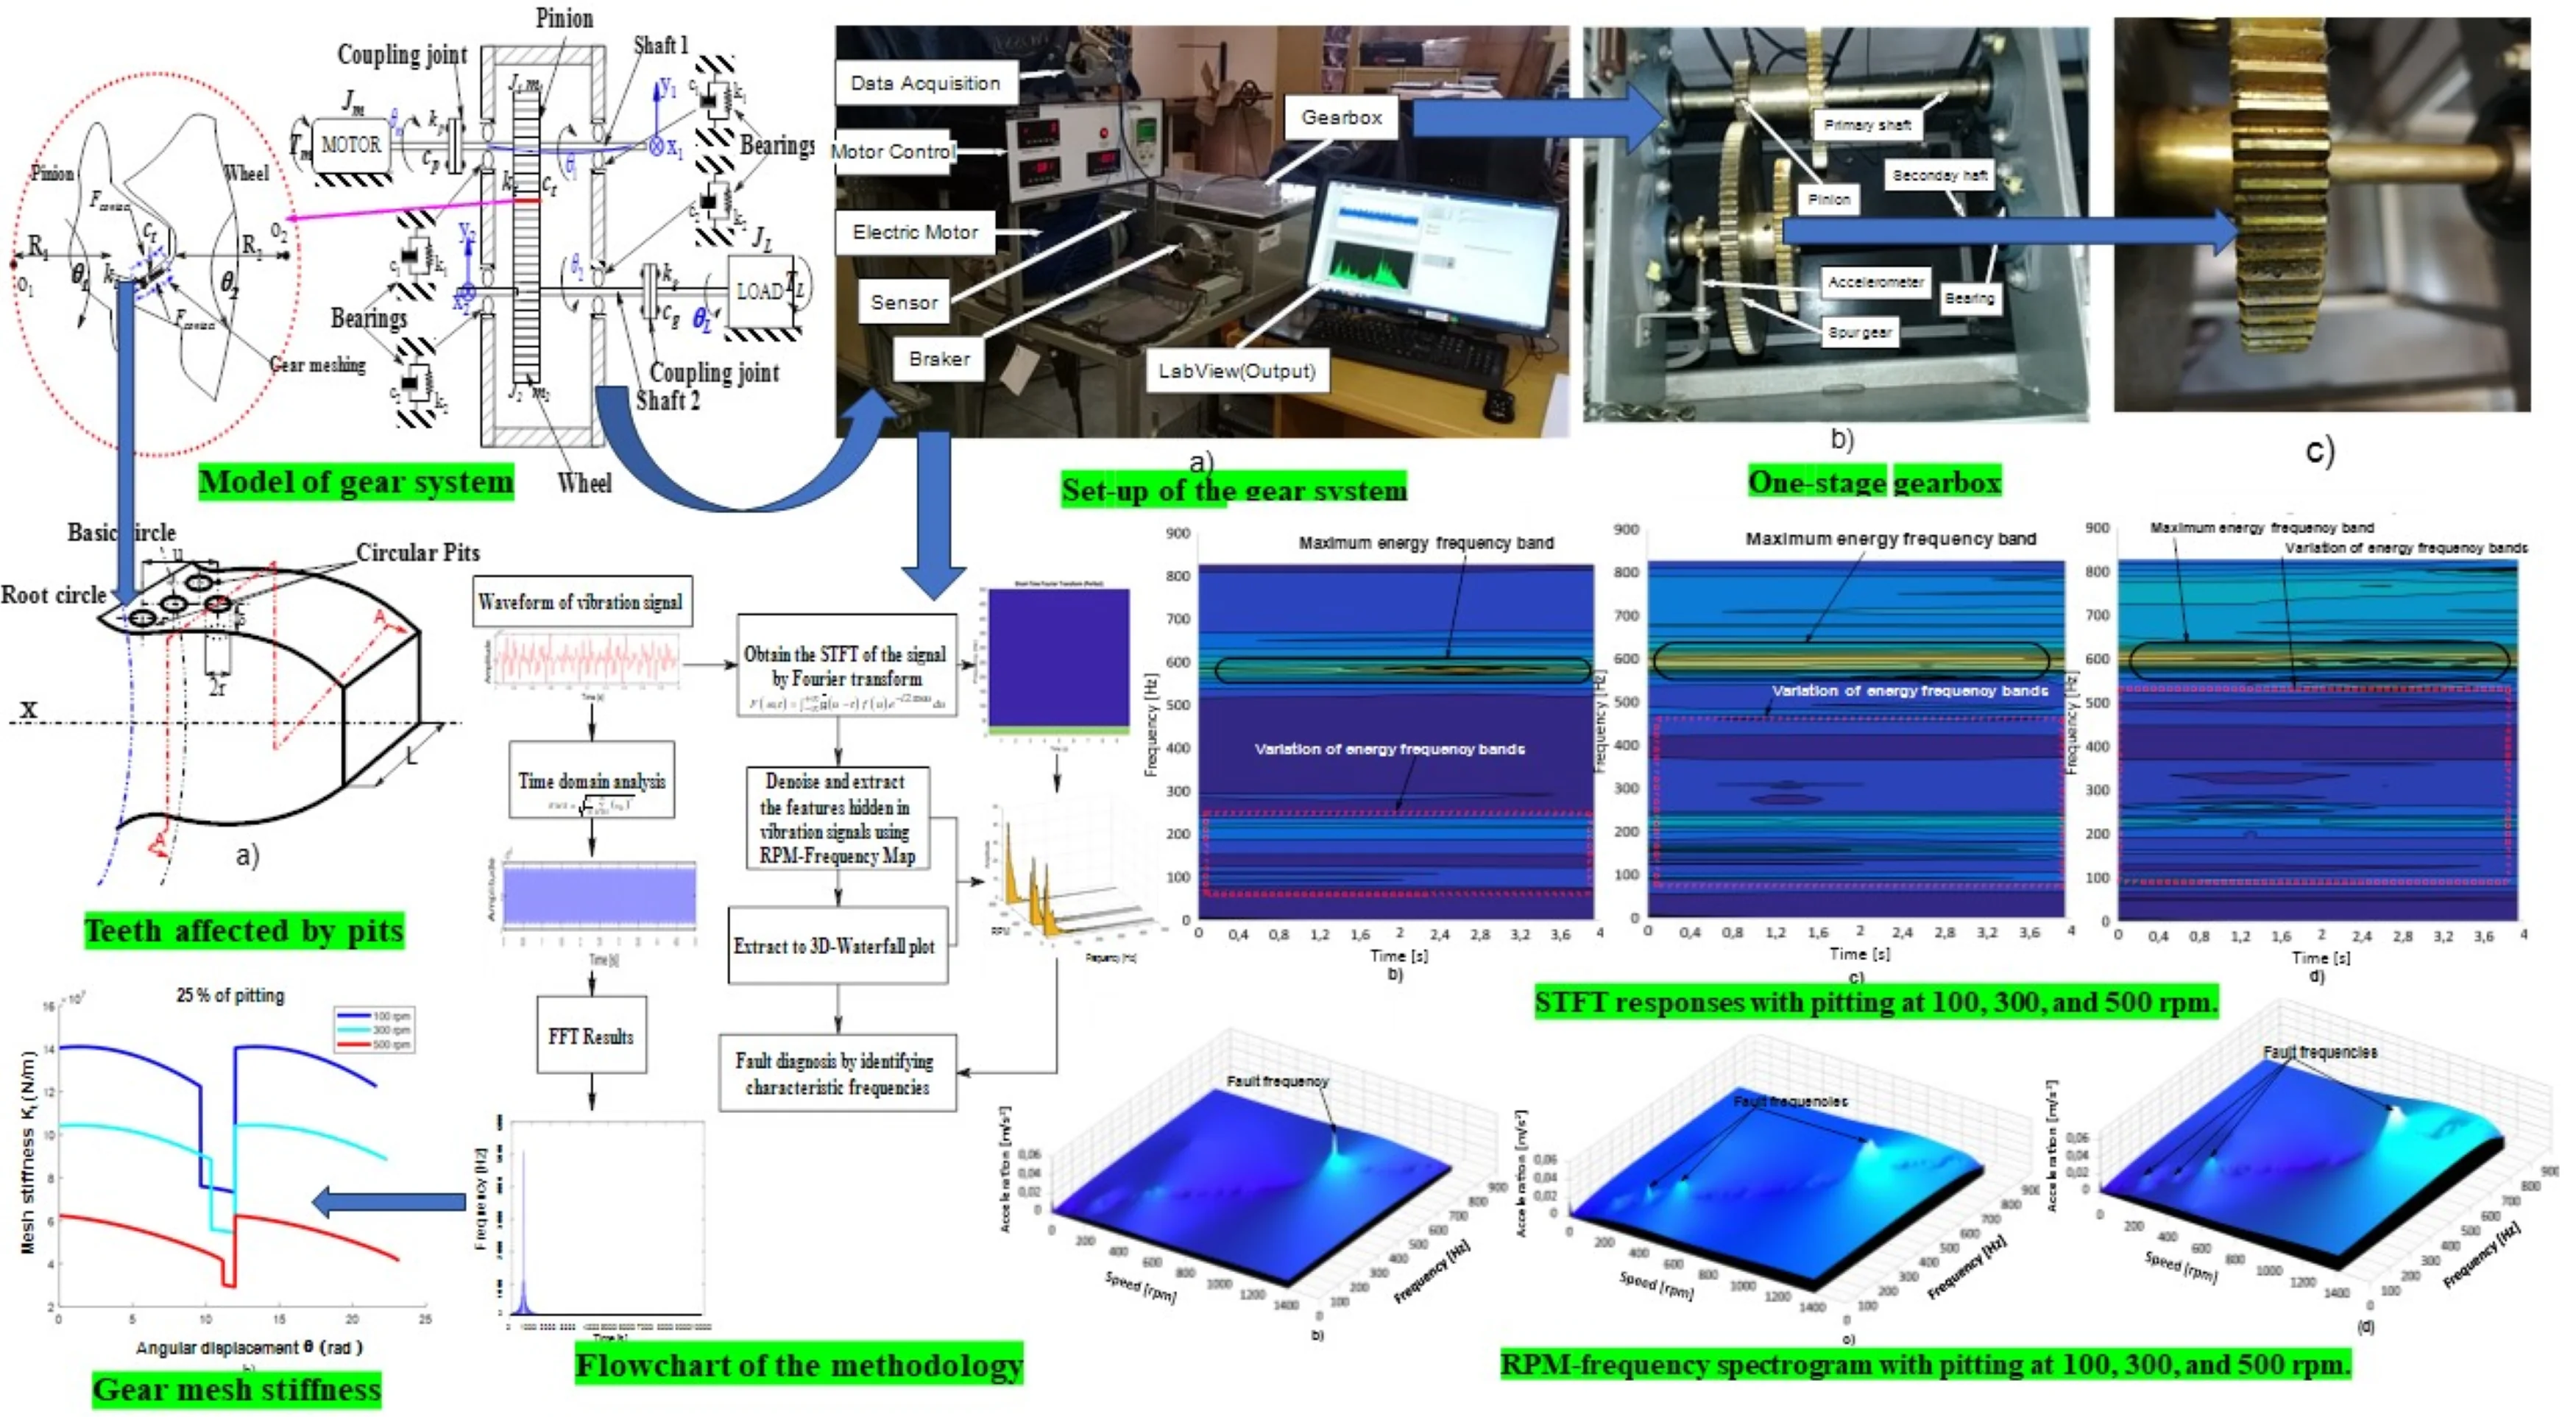
This paper uses a dynamic six-degree-of-freedom model that considers torsional and lateral motions to predict the impact of pitting on vibration parameters in a spur gearbox for various operating speeds and torque loads. The study examines the dynamic characteristics of a gearbox with localized pitting damage on a single gear tooth using theoretical and experimental approaches. The research analyzes the forced vibrations of a single-stage spur gear system with pitting damage, which includes variations in mesh stiffness, damping, and gear error excitation, to identify symptoms of default. The equation of motion for the rotary gearbox system is established using the Lagrangian method in tandem with Short-Time Fourier Transform (STFT) and frequency-RPM map fault diagnosis. During real-time vibration monitoring, vibration signals are captured via accelerometers and processed in both the time and frequency domains using the LabVIEW data acquisition signal processing package to extract diagnostic information. The experimental findings demonstrate how vibration analysis combined with time-frequency processing can recognize machine conditions even in harsh operational conditions. Moreover, the experimental results indicate a significant similarity with the theoretical analysis and validate the effectiveness of the RPM frequency technique-based pitting detection method, which can be an asset in gear fault monitoring.
Highlights
- Numerical and experimental study of spur gear system pitting effects at different speeds.
- Lagrange dynamics in inertial coordinates have been used to model a gear system.
- The analysis reveals that narrowband components provide a helpful warning for spotting potential gearbox pitting faults as the amplitude increases.
- The vibration signal spectrum exhibits the sidebands associated with the pitting fault effect, which become more prominent at higher speeds.
- The RPM frequency and STFT show effectiveness in identifying the vibration characteristics of gears and extracting fault-related features at different gear speeds.
1. Introduction
Gears are crucial components in rotating mechanical equipment due to their efficiency in transferring mechanical power across a wide range of speeds and loads. They have a variety of uses, including in wind turbines, aircraft, and other mechanical applications [1-2]. Gear failure can be highly problematic as it can cause production to stop and result in financial loss. Pitting, a common and difficult-to-detect gear failure, is one of the most critical errors to prevent. Undiscovered gear pitting faults can lead to catastrophic machine failures while in use [3], [4-5].
As a result, research on gear fault mechanisms and diagnosis has become crucial to prevent the negative consequences of gear failure. There are several methods used to monitor gearbox characteristics, but vibration monitoring is considered the most important [6-7].
In recent years, several techniques for detecting gear pitting defects have been developed. These methods for diagnosing and predicting machine faults are often grouped similarly [8-9]. The potential energy method for calculating gear stiffness was first proposed by Yang and Lin [10]. In order to analyze non-stationary and nonlinear signals, Parey et al. [11] created a 6-degree-of-freedom gear dynamics model with local tooth defects that takes into account internal excitation factors like time-varying meshing stiffness (TVMS), damping, tooth clearance, tooth profile error, and tooth modification using empirical mode decomposition (EMD. Instead of assuming that the spalling area of the gear has a specific geometry, Luo et al. [12-13] used an irregular shape and random distribution method to simulate gear spalling.
From the perspective of geometric deviations and changes in tooth surface roughness caused by pitting, Luo [14] discussed the characteristics of pitting faults. Xu et al. [15] developed a wear rate model to evaluate the loss of tooth surface material and micro pitting, which can predict the early failure state of gears. The potential energy method was used by Lei et al. [16] to create a unique model that replicates the change in gear meshing stiffness under four distinct pitting circumstances and explains the distribution of pits. To determine the total stiffness brought on by circular pits and to further explain the circumstances of repeated tooth surface pitting, Chen et al. [17] adopted a two-dimensional Gaussian model using a potential method. By utilizing the appropriate technology to provide qualitative information on the forces applied to the machine components, this method, when compared to time-domain and frequency-domain analysis methods [18], generates more accurate and illuminating results, enabling the diagnosis of potential malfunctions. In the context of gear dynamics, Li and Lee [19] proposed a four-degree-of-freedom concentrated mass model for gear systems to predict the fatigue life of cracked gears and verified the feasibility of the method through comparison with experiments.
Using experimental tests based on time-domain, frequency-domain, and time-frequency domain analysis, Kiran Vernekar et al. [20] studied the impact of removing one tooth from gears used in internal combustion engines on the vibration response. Aslantas et al. used a faster R-CNN network method to compare the pitting formation lives acquired from experimental and simulated approaches to determine the pitting formation life [21]. They experimented with the crack propagation path on the tooth surface. Wei et al. used the electro hydrodynamic lubrication (EHL) theory, the roughness of surface topography, and an experimental method to evaluate the stress on the tooth surface of spur gears with pitting under various contact types (including pure rolling contact and sliding contact) [22]. Mohammed and Rantatalo [23] developed a mathematical model for a single-stage spur gear to simultaneously detect the depth and width of the gear tooth crack growth and used the potential energy approach to determine the Time-Varying Meshing Stiffness (TVMS). Yoon et al. [24] used the RPM-frequency method to analyze the variations in the RPM signal, which are caused by the presence of pitting, using signal processing techniques, including Fourier analysis and peak detection algorithms, to identify only the frequency. The research results show that tooth extraction causes a minor increase in the vibration amplitude in the time domain as well as in the shaft rotational frequency and its harmonics using the frequency domain.
Although numerous spur gear models have been developed in the literature, very few have considered the impact of speed change on pitting occurrence on the tooth surface and other nonlinear factors such as no variation of the frequency in the established models. Furthermore, few of these models have not been experimentally verified for variations in gearbox parameters.
In this paper, a six-degree-of-freedom (DOF) model is proposed, which enables the investigation of the effect of gear system transfer function and speed variations on tooth pitting size. This is achieved through the combination of the short-time Fourier transform (STFT) and RPM-frequency techniques. The use of the proposed method allows for analyzing the vibration in the time and space of the variation of the stiffness. The system is highly non-linear due to the parameter links with gear stiffness, which means that the system can not only be based on a frequency that is not varied. The frequency-RPM cannot give relevant results if the frequency does not change, which is why the use of STFT, which has a time frequency, allows for obtaining more significant results. The method is suggested because tooth-pitting defects are usually accompanied by high-energy impacts, and it implies that the vibrations resulting from pitting defects may not be easily distinguishable using conventional methods or standard techniques only.
The present work examines the complex, nonlinear dynamic behavior of the system by discussing the influence of pitting on gear vibration characteristics at different speeds. The simulated response of the model, which represents the experimental test rig under consideration, is experimentally verified. Several runs are conducted to evaluate the accuracy of the model under the influence of various operating speeds and torque load variations in the presence of tooth pitting.
The remaining paper is structured as follows: In Section 2, the calculation of the meshing stiffness of a gear and the effects of pitting on meshing stiffness at different speeds are investigated. In Section 3, the six-degree-of-freedom dynamical model of a single-stage gear system is established, and their vibration response is solved. In Section 4, the pitting impact on the gear vibration characteristics at 100, 300, and 500 rpm is analyzed. In Section 5, the test bench description is described, and experimental results are presented to validate the theoretical results. Finally, a discussion and conclusions are drawn in Sections 6 and 7.
2. TVMS of spur gears based on the potential energy method
To simplify the calculation of the effective gear meshing stiffness, the analysis focuses on the coupled torsional-lateral vibrations of paired spur gears in one-stage gearing systems as a means to identify pitting.
2.1. Calculation of meshing stiffness of spur gears in perfect state
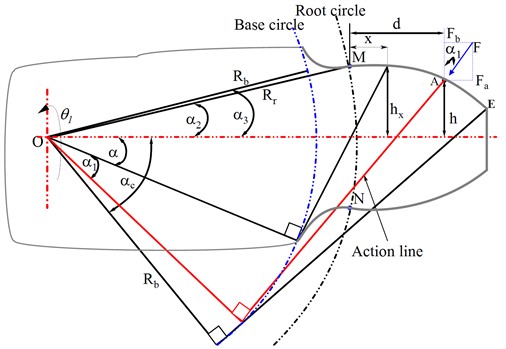
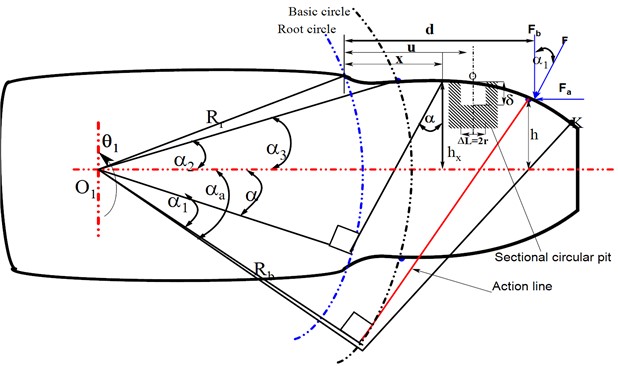
A meshing stiffness that is equal to two involute gear profiles produced with faultless accuracy is used to evaluate the gear system. A circle involute is a curve formed by a point N on a base circle with no fault that rolls in a straight line (Fig. 1).
Fig. 1The root circle of a spur gear tooth beam model is larger than the base circle
Using the beam theory, the Hertz, bending, shear, and axial compressive energies contained in a tooth can be expressed as follows:
where , and are the bending, shear, and axial compressive stiffness in the same direction as the force , respectively. As a result, the action force can be divided into two orthogonal forces, the bending force , and the axial force , which produce the bending and axial compression effects, respectively, as illustrated in Fig. 1. They are expressed as follows:
By deriving the involute geometry of the tooth profile expressed as the following expression Eq. (6), becomes the integration variable rather than :
Its derivative is obtained as follows:
Depending on the geometry of the involute tooth in Fig. 1, the couple , section area , the moment of inertia of the surface of the tooth, and the shear modulus are expressed as shown in Eq. (8) and later substituted into , , and expressions, respectively:
Considering that the root circle () is larger than the base circle () called also a dedendum circle and the substitution of all expressions of Eq. (8) into , , and , respectively, the Hertz, bending, axial and shear stiffness equations of the tooth in the perfect state can be expressed as follows, as seen in Fig. 1:
where represents Young’s modulus, width of the tooth, and Poisson’s ratio, respectively.
The total effective meshing stiffness contained in a single pair of gear teeth is given by the sum of the Hertzian contact, bending, shear, and axial compression stiffness equations, which are written as follows:
In Eq. (13), the driving (pinion) and driven (wheel) gears, respectively, are represented by subscriptions 1 and 2. The next section provides more specific information on the calculation of the detection of pitting faults in the effective gear meshing stiffness.
2.2. Gear mesh stiffness with pitted tooth
The study is facilitated by using a cylindrical pit shape, which simplifies the geometry of the gear system, making it easier to develop mathematical models and perform analytical calculations.
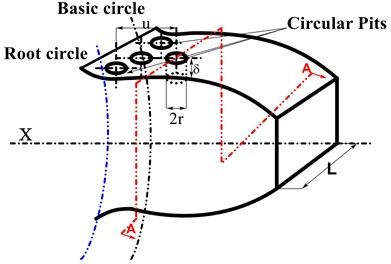
The cylindrical pits are positioned within the tooth surface to avoid interfering circles, as illustrated in Fig. 2, with a focus on accurate gears, the involute of the circles, and the vibration responses of the numerical model.
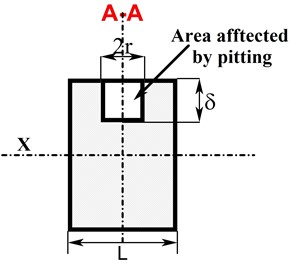
The pitting is prevalent at the root of the gear teeth, where the stress concentration is higher, as illustrated in Fig. 2(a). The tooth failure section area is shown in Fig. 2(b).
Fig. 2Gear tooth affected by circular pits: a) Isometric profile and b) tooth cross-sectional area
a)
b)
A pinion tooth is defined as a non-uniform cantilever beam starting from the root circle, as shown in Fig. 3. The potential energy approach is used to determine how the gear mesh stiffness is impacted by the growth of the pitting on the surface tooth.
Fig. 3Tooth cantilever beam model of the pitted tooth
This work includes calculations of the tooth contact width, area, and area moment of inertia using the cantilever beam model to simulate the pitting fault on the spur gear.
The effective tooth contact width is not constant and decreases when the surface of the pinion tooth has pitting dispersed over adjacent teeth during meshing.
The variation in the expression of results in corresponding changes in . This alteration also impacts the expressions of , and , which differ from those obtained for a faultless pinion tooth. The reduction in tooth contact width, area, and area moment of inertia due to pitting is represented by , , and , respectively, along with the distance to the tooth root. They are calculated using the following Eq. (14), (15) and (16):
where denotes the radius of the pitting circle and is the depth of the pit, defines the distance between the tooth root and the pit centre.
The Hertzian contact stiffness , bending stiffness , axial stiffness , and shear stiffness , are then calculated for gear pairs with a circular tooth pit as follows:
where represents the number of teeth.
For the spur gear that is impacted by the defective pinion, the series combination of Hertzian contact stiffness, bending stiffness, axial stiffness, and shear stiffness in that order is used to express the overall effective meshing stiffness () of a pair of spur gears as follows:
For this numerical study, the damping coefficient is proportional to the meshing stiffness as follows:
where is the scale constant in seconds (s), which depends on the coefficient damping and the meshing stiffness. In this simulation, its value has been chosen as = 1.6858× 10⁻⁵ (s) and = 1.5× 10⁸ (N / m).
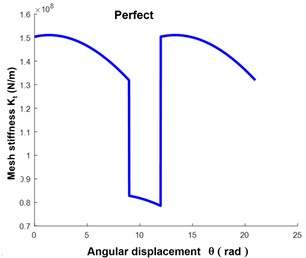
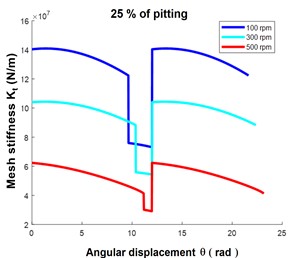
2.3. Numerical comparison of dynamic gear mesh stiffness
A time-varying mesh stiffness affected by the pitting presence is evaluated for each speed of the gear system at 100, 300, and 500 rpm.
The results presented in Fig. 4(a) indicate that there were no changes observed in the profiles of the pinion and wheel, and the stiffness of the gear meshing. In Fig. 4(b), a damaged gear tooth interacts with a single undamaged pinion tooth, altering the meshing stiffness of the spur gears at three rotational speeds. Although lowering amplitude of the gear mesh stiffness, the angular displacement of the gear mesh stiffness increases from 20 rad to 21.8 rad for 100 rpm, from 21.8 rad to 22.7 rad at 300 rpm, and from 22.7 to 23.9 rad at 500 rpm as the speed increases as well. It is observed that the meshing stiffness affected by the pitting decreases from 1.5108 to 14107 N/m for 100 rpm, from 14×107 to 10.5×10⁷ N/m for 300 rpm, and from 10.5×10⁷ to 6.2×10⁷ N/m for 500 rpm. This implies that as the speed of the gear system increases, the pitting impact on the components of the gear vibration signal is greater and identifiable.
Fig. 4Mesh stiffness: a) healthy gear and b) Pitted gear at various speeds
a)
b)
3. Nonlinear gear dynamic model with six degrees of freedom
This study describes a dynamic transmission system that uses two gears mounted on precisely aligned shafts and supported by four bearings. The dynamic behavior of the teeth is described using a single pair of teeth model, as shown in Fig. 5. and are the torques of the driving gear (motor) and driven gear (load), respectively. and are the rotation angles of the driving gear and driven gear, respectively. Comprehensive gear damping is represented by (N.s/m) while the meshing stiffness is represented by (N/m).
Fig. 5A schematic diagram of a one-stage gearbox with 6 DOF
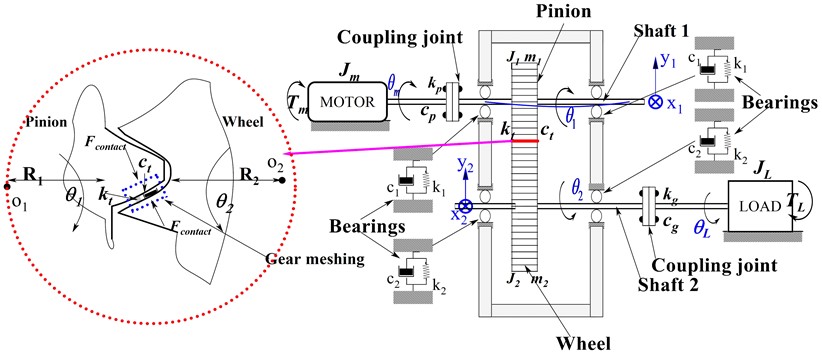
Lagrange dynamics in inertial coordinates are used in this study to create a model gear system. The gear used in this study is a typical spur gear with a 6-degree pressure angle. The following presumptions serve as the foundation for the model: (1) ideal lubrication conditions, which ignores friction; (2) the gear body is treated as a solid; (3) the shaft is assumed to be rigid to prevent deformation; (4) the engaged teeth are treated as two isotropic elastic bodies.
In line with the published article [25], meshing stiffnessand dampingat the gear meshing interface are considered because they are the dominant factors that affect the overall behavior of the spur gear system running at a slow speed. The tangential stiffness and damping may be much smaller in comparison, and therefore, they can be ignored without significantly affecting the accuracy of the results.
3.1. Kinetic energy expression
The lateral-torsional vibrations of a spur gear pair in a single-stage gear system are determined through integration using the following mechanical energy principles:
The total kinetic energy of the system, , is represented by the equation derived from the geometry shown in Fig. 5:
3.2. Potential energy expression
The total potential energy of the gearing system, which is expressed as follows, includes the strain energy of rotating gears:
3.3. Damping expression
As a result of the gearing system considering viscous damping, Rayleigh’s dissipation function is represented as follows:
where, correspondingly, the driving pinion is 1 and the driven gear is 2.
3.4. The general equations for the motion of a gear system
Based on mechanical energy principles, a spur gear in a one-stage gearing system has coupled lateral-torsional vibrations that are recognized and integrated. The following gear pair governing equation is established using a Lagrange formulation Eq. (26):
6-DOF represented by , , , , , and are considered in this work since the lateral vibration in the -direction for a spur gear does not couple with the -direction.
By completing the necessary differentiation, manipulation and by substituting the terms for kinetic energy, potential energy, and Rayleigh’s dissipation function in the Lagrange equation, the equations of the six-degrees-of-freedom motion of the gear system are obtained in the matrix form as follows:
where and are the linear displacements of the pinion and wheel, the mass moment of inertia of the pinion, the mass moment of inertia of the gear, the mass moment of inertia of the motor, the mass moment of inertia of the load. and are the angular displacements of the motor and load.
Table 1Spur gear primary characteristics
Parameters | Pinion | Wheel | Units |
Young module | 2.068×10¹¹ | 2.068×10¹¹ | Pa |
Pressure angle | 20 | 20 | º |
Poisson’s ratio () | 0.3 | 0.3 | – |
Number of teeth (pinion) and (gear) | 30 | 90 | – |
Radius of the pinion base circle and gear | 30.1 | 76.1 | mm |
Mass (pinion) and (gear) | 0.96 | 2.88 | kg |
Radial stiffness of bearings (pinion) = (wheel) | 6.56×10⁷ | 6.56×10⁷ | N/m |
Damping coefficient of bearings (pinion) = (wheel) | 1.8×10⁵ | 1.8×10⁵ | N.s/m |
Coupling torsional stiffness (pinion) = (gear) | 4.4×10⁴ | 4.4×10⁴ | N.m/rad |
Coupling damping coefficient (pinion) = (wheel) | 5×10⁵ | 5×10⁵ | N. s/m.rad |
4. Numerical results
The section presents a different approach to visualize the identification and diagnosis of gear problems. The proposed method, such as the waterfall plot (RPM-frequency), is created using STFT, which enables the examination of the spectral composition of the dynamic response at three different speeds.
To extract the system feature, a constant torque of 11.9 Nm is applied to the driving motor, and the load shaft speed is limited to a maximum of 520 rpm, resulting in a pinion rotational speed of 866.7 rpm according to theory. The gear mesh frequency is 570 Hz, and the sample frequency is 30 Hz. To study the dynamic response, the signal is averaged across one of the gears with teeth rotating at a frequency of rotation in Hz and a phase angle of as specified in [26], with and without fault:
The signal is measured when the gear set rotates at a maximum shaft speed of 520 rpm. It comprises a series of pulses with sections of fluctuating frequency and oscillating amplitude, which have an upward trend. To analyze the frequency content of the input vector , which is created using a Kaiser window with a length of 256 and shape parameter 5 [27], the STFT technique is used. By applying the STFT to the variable, a frequency-shaft (rpm) map matrix signal waterfall (, , rpm) is generated, which represents the spectral content of in a 3D map. The sample time is used to obtain the signal , which is then visualized as a waterfall plot.
4.1. Comparing the dynamic responses to predict one-stage gearbox system damage
The coupled governing equations are solved using the Runge-Kutta discretization approach and the MATLAB solver with the subroutine ode45. During the simulation, ten seconds are spent on each analysis under the considered assumptions given in Table 1.
The time and frequency domains are applied to analyze healthy and faulty signals in gear system diagnostics.
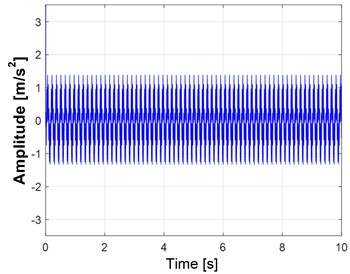
In Fig. 6(a), the dynamic vibration response of a healthy gearbox operating at 100 rpm is observed. Fig. 6(b), illustrates the frequency domain signals obtained from a gear system in its normal state.
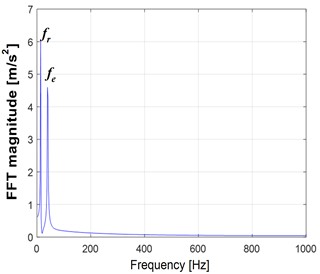
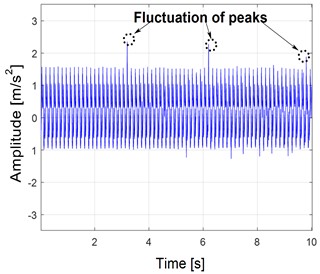
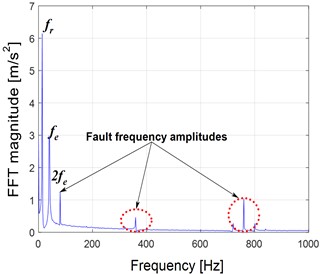
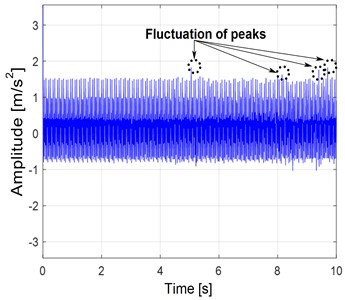
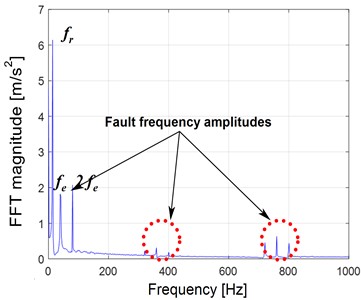
Fig. 7 illustrates the signal and spectrum produced by a meshing fault at a rotational speed of 100 rpm. Fig. 7(a) shows a fluctuation of three peaks between 4.6 and 9.2 seconds with a moderate concentration of vibration waves. Fig. 7(b) shows three spectral emergencies that match the meshing frequency and a signal indicative of an impact ( and ) between 80.06 and 800.03 Hz. A drop in the amplitude of gear meshing stiffness from 4.6 to 3 m/s2 is also observed.
Fig. 6Healthy gear response at 100 rpm: a) time domain and b) spectrum of FFT: fr= 34.5 Hz and fe= 50.06 Hz
a)
b)
Fig. 7Gear faulted vibration response with 25 % of pitting: a) Y-displacement and b) FFT response at 100 rpm
a)
b)
Fig. 8Gear faulted vibration response with 25 % of pitting: a) Y-displacement and b) FFT response at 300 rpm
a)
b)
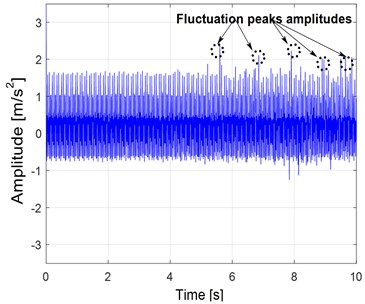
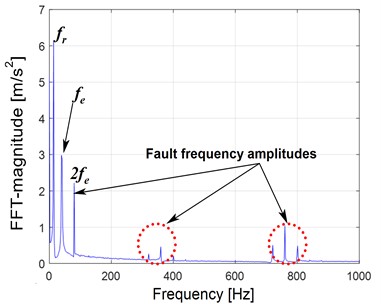
In Fig. 8(a), it is observed that when a gear pitting fault occurs, a periodic impact amplitude with a period between 4 and 10 seconds appears in the vibration signal. The impact of the vibration grows for a gear system affected by a concentration of waves running at 300 rpm with a torque load of 5 Nm. In Fig. 8(b), the variation in speed generates an amplitude, and the value of the gear mesh frequency significantly decreases to 3 m/s2 with the frequency modulation of the characteristic harmonics of gears.
Fig. 9Gear faulted vibration response with 25 % of pitting: a) Y-displacement, b) FFT response at 500 rpm
a)
b)
At a speed of 500 rpm with a torque load of 8 Nm, it is observed an increase in the fluctuation of amplitude peaks between 4.5 and 8 seconds, up to 2.4 m/s2 as shown in Fig. 9(a). However, Fig. 9(b) demonstrates an increase in the amplitude of the three spectral emergencies, and the peak values of the developed sidebands and harmonics produced by the faulty signal rise significantly.
As the vibration signals exhibit resonance in the obtained results, it is important to use appropriate methods to extract the gear tooth pitting fault characteristic for the best results under various operating speeds. However, the use of the proposed method allows for analyzing the vibration in the time and space of the variation of the stiffness. The system is highly non-linear due to the parameter links with gear stiffness, which the system can not only be based on a frequency that is not varied. The Frequency-RPM cannot give the relevant results if the frequency does not change, the reason why the use of STFT which has time-frequency allows for obtaining more significant results.
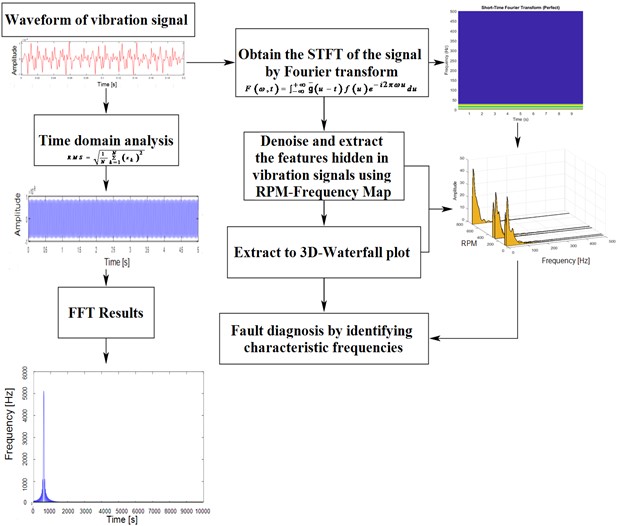
Fig. 10Flowchart of the proposed methodology
4.2. Extraction and identification of pitting fault features
The flowchart of the proposed methodology presented in Fig. 10 illustrates the identification of gear condition metrics and their further evaluation using the feature extraction method.
The advanced STFT and frequency-RPM map fault diagnosis technique is used to successfully extract and identify pitting fault features that may be obscured by the torque frequency producing impulsive forces in the spur gear system. This technique is one of the most effective, offering high fault sensitivity and good diagnostic capabilities.
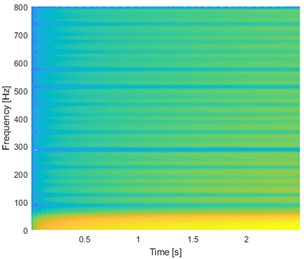
Fig. 11 shows the spectrograms of four signals generated by the spur gear system under different rotational speed conditions (100 rpm, 300 rpm, and 500 rpm). These spectrograms show a parallel of frequency bands with an interval of 50 Hz, which corresponds to the gear mesh frequency. For a faultless gear (in perfect condition), there is no discernible change in the direction of the time axis in the reported frequency, as shown in Fig. 11(a).
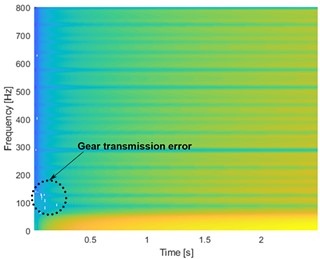
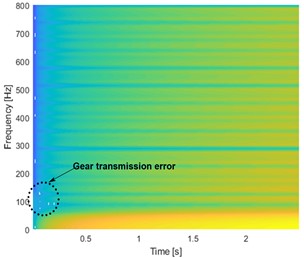
Figs. 11(b), 11(c), and 11(d) depict the spectrogram of the defective spur gear vibration signal. It is discovered that there is a start to energy dissipation in the frequency range of 50 Hz to 150 Hz for a period of 0.2 s at speeds of 100 rpm and 300 rpm. At a speed of 500 rpm, it is to notice the phenomenon of energy broadening along the period from 0 to 3 s. These figures are related to a rise in surface roughness, indicating a pitted surface of the tooth. The results of the vibration signal based on the RPM-Frequency technique are shown in Fig. 12.
Fig. 11Spectrograms of STFT signals: a) healthy gear at 100 rpm, b) faulty gear of 25 % of pitting at 100 rpm, c) faulty gear of 25 % of pitting at 300 rpm, and d) faulty gear of 25 % of pitting at 500 rpm
a)
b)
c)
d)
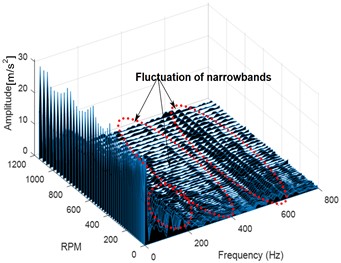
In Fig. 12(a), no fluctuation along the frequency axis is observed. In the second scenario depicted in Fig. 12(b), three spectral peaks are constrained to 44 m/s2, resulting in a wide range of vibration frequencies containing the narrowband from 200 to 600 Hz. The narrowband components provide a helpful warning for spotting potential gearbox pitting faults as the amplitude increases. Fig. 12(c) shows that the majority of the narrowband in the third scenario has grown in amplitude, with the propagation of the narrowband occurring between 0 and 400 Hz and at 600 Hz. However, in Fig. 12(d), the propagation of the narrowband becomes significant and severe. This increase in the amplitude of the narrowband and the change in wave patterns under different speeds indicate a fault and most likely a pitted gear.
In the next section, experiments for spur gears with gear tooth pitting faults are carried out to verify the accuracy of the simulation results and analyze the fault characteristics.
Fig. 123-D Waterfall frequency spectrograms of signal: a) healthy gear at 100 rpm, b) faulted gear with 25 % of pitting at 100 rpm, c) faulted gear with 25 % of pitting at 300 rpm, d) faulted gear with 25 % of pitting at 500 rpm
a)
b)
c)
d)
5. Experimental model
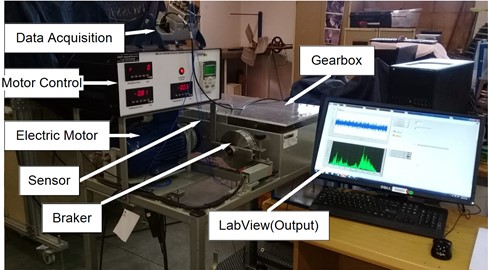
The dynamic performance of one-stage spur gear with pitting gear is evaluated using the test bench. In Fig. 13(a), the experimental apparatus is displayed. It includes a motor and a compound gearbox. An electric motor with 0.55 kW and 1500 rpm is coupled to the gearbox input shaft using a jaw-type coupling.
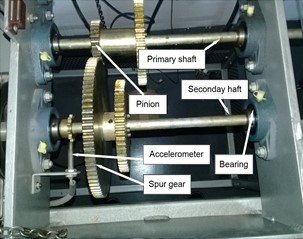
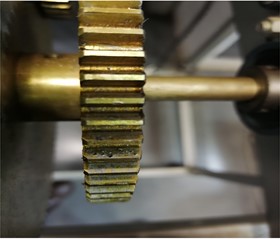
In Figs. 13 (b) and 13(c), the test gearboxes of a spur gear pair and a spur single gear are shown, respectively, with the parameters listed in Table 1. As shown in the test gearbox, the driving motor is controlled by a frequency converter, and the loading device is a magnetic particle brake. The brake has a maximum torque of 5 Nm and a maximum current of 0.5 A. The ends of every drive shaft are supported by friction bearings. The electric motor speed is adjustable using a dimmer (speed regulator). The accelerometer is used to collect vibration data from the gearbox driving side bearing.
The revolution speed of the driving gear is measured using a revolution speed transducer. LabVIEW software is used to process the collected vibration data and transform it into a signal. The tests were run using an eight-second sample that lasted at a sampling rate of 10 kHz.
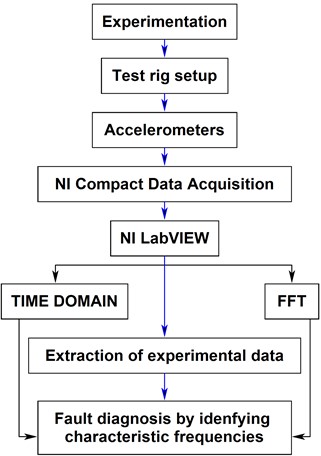
The procedure of the gearbox fault diagnosis is described in a flow diagram in Fig. 14.
Based on the ratio of the pitted area to the tooth contact surface, the pitting level is chosen. The decision to classify pitting as moderate is based on the mechanical stress it causes, whereas slight pitting may not be easily detected at the early stage due to lubrication.
Fig. 13Experimental test rig: a) set-up of the gear system, b) gearbox set, and c) spur gear with pits
a)
b)
c)
Fig. 14Diagram of the gearbox fault diagnosis process
5.1. Experimental results
The results of the experiment were obtained to analyze the volume and the impact of pitting at an early stage under a range of speeds in realistic conditions.
The signals of gear vibration recorded at shaft speeds of 100 rpm in the perfect state and 100, 300, and 500 rpm in the damaged state are presented as follows.
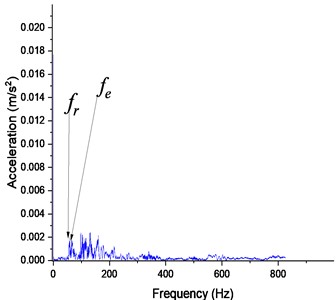
Fig. 15Perfect gear responses at 100 rpm: a) Y-displacement, b) spectrum of FFT
a)
b)
The vibration signals under normal operating conditions at a speed of 100 rpm are shown in Figs. 15(a) and 15(b), respectively.
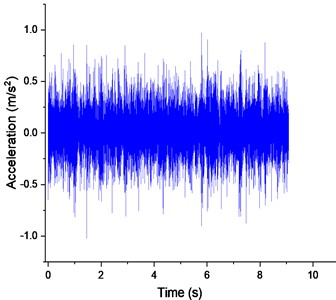
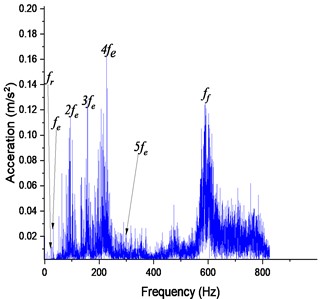
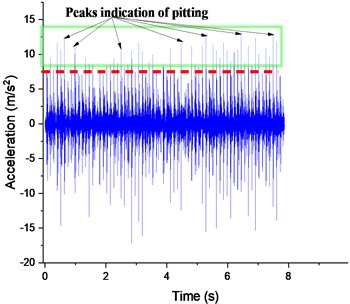
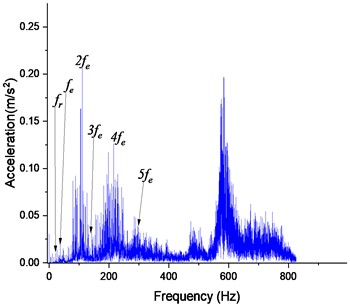
The vibration data is acquired when a tooth-pitting fault is induced in the primary shaft gear. The following Figs. 16, 17, and 18 present the average gear vibration accelerations starting at 6 m/s2, and their corresponding spectra start with a fault frequency () of 600 Hz at an amplitude of 0.13 m/s2 for a considered moderate pitting fault. The residual vibration signals caused by the failure on the tooth surface were identified at the following speeds: 100, 300, and 500 rpm.
Fig. 16Defective gear responses with 25 % pitting at 100 rpm: a) Y-displacement, b) spectrum of FFT

a)
b)
Fig. 16(a), makes it possible to precisely follow the impact of the defect on the vibration level of the structure. However, as seen in Fig. 16(b), the spectrum exhibits strong resonance characteristics. Although the defect can be located, the subsequent action is incorrect with a mesh frequency () of 50.24 Hz, which generates sidebands around the fundamental frequency and amplitudes of harmonics (, , , ). It is observed that the division of the vibration signal into segments corresponds to both the resonance of the structure and the intensity of vibration caused by the pitting fault recorded at 100 rpm.
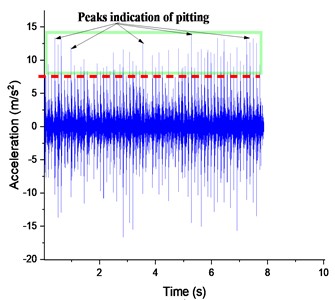
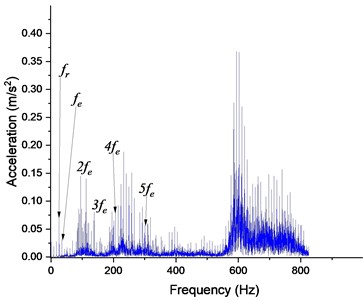
For the machine operating now at a constant speed of 300 rpm, the fluctuation of the peaks keeps increasing with a maximum amplitude that reaches 12.5 m/s2, and the distribution of the impulses along the time axis at 8s, as shown in Fig. 17(a). However, it is observed a division of the vibration signal into segments and identifying the largest harmonic within each segment. Subsequently, the signal is divided by the estimated average speed within that segment as shown in Fig. 17(b). Thus, the sidebands generated by amplitude or frequency modulation can provide useful information for detecting the fault. Their frequency range is between 100 Hz and 600 Hz, and their amplitude increased by approximately 14 % of the peak-to-peak value of 0.22 m/s2 of vibration compared to Fig. 16(b).
Fig. 17Defective gear responses with 25% pitting at 300 rpm: a) Y-displacement, b) spectrum of FFT
a)
b)
Fig. 18Defective gear responses with 25% pitting at 500 rpm: a) Y-displacement, b) spectrum of FFT
a)
b)
At a speed of 500 rpm, the lateral vibration signal continues to increase over the time axis, as shown in Fig. 18(a), with the appearance of a multitude of peaks reaching up to 13.5 m/s2. However, in Fig. 18(b), it is observed that a peak-to-peak value of 0.37 m/s2 keeps increasing and is produced at the same gear fault location as the impact of the fault on the speed becomes stronger and the residual vibration amplitude affected by noise components increases proportionally.
In comparison to numerical simulations, pitting faults can be identified through the vibration spectrum. Figs. 16, 17, and 18 demonstrate that in practical situations, the presence of noise in the spectrum, caused by the impact of teeth, shafts, bearings, and other mechanical components, can make it difficult to identify these faults. This necessitates the use of appropriate time-frequency techniques to improve their visibility. In-depth analysis of these vibration signals involves utilizing the short-time Fourier transform (STFT) spectra, with a particular emphasis on the RPM-frequency map.
As the raw signals from accelerometers are not enough to determine the presence or absence of defects. The STFT and frequency-RPM map are used to highlight the high amplitudes generated by the pitting fault and ignore noise-induced isolated events. However, time and frequency analysis of the waveform alone is not enough to diagnose the issue due to numerous spurious peak and signal leakages caused by the pitting fault and gear noise.
5.2. Results of extraction analysis
The principle of detecting the defect involves extracting and analyzing the envelope to identify the characteristic frequency of the faulty component, thereby identifying the source of the defect. The results of STFT and frequency-RPM map analysis on experimental data at various speeds for a pitted spur tooth are displayed in Figs 19 and 20.
Fig. 19RPM-frequency spectrograms: a) perfect gear at 100 rpm, b) faulty gear with 25 % pitting at 100 rpm, c) faulty gear with 25 % pitting at 300 rpm, d) faulty gear with 25 % pitting at 500 rpm
a)
b)
c)
d)
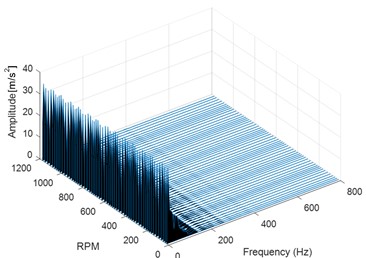
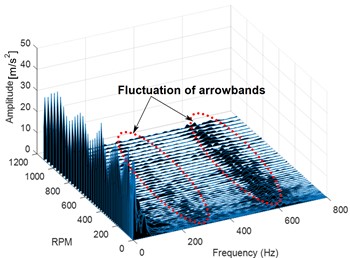
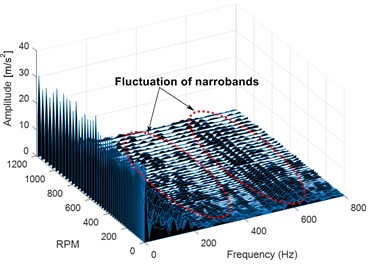
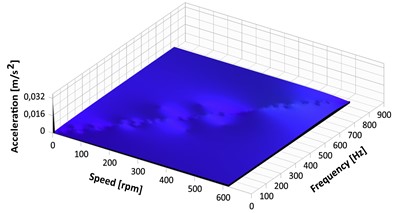
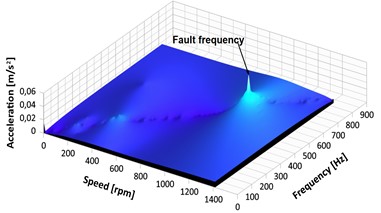
Fig. 19 shows the results of vibration signal based on the RPM-Frequency method. The spectrogram of the perfect gear running at 100 rpm in Fig. 19(a) demonstrates a reasonable frequency resolution, with low frequency of approximately 0.0000007 m/s2. The development of spectral peaks with amplitudes ranging from 0.011 to 0.025 m/s2 along the axis-speed RPM can be seen in the second scenario depicted in Fig. 19(b) because of pitting on the gear tooth surface. Figs. 19(c) and 19(d) show the expanded RPM-Frequency spectrum, which can be used to observe the modulation impact of the fluctuating gear system with pits at different speeds.
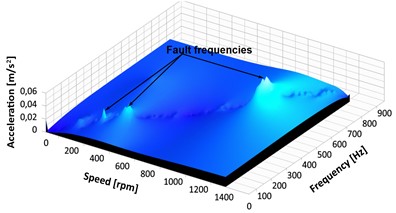
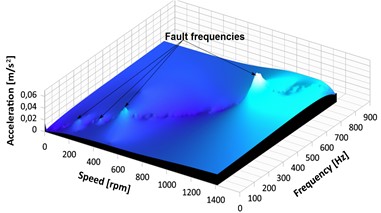
The effects of speed variations are identified as having a significant impact on the characteristic frequencies of gears affected by pits. RPM-Frequency tracks the frequency content with associated time information to visualize the magnitude of the hidden impact on signal characteristics for the pitted gears. It is noted that there is a significant increase in the amplitude of the spectral peaks in Figs.19(c) and 19(d), the biggest reaching about 0.046 m/s2.
This increase in amplitude and change in wave patterns indicate a pitting fault. The frequency of gear meshing increases significantly to 0.015 m/s2. An increase in the gear meshing frequency amplitude is a sign that the gear tooth surface is affected by the fault.
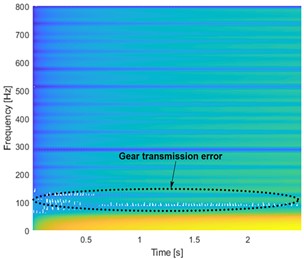
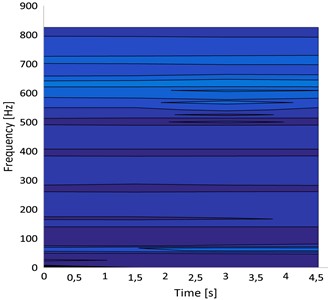
Fig. 20(a) depicts the STFT plot from a well-maintained gearbox. It is clearly observed that the energy frequency bands have a spacing equal to the modulation frequency. the dominance of the gear meshing frequency at 50.024 Hz and its harmonics between 150 Hz and 800 Hz. The noise peaks over the whole operating speed range can be seen using an STFT, and thus it can focus on the most important peaks by determining the relative intensities of all peaks.
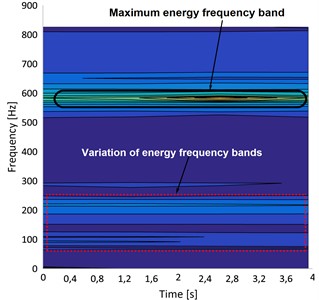
A pitted spur gear vibration signal spectrogram is shown in Fig. 20(b), where the maximum horizontal frequency band at 585 Hz in yellow serves as a guide to the resonance zone. It is also observed that an increase in the gear mesh stiffness value is close to 100 Hz with an expansion of energy. The harmonics of the gear meshing frequency vary between 70 Hz and 250 Hz, which manifest as varying horizontal lines and are additional dominant frequencies.
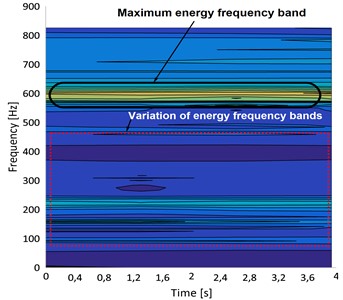
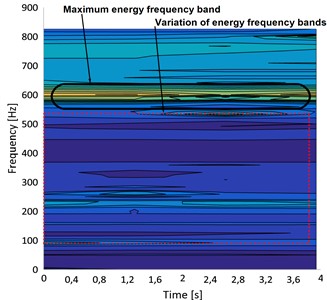
Figs. 20(c) and 20(d) illustrate the spectrograms of a pitted spur gear vibration signal under different speeds of operation. The pitting effects on the gear tooth surface vary in the range of 50 Hz to 800 Hz, depending on the shaft's instantaneous rotating speed. However, the existence of a maximum horizontal frequency band at 600 Hz and several declining lines all around it shows that the signal contains frequency-modulated line noise.
The defect frequencies change with the shaft rotational frequency, and this modulation is shown in the envelope spectrogram. Numerous sidebands on both sides of the pitting frequency in the envelope spectrograms serve as mirrors for this modulation.
Fig. 20STFT responses: a) perfect gear at 100 rpm, b) faulty gear with 25 % pitting at 100 rpm, c) faulty gear with 25 % pitting at 300 rpm, d) faulty gear with 25 % pitting at 500 rpm
a)
b)
c)
d)
6. Discussions
In Fig. 7 to Fig. 9 and Fig. 16 to Fig. 18, fluctuations in peaks are observed along the time axis. While in Figs. 11(b)-11(d) and Figs. 18(b)-18(d), a concentration of vibration signals at 600 Hz and an unequal distribution of energy frequencies between 100 Hz and 800 Hz are observed.
Figs. 11(b), 11(c), and 11(d) and Figs. 20(b), 20(c), and 20(d) demonstrate periodic variations in gear mesh frequency harmonics caused by pitting faults. Due to variances in the material qualities and stress conditions during the experimental stage, there are some differences in the frequency level between the two outcomes.
It is noticed that the impact of the pitting fault on vibration signals at different speeds can be easily identified in Figs. 11, 12, 19, and 20, whereas this is not the case with the time domain and FFT spectrum.
7. Conclusions
This paper establishes and solves a one-stage dynamic model of a spur gear using the Runge-Kutta method. The study explores the system’s nonlinear frequency response properties and proposes a novel cantilever beam model to create a more accurate tooth-pitting representation.
After conducting a numerical simulation and experimental study of a spur gear system affected by pitting while operating at various speeds, the obtained results were interesting and shed light on the identification of the pitting fault at an early stage by varying the speed of the gear system. To validate the experimental results, pitting defects were deliberately induced on a case-hardened tooth of the spur gear pinion. The study led to the following conclusions:
1) By studying the gear system at different speeds, it may be possible to identify the speed range where pitting is most likely observed.
2) Tooth pitting failure leads to a reduction in the time-varying mesh stiffness within the engagement zone of a single tooth and gear tooth strength and increased vibration and noise.
3) The vibration signal spectrum exhibits sidebands near the mesh frequency when tooth pitting is present, as observed in the Short-Time Fourier Transform (STFT) and frequency-RPM map. The sidebands associated with the pitting fault effect become more prominent at higher speeds.
The advantage of using RPM-frequency methodology in the analysis of spur gear vibration lies in its ability to provide a more accurate and detailed analysis of gear faults, by considering the relationship between vibration frequency and rotational speed.
Using this method, it is possible to effectively identify the vibration characteristics of gears and extract fault-related features at different gear speeds, such as 100, 300, and 500 rpm. By quantifying these effects under variable speed conditions, the study can provide insights into the impact of pitting on gear system performance and reliability.
For future work, this method can use in high-speed two-stage gearboxes, where the rotational speed can vary significantly.
References
-
A. S. Sait and Y. I. Sharaf-Eldeen, “A review of gearbox condition monitoring based on vibration analysis techniques diagnostics and prognostics,” in Rotating Machinery, Structural Health Monitoring, Shock and Vibration, Volume 5, Vol. 5, pp. 307–324, 2011, https://doi.org/10.1007/978-1-4419-9428-8_25
-
W. Yu, “Dynamic modelling of gear transmission systems with and without localized tooth defects,” Ph.D. thesis, Unpublished, 2017.
-
D. Forrester, “Advanced vibration analysis techniques for fault detection and diagnosis in geared transmission systems,” Ph.D. thesis, Swinburne University of Technology, 1996.
-
C. Hu, “Vibration based diagnostics for bearing faults and gear wear,” Ph.D. thesis, 2016, https://doi.org/10.26190/unsworks/19009
-
A. Slimane et al., “An interactive method for predicting industrial equipment defects,” The International Journal of Advanced Manufacturing Technology, Vol. 95, No. 9-12, pp. 4341–4351, Apr. 2018, https://doi.org/10.1007/s00170-017-1416-5
-
S. Yan et al., “Deformation and response analysis of spur gear pairs with flexible ring gears and localized spalling faults,” Machines, Vol. 10, No. 7, p. 560, Jul. 2022, https://doi.org/10.3390/machines10070560
-
C. Dascaliuc, A Comprehensive Study on the Gearbox Fault Diagnosis Based on Vibration Analysis. Hochschule Rhein-Waal, 2019.
-
Z. Meng, F. Wang, and G. Shi, “A novel evolution model of pitting failure and effect on time – varying meshing stiffness of spur gears,” Engineering Failure Analysis, Vol. 120, p. 105068, Feb. 2021, https://doi.org/10.1016/j.engfailanal.2020.105068
-
T. Ouyang, G. Wang, R. Yang, and X. Mo, “A novel mathematical model for analysis of the cracked planet gear,” Engineering Failure Analysis, Vol. 138, p. 106398, Aug. 2022, https://doi.org/10.1016/j.engfailanal.2022.106398
-
D. C. H. Yang and J. Y. Lin, “Hertzian damping, tooth friction and bending elasticity in gear impact dynamics,” Journal of Mechanisms, Transmissions, and Automation in Design, Vol. 109, No. 2, pp. 189–196, Jun. 1987, https://doi.org/10.1115/1.3267437
-
A. Parey, M. El Badaoui, F. Guillet, and N. Tandon, “Dynamic modelling of spur gear pair and application of empirical mode decomposition-based statistical analysis for early detection of localized tooth defect,” Journal of Sound and Vibration, Vol. 294, No. 3, pp. 547–561, Jun. 2006, https://doi.org/10.1016/j.jsv.2005.11.021
-
Y. Luo, N. Baddour, G. Han, F. Jiang, and M. Liang, “Evaluation of the time-varying mesh stiffness for gears with tooth spalls with curved-bottom features,” Engineering Failure Analysis, Vol. 92, pp. 430–442, Oct. 2018, https://doi.org/10.1016/j.engfailanal.2018.06.010
-
Y. Luo, N. Baddour, and M. Liang, “A shape-independent approach to modelling gear tooth spalls for time varying mesh stiffness evaluation of a spur gear pair,” Mechanical Systems and Signal Processing, Vol. 120, pp. 836–852, Apr. 2019, https://doi.org/10.1016/j.ymssp.2018.11.008
-
Y. Luo, N. Baddour, and M. Liang, “Dynamical modeling and experimental validation for tooth pitting and spalling in spur gears,” Mechanical Systems and Signal Processing, Vol. 119, pp. 155–181, Mar. 2019, https://doi.org/10.1016/j.ymssp.2018.09.027
-
X. Xu, J. Lai, C. Lohmann, P. Tenberge, M. Weibring, and P. Dong, “A model to predict initiation and propagation of micro-pitting on tooth flanks of spur gears,” International Journal of Fatigue, Vol. 122, pp. 106–115, May 2019, https://doi.org/10.1016/j.ijfatigue.2019.01.004
-
Y. G. Lei, Z. Y. Liu, D. L. Wang, X. Yang, and H. Liu, “A probability distribution model of tooth pits for evaluating time-varying mesh stiffness of pitting gears,” Mechanical Systems and Signal Processing, Vol. 106, pp. 355–366, 2018.
-
T. Chen, Y. Wang, and Z. Chen, “A novel distribution model of multiple teeth pits for evaluating time-varying mesh stiffness of external spur gears,” Mechanical Systems and Signal Processing, Vol. 129, pp. 479–501, Aug. 2019, https://doi.org/10.1016/j.ymssp.2019.04.029
-
J. Hou, S. Yang, Q. Li, and Y. Liu, “Effect of a novel tooth pitting model on mesh stiffness and vibration response of spur gears,” Mathematics, Vol. 10, No. 3, p. 471, Jan. 2022, https://doi.org/10.3390/math10030471
-
Y. Lei, J. Lin, M. J. Zuo, and Z. He, “Condition monitoring and fault diagnosis of planetary gearboxes: A review,” Measurement, Vol. 48, No. 1, pp. 292–305, Feb. 2014, https://doi.org/10.1016/j.measurement.2013.11.012
-
K. Vernekar, H. Kumar, and K. V. Gangadharan, “Gear fault detection using vibration analysis and continuous wavelet transform,” Procedia Materials Science, Vol. 5, pp. 1846–1852, 2014, https://doi.org/10.1016/j.mspro.2014.07.492
-
A. Miltenović, I. Rakonjac, A. Oarcea, M. Perić, and D. Rangelov, “Detection and monitoring of pitting progression on gear tooth flank using deep learning,” Applied Sciences, Vol. 12, No. 11, p. 5327, May 2022, https://doi.org/10.3390/app12115327
-
J. Wei, A. Zhang, and P. Gao, “A study of spur gear pitting under EHL conditions: Theoretical analysis and experiments,” Tribology International, Vol. 94, pp. 146–154, Feb. 2016, https://doi.org/10.1016/j.triboint.2015.08.037
-
O. D. Mohammed and M. Rantatalo, “Dynamic response and time-frequency analysis for gear tooth crack detection,” Mechanical Systems and Signal Processing, Vol. 66-67, pp. 612–624, Jan. 2016, https://doi.org/10.1016/j.ymssp.2015.05.015
-
S. K. Yoon, H. S. Kim, and K. T. Park, “Non-destructive evaluation of gear tooth surface pitting using RPM-frequency technique,” International Journal of Precision Engineering and Manufacturing, Vol. 17, No. 11, pp. 1523–1528, 2016.
-
V. Atanasiu, D. Leohchi, and C. Rozmarin, “Dynamic transmission error prediction of spur gear pairs with friction consideration,” in SYROM 2009, pp. 243–252, 2010, https://doi.org/10.1007/978-90-481-3522-6_19
-
K. H. Yakeu Happi, B. Xavier Tchomeni Kouejou, and A. A. Alugongo, “Crack fault diagnosis for spur gears using gear frequency-RPM spectrum,” in 2021 IEEE 12th International Conference on Mechanical and Intelligent Manufacturing Technologies (ICMIMT), pp. 259–264, May 2021, https://doi.org/10.1109/icmimt52186.2021.9476182
-
W. J. Wang and P. D. Mcfadden, “Early detection of gear failure by vibration analysis I. calculation of the time-frequency distribution,” Mechanical Systems and Signal Processing, Vol. 7, No. 3, pp. 193–203, May 1993, https://doi.org/10.1006/mssp.1993.1008
About this article

The authors are grateful for the resources and equipment provided by the Department of Industrial Engineering, Operation Management, and Mechanical Engineering at Vaal University of Technology (South Africa) to enable this work.
The datasets generated during and/or analyzed during the current study are available from the corresponding author on reasonable request.
Conceptualization, technique, software, formal analysis, investigation, validation, original draft preparation, writing (review), and editing were done by Kemajou Herbert Yakeu Happi. Validation, formal analysis, review, editing, and supervision were handled by Bernard Xavier Tchomeni Kouejou. Editing and review were handled by Alfayo Anyika Alugongo. The published version of the manuscript has been read and approved by all authors.
The authors declare that they have no conflict of interest.
