Abstract
This paper attempts to utilize lower order harmonics and modes of vibration consisting of “square ratios of frequency variations” as structural damage susceptibility characteristics. This is followed by the development of the frequency-based method. Firstly, this paper derives the theoretical formulation of the square ratio of frequency variation method. Secondly, a finite element model of a single column platform is established. Then the damage is simulated using the reduced modulus of elasticity to localize the damage. The result is shown to be feasible. Thirdly, a model of the offshore single column platform is constructed, and the damage is simulated using cracks on the column. The “frequency variation square ratio” is valid, so the method can be used in reality. This method is applied to the single column platform model, suitable for a beam structure. It is very effective for the single column damage identification at different damage levels, and can also initially locate the damage. This method has high practical application value and reference value for future studies.
1. Introduction
Since the discovery of offshore oil in 1979, China’s offshore oil development has entered a period of rapid development. By 2010, China's offshore crude oil production capacity had reached 51 million tons. At present, offshore oil has become an important crude oil production base in China. The offshore platform for oil production which is a large and complex structure, its technological development impacts on the offshore oil exploration. Due to a long-term operation in the harsh marine environment, the structure of offshore platforms is prone to various kinds of damage, even leading to a structural destruction [1]. Many catastrophic accidents that caused huge casualties, economic losses and bad social impacts happened during the offshore oil production at different fields [2]. Therefore, it is important to detect accurately any damage to offshore platforms. Health monitoring systems monitor the condition of oil platform structures and take timely action against damage to ensure the safe operation of the platform. The traditional health detection system relies on the frequency of the structure can only determine the existence of damage, but it is difficult to predict the severity and specific location of the damage. To solve the problem of varying degrees of damage at different locations on offshore platforms, this study conducted a modal numerical analysis for offshore platform structures, improving the traditional frequency detection methods. The study attempted to use the square ratio of frequency variation as the sensitivity feature of structural damage, and established a finite element model of a single column platform. Then the damage is simulated by reducing the Young’s modulus to propose a feasible and novel frequency-based monitoring method for detecting damages to offshore platforms. This method which applied to an ocean platform model, is very effective for the single column damage location research and for their classification by different damage levels, and is suitable for a beam structure and has strong potential practical application value and reference value for future studies.
2. Literature overview
Currently, vibration-based structural health monitoring, which is widely used for damage detection, can construct damage indicators based on the measured vibration response [3]. Scholars have proposed many damage identification methods, such as the dynamic response data method [4] and the finite element model correction method [5]. Razavi et al. [6] proposed a damage identification method based on the wavelet packet transform component energy. This method adopts the SHM system and damage identification program, and develops a finite element model correction technology to apply the finite element model correction to a structural damage detection. The experimental results show that the damage identification method based on the wavelet packet transform component energy is highly responsive to the damage sensitivity of the structure and also avoids the measurement signal blurring. Li [7] corrected the modal information of steel truss bridge based on the sensitivity analysis using the Young's modulus as a parameter, and proved the effectiveness of the method by physical tests. However, the basic requirements are relatively high, and under the complex structure, the ocean platform detection has great limitations. Kahya [8] performed a sensitivity analysis based on the Bayesian parameter estimation and used the model correction method to identify the damage of multi-cracked composite beams. They accurately localized multiple cracks of different severity in cantilever beams, but were less effective in identifying other types of damages of the same severity. However, it is less effective in identifying multiple damages with the same severity. Han [9] used a wavelet transform for noise reduction under pressure in weakly compressible structures (smoothed-particle hydrodynamics) and investigated the interaction between irregular waves and vertical dikes. The wavelet packet transform allows analysing the signal with more details than the wavelet transform, so the damage identification method based on the wavelet packet energy shall also be widely used for solving such tasks. However, for small damages, the wavelet packet energy cannot be effectively used directly for damage identification. Asgarian [10] used the rate of change of the wavelet packet energy as an index to obtain the structural acceleration response through dynamic loading to locate accurately any damage of a large ocean platform model under different damage conditions. The Gikhonov regularization method was also widely applied in the field [11]. The principle is to introduce the regularization matrix. It serves to compress the weight of the total parameter values for prevent the negative impact of a parameter having too high weight on the results, and to improve the anti-interference ability of the model. However, for a further determination of the damage location, other methods are needed to conduct a local damage detection.
In order to better detect the variation of vibration signals in structures, damage detection methods based on frequency indices are a tool used commonly. Vandiver et al.. [12] proposed a technique that can detect structural failures by detecting the variation of the eigenfrequency of the structure. The technique introduces a statistical energy analysis to predict the dynamic variation of fixed and floating structures in response to wave forces. Begg et al. [13] tested a series of component failures caused by changes in the structure's third-order eigenfrequency on a 4.8-meter-high, four-legged, K-rigged North Sea platform model by applying sinusoidal and stochastic excitations through an electrodynamic shaker. By monitoring three oil platforms in the North Sea, Loland and Dodds [14] found that small changes in the structure caused the test intrinsic frequency to fluctuate in the range of 10 % to 15 %. Kim and Stubbs [15] proposed a damage detection method and specific algorithms based on modal information. Hearn gave useful results for structural damage location by “frequency variation square ratio” [16]. However, although the damage sensitivity dependence and the previous frequency function measurement are accurate enough, a small damage does not allow to be determined directly through the frequency sound function.
In conclusion, the study shall cover the sensitivity of the offshore platform structure. Existing studies analyzed the structural damage based on the wavelet packet energy, fixed frequency, elastic modulus, etc., but there is still a room for improvement in the damage sensitive response rate, and the early detection of small damage components remains a problem to be solved. Frequency is the most easily measured structural dynamic feature, and frequency is the most accurate structural dynamic feature measured by the current technology. The resolution of frequency identification for low damping structures can be as high as 0.1 %. The method is relatively simple in calculation and has strong comprehensive recognition ability, making it convenient for engineering applications [17].
The identification of structural damage can be carried out using natural frequency, mode shape, modal curvature, and modal strain energy damage identification indicators. Based on the current research status, the characteristics and limitations of the above damage identification indicators were analyzed. Due to the limited setting of vibration mode displacement measurement points, more parts of the vibration mode can only be filled through modal expansion, especially when the local damage of the structure is mild, the final obtained vibration mode difference before and after the structural damage is not significant, leading to identification errors. Due to the use of differential method to calculate modal curvature, there are high requirements for the number and arrangement of measurement points, and node curvature cannot be obtained. It is difficult to identify damage to large and complex structures. The modal strain energy of the damaged area is relatively large compared to the actual value, and there are also varying degrees of modal strain energy changes in adjacent areas of the damage, which may cause misjudgment.
The theory of structural damage identification based on frequency variation has higher practicality and stronger operability compared to other theories. Frequency is an easily obtainable dynamic characteristic of the structure, and the analysis method is mature. However, the disadvantage is that it is easily affected by noise and the localization of multiple damages cannot be achieved, especially for large and complex structures with inaccurate identification accuracy. The square ratio of frequency variation adopted by the article is a damage identification method based on frequency. This method has been validated on simply supported beams, pressure pipelines, bridges, and truss structures, with accurate damage localization results. The working environment of single column platforms is harsh and the structural form is complex. Whether the frequency variation square ratio method can be applied to damage identification of single column platforms is a worthwhile research topic. The square ratio of frequency variation adopted by the article is a damage identification method based on frequency. It uses frequency indicators that are easy to pick up to identify any damage in single column platforms in harsh environments, providing a convenient solution for health detection of offshore platforms. In order to design a better structural damage recognition system for the offshore platform, this study constructed a finite element model of a single-column platform based on frequency variation and simulated damage by reducing the Young’s modulus to find and locate any damage at the initial stages.
3. Finite element modeling
Firstly, it is required to make a theoretical analysis of the square ratio of frequency variation, because the damping has a very small and negligible effect on the vibration pattern and intrinsic frequency of the model structure of the ocean platform, so its analysis lacks sense. The structural self-oscillation equation of the ocean platform is shown in Eq. (1):
where, and are the total stiffness matrix and total mass matrix, respectively. denotes the regularized vibration modes, and denotes the intrinsic frequency. In practice, the equations obtained after parameter changes are shown in Eq. (2):
where, , and , are the changes in the total stiffness matrix, mass matrix, and vibration mode, intrinsic frequency, respectively:
Expanding Eq. (3), while ignoring the mass change and the second order term, the authors obtain the final equations shown in Eq. (4):
Eq. (4) can be transformed into Eq. (5):
where, denotes the damage unit number of a single structure, and is the damage unit deformation. is the order of vibration modes. Compared with Eq. (4), Eq. (5) can directly utilize the change of units to show the frequency variation for the structure. From the two vibration modes and , the square ratio of the frequency variation of two orders due to a damage can be derived. Obviously, it is only related to the location of the damaged unit () and can be expressed as Eq. (6):
Eq. (6) can be used to determine the location of a structural damage. Eq. (6) is an important criterion for locating a structural damage using the “frequency variation square ratio”. Based on the characteristics of the formula, the effective steps for identifying and locating the structural damage can be summarized as follows:
(1) A vibration monitoring (computer simulation experiments or actual measurements) or finite element calculations are conducted for the structures. Then its frequency and mode of vibration are measured. When the natural frequency of a structure changes as a result of damage, a series of “Frequency Variation Square Ratios” are generated based on the measured frequencies.
(2) Using the obtained structural modes, the deformation of each element of the structure under each order of vibration can be obtained and a series of “Frequency Variation Square Ratios” of each element of the structure can be generated by Eq. (6).
(3) The “square ratio of frequency variation” for each element from step (2) is compared with the “square ratio of frequency variation” from step (1), and if any element is similar to the latter, then it is the damaged element.
(4) If the “Frequency Variation Square Ratio” values of several components are approximate and their respective values are calculated according to Eq. (7), then the damaged component can be determined from each value, and the component with the smallest is the damaged component:
where, denotes the number of units, and is the “frequency variation squared ratio” obtained by observation or test. is obtained according to Eq. (6).
The result of error identification is shown in Eq. (8):
where, represents the actual modulus of elasticity and represents the modulus of elasticity of the identification result.
This paper is a research on structural damage identification of single-column platforms based on the above works and theoretical background. The project originates from the damage identification of single-column offshore oil platform located at the Shengli Oilfield with a height of 26.592 m. The model is simulated as a steel single-column oil offshore platform with the same height. The model is shown in Fig. 1.
Fig. 1Finite element calculation model of single column platform
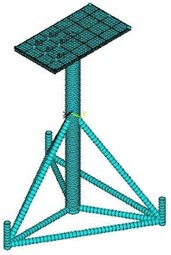
Considering the damage of the single-column platform, the single-column section has a great influence on the safety of the structure, so this paper discusses the damage identification of the vertical monopole section. A three-dimensional finite element model was designed based on this scheme. By modeling and determining the cross-section and boundary conditions, the stress distribution characteristics, deformation, natural vibration frequency, vibration mode, and instability characteristics of the single-column platform can be understood. In this paper, the ANSYS finite element software is used for simulation. The components that make up the various structures are made of steel with material properties of Q235A. Material parameters and element types of the structure are shown in Table 1.
Table 1Material parameters and element types of the structure
Component | Cross section | Material | Material models | Element type |
Platform | I-beam frame | Q235A | Isotropic elastic model | Shell163 |
Slant brace of platform | Φ400×25 mm | Q235A | Isotropic elastic model | Pipe16 |
Single column | Φ2000×25 mm | Q235A | Isotropic elastic model | Beam188 |
Lower diagonal brace of platform Bottom plane support | Φ800×25 mm | Q235A | Isotropic elastic model | Pipe59 |
Steel pipe pile | Φ800×25 mm | Q235A | Isotropic elastic model | Pipe59 |
In Table 1, the material properties of steel are defined by the ideal elastoplastic model, and the element types are selected according to a different stressed member. The elastic modulus is 2.06×10⁵ MPa, the density is 7850 kg/m3 and the Poisson’s ratio is 0.2. The single column structure is not directly constrained to the seabed, but is fixed to the foundation by three steel pipe piles connecting the lower diagonal brace and the bottom plane support. The fixed constraints are adopted to the bottom of the model, and the boundary of upper part is free. The model is meshed by quadrilaterals. According to the structural characteristics and bearing capacity method, the calculation element type of the platform is shell63. And the calculation unit type of platform slant brace is pipe16. Since the structure is below the sea level, the element type of lower diagonal brace and steel pipe pile under the platform is pipe59. The main load-bearing component of a single column platform is the single column itself, and its simulated element is beam188. The simulated damage regions are combined for computational convenience, resulting in a combined single-column structure of 19 elements. Elements 1 to 9 are above the intersection of the lower diagonal brace and the single column. Elements 10-19 are below the intersection point of the lower diagonal brace and the single column.
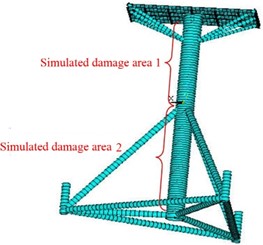
In this paper, based on previous research experience, the damage simulation method is implemented to reduce the unit stiffness of the simulated area by reducing cross-section area of the element. In order to truly reflect the damage situation of the model test, this article studied two damage scenarios, the fifth element of simulated damage area 1 and fifteenth element of simulated damage area 2, with damage rates of 12.5 % and 25 %, respectively as shown in Fig. 2.
Fig. 2Schematic diagram of simulated damage location for single column platform
4. Damage identification for simulated damage area 1
A damage is simulated by reducing the elastic modulus of element 5 to study damage identification in the selected damage area 1.
4.1. 12.5 % elemental damage
In the case of 12.5 % element damage, the frequencies of each order are measured when the structural frequency variates. That a series of frequency variation square ratios is generated as shown in Fig. 3. The deformation of each element of the structure under various orders of vibration is obtained by utilizing the obtained structural vibration modes. The series of “frequency variation square ratios” for each element of the structure are generated by Eq. (6).
By comparing the observed values with the calculated values of 19 elements, it was found that the calculated values of elements 4 to 7 were similar to the test values, as shown in Fig. 4.
In Fig. 4, only the calculated values for elements 4-7 are listed; the calculated values for the other elements are not listed due to their large differences. To determine the truly damaged elements, several elements with similar values need to be calculated according to Eq. (7). The specific values are shown in Table 2.
Table 2Detection of damaged elements according to Eq. (7)
Damaged unit number | 4 | 5 | 6 | 7 |
146.2 | 23.6 | 33.6 | 65.6 |
As it can be seen from Table 2, the value of for the element 5 is less than that for the other elements. So it can be determined that element 5 is the damaged unit.
Fig. 3Observed value of frequency variation before and after 12.5 % damage to the structure
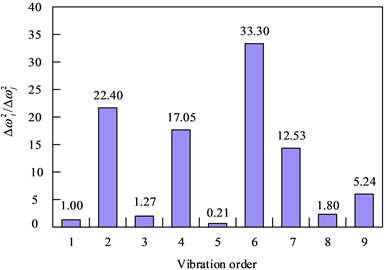
Fig. 4Calculated values from element 4 to element 7 with 12.5 % damage to the structure
a) Calculated value of element 4
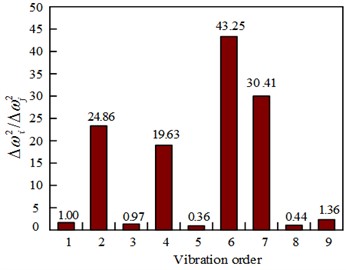
b) Calculated value of element 5
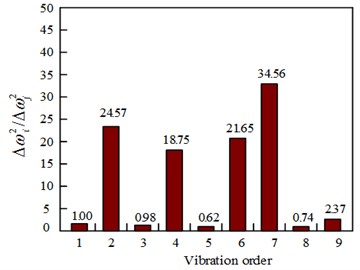
c) Calculated value of element 6
d) Calculated value of element 7
4.2. 25 % elemental damage
The case of 12.5 % destruction was studied in simulated destruction area 1 in the previous section, and the next step is to study the loss identification in the case of 25 % failure.
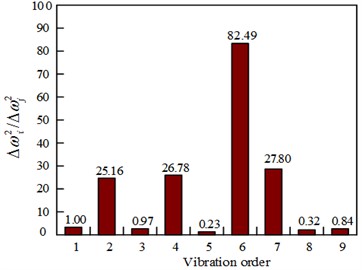
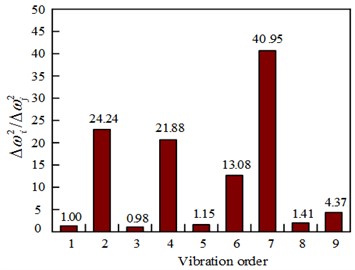
In this case (25 % element damage), the “frequency variation square ratios” different from the observed values for different normal elements are shown in Fig. 5. The calculated values for element 5 and element 6 at 25 % element damage are shown in Fig. 6.
The current situation is the same as the 12.5 % damage situation in element 5. Except the calculated values of element 5 are similar to the observed value, the calculated values of element 6 are also somewhat similar. Therefore, it is necessary to use Eq. (7) to calculate the adjacent elements to determine the truly damaged unit. The values are given in Table 3.
Fig. 5Observed value of frequency variation before and after 25 % damage to the structure
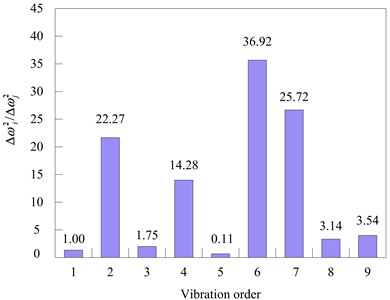
Fig. 6Calculated values of element 5 and element 6 with 25 % damage to the structure
a) Calculated value of element 5
b) Calculated value of element 6
Table 3Detection of damaged elements according to Eq. (7)
Damaged unit number | 4 | 5 | 6 | 7 |
121.05 | 7.61 | 19.83 | 47.24 |
As it can be seen from Table 3, element 5 is the damaged element because the value of element 5 is the smallest. That the value of of 25 % element damage was smaller, compared to the 12.5 % damage situation in element 5 indicated that the greater the degree of damage to the unit, the more accurate the damage identification results.
In the same operation as simulated damaged area 1, the damage of element 15 is simulated in simulated damaged area 2. The degrees of damage are12.5 % and 25 %, respectively, and finally it is proved that the damage location cannot be determined accurately. The reason is that because the substructure has slant support in addition to the column, the damage generated in the column has little impact on the structural frequency. Natural frequency, as an indicator of the overall stiffness parameter of the structure, reflects the current stiffness status of the structure. It is not sensitive to local damage with lower degree of damage, and the weak sensitivity of natural frequency to damage is more prominent in large structures.
After simulating damage on the platform, slant brace of platform, lower diagonal brace of platform, bottom plane support and Steel pipe pile, damages were still undetected through simulation calculation using the frequency change squared ratio method. The damage identification at the above locations can be attempted using the BP neural network method for detection.
5. Experimental validation of damage location on offshore oil platforms
The experiment was accomplished on a vibration table in the seismic laboratory of the Dalian University of Technology. The vibration table is an underwater earthquake simulation vibration table that the tests of combined effects of earthquakes, waves, and ocean currents can be simulated. The maximum horizontal acceleration of the vibration table is 1.0 g, and the maximum vertical velocity is 0.7 g. A fully digital control method in system control and 469D vibration simulation control system of the American MTS Systems were adopted. The system was driven by hydraulic servo, except for the three parameter feedback control. The main purpose is to extract the frequencies before and after the damage of the model structure through the dynamic structure test, so as to verify the adaptability of the “frequency variation square ratio” in the model structure. According to the similarity theory, the single column oil platform was modeled by increasing the weight of organic glass with a similarity ratio of 1:15. The physical parameter scale of test model is shown in Table 4.
Table 4The physical parameter scale of Single Pole Platform
Parameter name | ||||||||
Scale | 15 | 50 | 3.33 | 15 | 1 | 50 | ||
Annotation: : geometric scale; : elastic modulus scale; : density scale; : time scale; : displacement scale; : excitation acceleration that causes initial structural failure; : stress scale; : strain scale; : the ratio of displacement scale to geometric scale | ||||||||
The test model is fixed on the vibration table by connecting flanges with three steel pipe piles, and each flange is connected with four bolts. The single-column platform model is shown in Fig. 7.
Fig. 7Single column platform model on vibration table
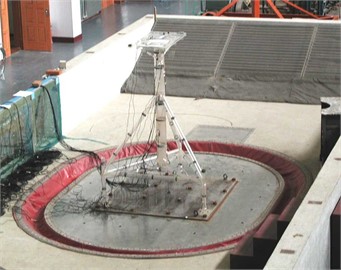
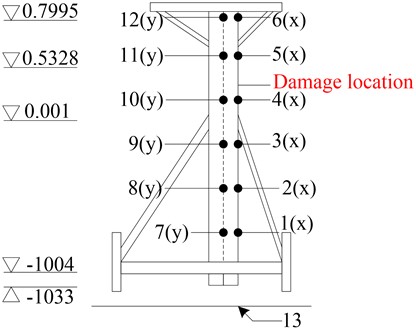
The vibration frequencies in the horizontal plane of the structure were extracted in two vertical directions ( and ). Six piezoresistive accelerometers capable of measuring acceleration signals on the , , and axes are installed on a single column in the and directions respectively. Simulating damage is achieved by cutting the model to reduce the cross-sectional area that was achieved by uniformly drilling holes on the damaged cross-section of a single column.
5.1. Dynamic characterization of healthy structures
After installing the vibration table on the model and before loading the seismic wave, small amplitude white noise is inputted to the vibration table for excitation testing. The acceleration response of the table and structure is measured, and the natural frequency, vibration mode, and other parameters of the structural model are obtained through the spectrum analysis method.
The structure is excited in the and directions using white noise acoustic waves of appropriate bandwidth to obtain that the fundamental frequency in the direction as 8.13 Hz and that in the direction as 9.88 Hz, as shown in Fig. 8.
Fig. 8Fundamental frequency in the x-direction and Y-direction of intact structure
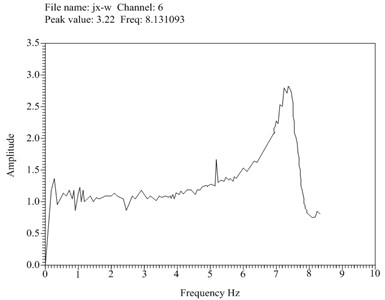
a) Fundamental frequency in the -direction of intact structure
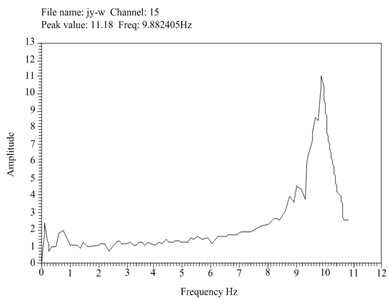
b) Fundamental frequency in the -direction of intact structure
This experiment aims to reduce the elastic modulus by cutting a cross-section 1.3 m away from the vibration table on a single column model. The cross-sectional area of the cut accounts for 12.5 % and 25 % of the total area, respectively, and the location of the cuts is shown in Fig. 9.
Fig. 9Diagram of installation location of acceleration sensors and damage location
White noise was still used to excite the structure and vibration time course data was extracted for analysis.
5.2. Dynamic properties of damaged structures
5.2.1. Dynamic characterization of structures with 12.5 % damage rate
When the damage rate is 12.5 %, the fundamental frequency is reached in both the and directions. The specific fundamental frequency in the direction is 8.01 Hz, and the fundamental frequency in the direction is 9.63 Hz.
5.2.2. Dynamic characterization of structures with 25 % damage rate
The results show that the fundamental frequency is 7.76 Hz in the direction and 8.63 Hz in the direction.
5.3. Damage location study based on experimental models
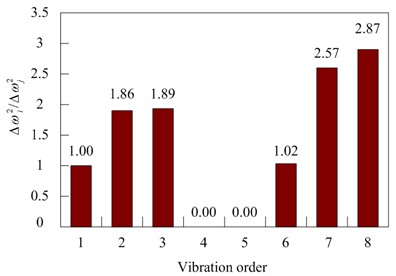
After 12.5 % damage, the first 8 orders of harmonics of the structure were obtained by dynamic testing. By comparing the first 8 orders of harmonics before and after damage, a series of “frequency variation square ratios” were derived. The data are shown in Table 5.
Table 5Variation of eigenvalues with degree of damage
Harmonics order | 1 | 2 | 3 | 4 | 5 | 6 | 7 | 8 |
Original form | 66.1 | 97.6 | 162.8 | 558.9 | 564.9 | 978.0 | 996.3 | 1735.2 |
Unit damage | 64.1 | 92.7 | 160.3 | 558.9 | 560.8 | 969.0 | 985.8 | 1722.9 |
Variations | 2.0 | 4.9 | 2.5 | 0 | 4.1 | 9.0 | 10.5 | 12.3 |
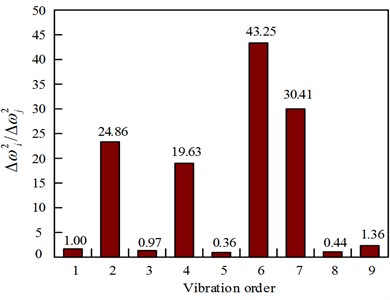
The histogram based on the data in Table 5is shown in Fig. 10, where the horizontal axis represents the vibration order and the vertical axis represents the “square ratio of frequency variation” value.
Fig. 10Observed value of frequency variation before and after 12.5 % damage to the testing model
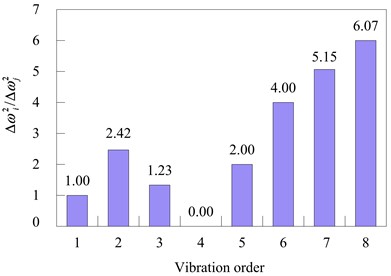
Fig. 11Calculated values of element 5andelement 6 with 12.5 % damage to the testing model
a) Calculated value of element 5
b) Calculated value of element 6
As it can be seen in Fig. 11, the element 5 and the element 6 are relatively similar, and other calculated values are not listed. To determine accurately the damage location, it is also necessary to use Eq. (7) to calculate for the neighboring element to determine the true damaged unit. The values are shown in Table 6.
Table 6Detection of damaged units according to Eq. (7)
Damaged element number | 4 | 5 | 6 | 7 |
3.50 | 0.33 | 1.60 | 2.01 |
From Table 6, it can be seen that the value of element 5 is significantly smaller than that of the other elements. Thus, it can be determined that element 5 is a damaged unit. Similarly, for the 25 % damage result, the recognition effect is still significant.
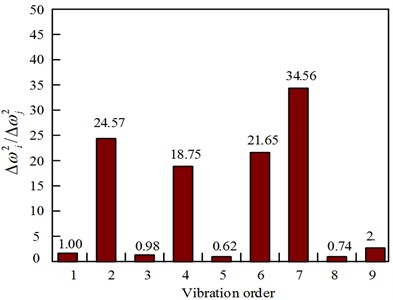
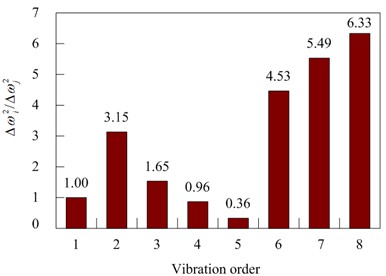
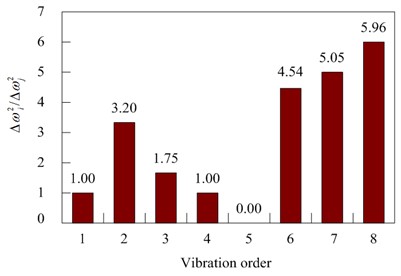
Fig. 12 is a histogram based on Table 7.
Table 7Variation of eigenvalues with degree of damage
Place an order | 1 | 2 | 3 | 4 | 5 | 6 | 7 | 8 |
Original form | 66.1 | 97.6 | 162.8 | 558.9 | 564.9 | 978.0 | 996.3 | 1735.2 |
Unit damage | 60.2 | 74.5 | 154.9 | 553.0 | 562.9 | 950.2 | 965.8 | 1699.5 |
Variations | 5.9 | 23.1 | 7.9 | 5.9 | 2.0 | 27.8 | 30.5 | 35.7 |
Fig. 12Observed value of frequency variation before and after 25 % damage to the testing model
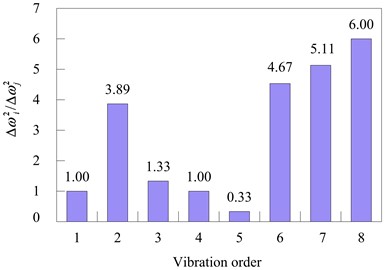
Fig. 13Calculated values of element 5 and element 6 with 25 % damage to the testing model
a) Calculated value of element 5
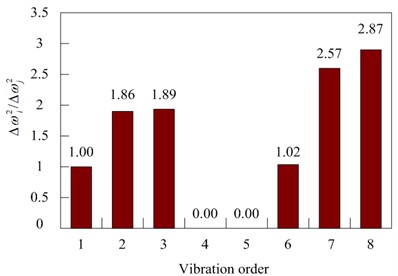
b) Calculated value of element 6
The values of element 5 and element 6 in Fig. 13 are similar. To ensure the damage location, Eq. (7) is used to calculate the values of some adjacent elements to determine which is the true damage unit. The values are shown in Table 8.
Table 8Detection of damaged units according to Eq. (7)
Damaged element number | 4 | 5 | 6 | 7 |
3.09 | 0.04 | 1.84 | 2.227 |
From Table 8 of , the value of element 5 is less than the other values. Therefore, based on the error of the identification results calculated by the Eq. (7), it can be understood that element 5 is a damaged unit.
The error of the recognition result calculated from Eq. (8) is shown in Fig. 14.
As it can be seen from Fig. 14, due to the complex structure of the marine single-column platform, there is a certain recognition error in the damage recognition results of different elements. However, in this method, the detection errors of all elements do not exceed 3 %, the actual damage detection is good, and the detection errors of all elements are within the acceptable range. This detection method (frequency variation square ratio) is conditionally accepted as the Method 1 implemented in this study and Literature [6], the wavelet packet transform component energy is the Method 2 to identify the structural damage, meanwhile the TRIM based method from the Literature [11] is introduced as the Method 3.The experimental results of the error comparison between element 5 identification results from these different methods are shown in Fig. 15.
Fig. 14Identification of damage errors on offshore platforms
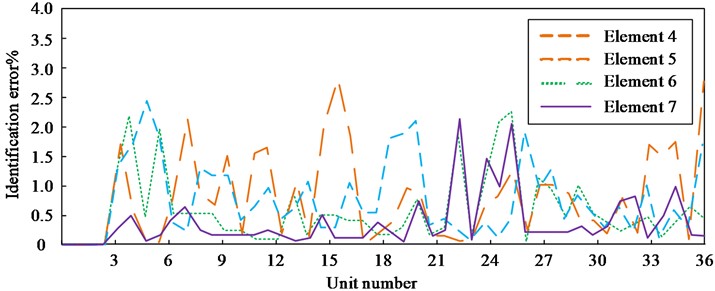
Fig. 15Error analysis of identification results for different methods
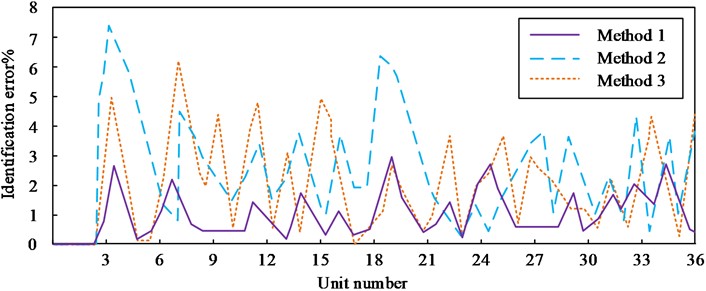
As it can be seen from Fig. 15, among the three methods, the proposed frequency-based single-column platform structure damage identification method 1 has the smallest identification error, and its detection error of element 5 does not exceed 3 %. Sensitivity-based finite element model update and wavelet packet transform component energy method 2 has the largest identification error with a maximum error of 7.2 %.
6. Conclusions
1) In the study of damage location of single column platform, the damage location of the upper part of single column structure (the section from the single column node bracing piece to the platform bracing) is relatively accurate; the damage location of the lower part of single column structure (the intersection of single column diagonal brace to the base part) is not obvious.
2) The method named “Frequency variation square ratio” is proved to be effective in this research where the damage degree was considered as 12.5 % and 25 %. With the increase of damage degree, the accuracy also increases. A new damage identification method is proposed for an offshore platform, which improves the current offshore platform damage detection technology applied and provides a reference for the damage identification and damage location for a single-column ocean platform in the future. Frequency is an easily obtainable dynamic characteristic of a structure. For structures that are difficult to extract dynamic characteristics, especially for damage identification of simply supported beams, pressure pipelines, bridges, and truss structures, the frequency method is the preferred solution.
3) The reason why the damage location effect of this method is not obvious in the lower half of single column structure is analyzed. In previous studies, “the square ratio of frequency variation ratio” has been successfully applied to simply supported beams, pressure pipelines, beam string structure and bridges. So, it is preliminarily estimated that the “frequency variation square ratio” method is suitable only for the whole beam structure. On the one hand, although this method has the function of damaging the location, it is susceptible influences from adjacent elements that potentially leads to an assessment error. For a large-scale damage, when dividing the structure into units, it is easy to divide the same damage into different units. On the other hand, low order frequencies are easy to obtain during actual testing, but they are often used to reflect the overall characteristics of the structure, resulting in poor identification of structural damage locations; High order frequencies contain spatial information of structures, but it is not easy to test and obtain in practical engineering. In existing research, there is relatively insufficient targeted research on structural types in existing literature. Damage identification indicators are affected by external parameters such as noise, number of sensors, and modal order. It is urgent to determine a reasonable damage identification indicator through parameter impact analysis of damage identification indicators. The use of the BP neural network methods for identifying the damage in this area is a field for a further research. The structural damage detection method based on neural networks has broad development prospects. But due to the need for a large number of samples for training in prediction data, complex structures may make the sample data too large and the neural network cannot converge. Therefore, further research is needed.
7. Prospect
1) In this article simulating the actual damage of the structure is achieved by reducing the stiffness of a certain element. However, the actual damage of the structure is a joint action of various damages. Further research is needed to accurately simulate the actual damage of the structure to achieve software analysis that is more in line with the actual situation.
2) Although a single damage location is located by the frequency variation damage index, the study of the variation pattern of coexisting frequencies in multiple damage states and how to locate damage, as well as how to locate damage in symmetric positions remain to be studied.
3) Natural frequency is an inherent property of the structure and a global parameter, from which relatively little damage information is obtained. The parameters derived from structural modal shapes are increasingly being used in research on structural damage identification.
4) When there is damage to a certain part of the structure, other parts of the structure still function normally. Combining neural networks, strain modes, perturbation theory, wavelet transform and dynamic fingerprints, modal strain which is sensitive to the location of structural damage can effectively identify and locate the degree of structural damage in different parts.
5) In order to generate a clean, quasi-static frequency response function for damage diagnosis, a structural damage detection scheme based on noise robust operating modes using impact synchronous modal analysis can be used. By utilizing the denoising characteristics of impact synchronous modal analysis, a noise robust damage detection scheme for operating machinery can be attempted. It can generate EMA (experimental modal analysis)-like or static-like FRFs (frequency response functions), which only contain structural dynamic information for damage assessment.
6) BP neural network belongs to shallow learning algorithms that are efficient when the data size is small or the data quality is good. However, shallow learning also has certain disadvantages, such as being prone to getting stuck in local optima, taking too long to compute, and becoming increasingly inadequate to meet the needs of the mega data era. Deep learning algorithms that can be adapt to contemporary needs.
References
-
N. Stubbs, J. T. Kim, and C. R. Farrar, “Field verification of a nondestructive damage localization and severity estimation algorithm,” Proceedings of the 13th International Modal Analysis Conference, Vol. 2460, p. 210, 1995.
-
G. J. Yang, “Disaster and environmental load in marine engineering,” (in Chinese), China Offshore Platform, Vol. 5, pp. 29–30, 1995.
-
X. Bao, T. Fan, C. Shi, and G. Yang, “Deep learning methods for damage detection of jacket-type offshore platforms,” Process Safety and Environmental Protection, Vol. 154, pp. 249–261, Oct. 2021, https://doi.org/10.1016/j.psep.2021.08.031
-
M. J. Wang, S. S. Sun, Z. Y. Xie, and Y. L. Wang, “Damage identification of ice-resistant jacket platforms based on Hilbert-Huang transform,” (in Chinese), Journal of Ship Mechanics, Vol. 25, No. 8, pp. 1106–1115, 2021, https://doi.org/10.3969/j.issn.1007-7294.2021.08.014
-
Y. F. Zhang, H. Yin, Z. R. Peng, X. P. Zhang, and K. L. Dong, “Model updating based on sensitivity analysis of displacement FRF,” (in Chinese), Journal of Vibration and Shock, Vol. 40, No. 17, pp. 63–69, 2021, https://doi.org/10.13465/j.cnki.jvs.2021.17.009
-
M. Razavi and A. Hadidi, “Structural damage identification through sensitivity-based finite element model updating and wavelet packet transform component energy,” Structures, Vol. 33, No. 10, pp. 4857–4870, Oct. 2021, https://doi.org/10.1016/j.istruc.2021.07.030
-
W. Y. Liu, J. Kong, and W. F. Duan, “Warpage test and finite element analysis of a stainless steel bolted connection,” (in Chinese), Progress in Steel Building Structures, Vol. 22, No. 6, pp. 94–100, 2020, https://doi.org/10.13969/j.cnki.cn31-1893.2020.06.010
-
V. Kahya, F. Y. Okur, S. Karaca, A. C. Altunışık, and M. Aslan, “Multiple damage detection in laminated composite beams using automated model update,” Structures, Vol. 34, No. 12, pp. 1665–1683, Dec. 2021, https://doi.org/10.1016/j.istruc.2021.08.117
-
X. Han, Y. Jiang, and S. Dong, “Interaction of irregular waves with vertical breakwater and characteristics of secondary wave generated by overtopping,” Journal of Ocean University of China, Vol. 20, No. 6, pp. 1353–1370, Nov. 2021, https://doi.org/10.1007/s11802-021-4718-z
-
B. Asgarian, V. Aghaeidoost, and H. R. Shokrgozar, “Damage detection of jacket type offshore platforms using rate of signal energy using wavelet packet transform,” Marine Structures, Vol. 45, No. 1, pp. 1–21, Jan. 2016, https://doi.org/10.1016/j.marstruc.2015.10.003
-
Z. P. Xia, S. Q. Wang, M. Q. Xu, and H. Y. Wang, “Structural damage identification based on TRIM,” (in Chinese), Journal of Vibration and Shock, Vol. 38, No. 17, pp. 251–259, 2019, https://doi.org/10.13465/j.cnki.jvs.2019.17.035
-
J. K. Vandiver, “Detection of structural failure on fixed platforms by measurement of dynamic response,” Journal of Petroleum Technology, Vol. 29, No. 3, pp. 305–310, Mar. 1977, https://doi.org/10.2118/5679-pa
-
R. D. Begg, A. C. Mackenzie, C. J. Dodds, and O. D. Loland, “Structural integrity monitoring using digital processing of vibration siqnals,” in Offshore Technology Conference, Vol. 5, pp. 305–311, Apr. 2013, https://doi.org/10.4043/2549-ms
-
O. Loland and C. J. Dodds, “Experiences in developing monitoring systems and operating integrity in the North Sea,” in Offshore Technology Conference, pp. 313–320, Apr. 2013, https://doi.org/10.4043/2551-ms
-
J.-T. Kim and N. Stubbs, “Improved damage identification method based on modal information,” Journal of Sound and Vibration, Vol. 252, No. 2, pp. 223–238, Apr. 2002, https://doi.org/10.1006/jsvi.2001.3749
-
G. Hearn and R. B. Testa, “Modal analysis for damage detection in structures,” Journal of Structural Engineering, Vol. 117, No. 10, pp. 3042–3063, Oct. 1991, https://doi.org/10.1061/(asce)0733-9445(1991)117:10(3042)
-
J. Xie and D. J. Han., “An improved method for structural damage identification based on frequency measurement,” (in Chinese), Engineering Mechanics, No. 1, pp. 21–25, 2004, https://doi.org/10.3969/j.issn.1000-4750.2004.01.004
About this article

The authors have not disclosed any funding.
The datasets generated during and/or analyzed during the current study are available from the corresponding author on reasonable request.
Tengge Sun proposed the research topic, investigated and sorted the literature, designed the research program, investigated and collated the literature, conducted a statistical analysis, obtained the research funds; Qinghua Ai implemented the research process, designed the framework of the paper, collected and organized the data, drafted the paper, and provided technical material support, implemented the research process, revised the paper, and provided relevant suggestions. All authors have read and agreed to the published version of the manuscript.
The authors declare that they have no conflict of interest.
