Abstract
Geological faults impair tunnel stability during earthquakes. This study establishes a tunnel dynamic stability evaluation index based on load/unload response ratio (LURR) theory. It considers a seismic wave as a load/unload parameter and tunnel structure strain response as a response parameter. The rationale behind this evaluation index and the factors affecting tunnel stability across fault zones under seismic conditions are investigated. Compared to the traditional dynamic instability criterion, the LURR accurately measures the degree of structural deviation from the steady state and better determines the potential destabilization region of the structure. As the peak value of the input seismic wave increases, the LURRs of the more unstable parts increase, while the LURRs of the stable parts remain unchanged. According to LURR theory, the size of the range affected by the fault on the tunnel during an earthquake depends mainly on inherent fault properties (i.e., the dip angle, strike, and thickness), independent of the earthquake intensity. Because the LURR can theoretically be infinite, its dynamic instability threshold cannot be determined accurately.
1. Introduction
There is a significant empirical relationship between the stability of an underground project (e.g., a tunnel) and the surrounding geotechnical body. The presence of discontinuous surfaces (e.g., faults, joints, and folds) degrades the geological conditions of the section. It was previously found [1] that most of the damage encountered in tunnels arises from such discontinuities, which tend to favor further damage and exacerbate its extent. In addition, fault-zone tunnels appear more sensitive to seismic loading. According to an earthquake damage survey and a previous study [2], the area and severity of earthquake damage in a fault zone and the surrounding tunnels within a certain area of influence significantly exceed those in the general section of the tunnel.
Although current standards recommend tunnel designs that avoid adverse geological conditions, such as fault zones, it is impossible to avoid all fault zones during the construction of medium and large tunnels in high-seismic-intensity areas. In such areas, subways, highways, and water-transmission tunnels are susceptible to earthquake damage. This strongly motivates the further study of the dynamic response and seismic reduction of tunnels crossing fault zones during earthquakes.
Shaking-table experiments simulate the dynamic response characteristics of an underground structure, its interaction and the surrounding medium. The challenge of this method is to simulate faults in the model test. Fang et al. [3] studied and observed the dynamic response of tunnels across fault zones under seismic effects by simulating faults and the surrounding rocks with different fit material ratios. Fan et al. [4] chose 10-20 mm of gravel to simulate the tunnel fault zone. Liu et al. [5] simulated the viscous slip misalignment of a fault by jacking up and down according to the characteristics of positive and negative faults.
The increasing maturity of finite-element software has enabled the analysis of the rock pressure and deformation around a tunnel, as well as the internal force distribution of the support structure and the dynamic time curve of the tunnel under earthquake loads. This provided insight into the response mechanism of the tunnel under earthquake loads in the fault and broken zones. Wang et al. [6] developed a fully three-dimensional (3D) dynamic finite-element model to evaluate the seismic response effects of fault zones on tunnels by introducing global damage parameters. Varma et al. [1] performed a shaking-table experiment on a tunnel using the universal distinct element code to analyze the effect of discontinuous surfaces with different inclination angles and material parameters on the tunnel stability under dynamic loads.
The dynamic response and seismic mitigation of tunnels crossing fault zones during earthquakes have been widely studied. However, systematic results remain lacking. Some seismic reduction construction methods are still largely empirical, and there is no generally accepted underlying theory. China’s current guidelines require the strengthening of the lining structure of tunnels located in a fault zone; however, it does not specify the scope of the seismic reinforcement. In addition, the dynamic instability criteria for tunnel structures are determined mainly by static instability indicators, such as ultimate displacement and plastic zone shape, which cannot effectively reflect the dynamic structure characteristics. Given that tunnel instability is a prominently nonlinear phenomenon, assessment methods must be based on nonlinear theory [7]. The load/unload response ratio (LURR) theory focuses on the dynamic characteristics of nonlinear stability changes. It has been applied for assessing rock material fracture failure [8], [9], earthquake risk [10], slope stability [11], [12], and structural failure [13]. However, only some studies of tunnel stability have used the LURR theory, focusing on static stability analysis [7].
This study introduces an LURR theory to determine the seismic dynamic stability of tunnel structures. The principles and calculation methods are described systematically below. The correlation between the tunnel dynamic stability and LURR is analyzed, and a quantitative method is proposed for determining the dynamic tunnel instability based on the LURR theory. The method is applied to study the range of the longitudinal influence of different faults on a tunnel structure during an earthquake. The results provide insight for studying the seismic protection range of tunnel structures across fault zones.
2. Application of the LURR theory to tunnel dynamic calculations
2.1. Definition of the LURR
The LURR theory, proposed by in et al. [14] and first applied to earthquake prediction [15], is now widely used for analyzing nonlinear systems (e.g., structural seismic resistance and landslides). The basic concept is outlined in Fig. 1.
Fig. 1Load-response relationship for nonlinear systems [13]
![Load-response relationship for nonlinear systems [13]](https://static-01.extrica.com/articles/23284/23284-img1.jpg)
In the stabilization phase, the system load/unload paths are identical, and the ratio of response to load under load/unload conditions are equal. When the system is unstable, the load/unload paths vary owing to changes in the internal material properties. Under a given load increment, the corresponding response sizes differ for loading and unloading. The ratio difference between the two paths increases with instability. Therefore, the LURR value , of the system can be used to describe the degree of deviation from the steady state quantitatively.
2.2. Calculation and parameter determination of the load/unload process
Applying the LURR theory to the stability determination of geotechnical engineering (such as landslides and tunnels) presents two challenges. The first challenge is to define the load/unload process; the second is to determine the load and response parameters. The reliability of the calculation hinges on these issues.
The calculation method used for the load/unload process is either discrete or continuous. Some studies refer to the discrete method as “interval direct averaging” [16], [17] or “mean statistical method” [11]. It represents the system load as a discrete time series, with the load parameters selected according to the actual situation. The duration and time interval of the time series are selected according to the time scale of the study object (e.g., on time scales of seconds for an earthquake load). The load/unload period can be of the order of days or months in the case of rainfall-type landslides.
The time series is divided into several load/unloading intervals. In the th interval, all the parameters are categorized as loading and unloading parameters according to the loading and unloading criteria. If 0 is used as the dividing threshold, all positive parameters are loading parameters, and all negative parameters are unloading parameters. The response parameters fall into analogous categories. The LURR value , for the th interval is:
where and are the numbers of load and response points, respectively, in the th interval; and , , , and are the loads and responses at a certain moment of the load/unload process, respectively.
The continuous method involves fitting the data points of the loading and unloading paths, and then obtaining the LURR value at point by calculating the ratio of the slopes of the loading and unloading paths at that point [13]. Hence, the LURR value for the th point is:
where and denote the increments of load and response , respectively. This method is more consistent with the original definition of the LURR theory.
2.3. Problems and treatment of the LURR theory in tunnel dynamics calculations
Some studies have treated positive loads and responses (i.e., above-average loads and responses) over a time interval as “loaded” load and response values. In contrast, negative loads and responses (below-average) have been treated as “unloaded”. This has successfully addressed problems where scalar quantities (e.g., rainfall and reservoir levels) are used as loads [11]. However, in seismic dynamic analysis, where the acceleration represents the seismic wave, positive and negative values represent the opposite directions in a seismic-wave vibration. If only positive and negative values are used as the judging criteria for loading and unloading, the reverse loading process of seismic waves is neglected, leading to distortions in the calculation results.
When selecting the response parameters, because the velocity and displacement are determined by, respectively, a single and double integration of the acceleration, the system is in a critical state of load/unload when the acceleration value, as load input, equals 0. At this time, the response velocity of the mass is maximum, while the response displacement still rises or falls. This causes hysteresis in the partial response and nonconformity between the response and load. This phenomenon was also observed in the dynamic analysis of slopes by [12].
Complementing the above analysis, the following points are important for selecting appropriate parameters to describe the system load and response:
1) The parameters selected for the load and response should have a clear physical meaning.
2) There should be no derivative relationship between the load and response parameters, as this will introduce hysteresis in the response.
3) In principle, the parameters selected as the response should be expressed differently in the stable and unstable states, and the change in the response should become more significant as the system deviates from the stable state.
Therefore, this study considered the reverse loading process of seismic waves based on a discrete time series. The stress time history of seismic waves was selected as the input load of the system. The strain of the structure was taken as the response parameter to calculate the LURR. Hence, the stability state of the tunnel structure was analyzed.
2.4. LURR calculation process for tunnel structures under seismic loading
Let denote the load time series of the input system, and the corresponding response time series. Then:
If 0, the point is the loading point of the seismic load, denoted as . Alternatively, if 0, the point is the unloading point of the seismic load, denoted as . We also have:
If 0, the point is the loading point of the seismic response, denoted as . If 0, the point is the unloading point of the seismic response, denoted as .
The time series are divided into several intervals, for which the LURR values are calculated as:
where , , and are the numbers of data, response, and load points, respectively, in this interval, and , , , and are the average load and response values during seismic loading (+) and unloading (–), respectively, in the interval.
The input stress is used as the system load parameter, and the strain as the response parameter. Thus, the interval LURR can be expressed as:
where is the stress tensor form, and is the strain tensor form.
According to the incremental theory of geotechnical plasticity, the strain increment comprises elastic and plastic components:
If the tunnel structure is in an elastic state within this time interval and the plastic strain increment is zero, we have:
Then, the strain increment of the tunnel structure during the loading process is the elastic strain increment, and the elastic strain increment recovers in the unloading process:
The generalized Hooke’s law formulates a linear relationship between the stress and strain increments during the elastic phase:
Then the LURR becomes:
which indicates that the tunnel structure is in a stable state.
If the tunnel structure changes from the elastic to the plastic state during loading, the strain increment during loading consists of the elastic and plastic strain increments, and the plastic strain increment does not recover during unloading:
Consequently, 1 indicates that the tunnel structure deviates gradually from a stable state. As increases, the plastic strain increment also increases and the overall tunnel structure becomes more dangerously unstable.
3. Rationality analysis of dynamic tunnel stability using the LURR theory
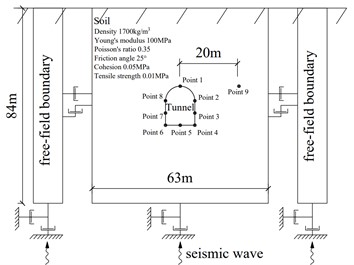
We compared our results with those of Yan et al. [18] to verify the reasonableness of the LURR theory for determining the tunnel dynamic stability in tunnels. Dynamic calculations for an unlined soil tunnel (dimensions 3×24×4 m) were performed using the FLAC3D finite-difference software. The tunnel burial depth was 40 m. To eliminate the influence of boundary conditions on the calculation results, the boundary range of the model was set to 10 times the size of the tunnel diameter. The overall size of the calculation model was hence, 63×24×84 m. The soil was considered to be elastoplastic and the Mohr-Coulomb yield criterion was used. The physical and mechanical parameters are listed in Table 1. Local damping was chosen, consistent with Yan et al. [18], with a damping factor of 0.15.
Table 1Physical and mechanical parameters of the soil tunnel used in the numerical solutions
Density (kg/m3) | Young’s modulus (MPa) | Poisson’s ratio | Friction angle (°) | Cohesion (MPa) | Tensile strength (MPa) |
1700 | 100 | 0.35 | 25 | 0.05 | 0.01 |
Static model calculations were performed first to obtain the stress distribution in the surrounding rock after tunnel excavation. Seismic loads were applied to perform dynamic calculations for unlined earth tunnels. To eliminate the effect of seismic wave reflection on the boundary, a free-field boundary was used around the model to simulate an infinite field, and a quiet boundary was used at the bottom of the model to absorb the incident waves during the dynamic calculation. To study the dynamic response law of tunnel loading/unloading, nine monitoring points were distributed at critical points inside the model to record the strain response of the mass points during the earthquake. Monitoring points 1-8 were located near the tunnel face, and monitoring point 9 was located deep in the surrounding rock away from the tunnel face. The model boundary conditions and the distribution of the monitoring points are shown in Fig. 2.
Fig. 2Model boundary conditions and monitoring point arrangement
Yan et al. [18] selected a discounted Kobe wave as the input seismic wave for the model, with a peak acceleration of 1.25 m/s2 and holding time of 16 s. To investigate the effects of different peak ground accelerations (PGAs) on the stability of soil tunnels, Kobe waves with discounted PGAs of 1.25 and 2.50 m/s2 were selected as input seismic waves with a holding time of 16 s (Fig. 3). In the dynamic calculation, the bottom of the model was a quiet boundary, and the forces on the quiet boundary were calculated from the velocity components at the boundary. If the velocity or acceleration load was input again, the quiet boundary was invalidated. Therefore, it was necessary to convert the ground vibration load into a stress time history using Eq. (14) and then input the model through the quiet bottom boundary:
where, is the tangential stress applied to the quiet boundary, is the model material density, is the S-wave velocity, and is the tangential velocity component at the model boundary.
Because the strains are directional, the LURRs obtained by selecting strains in different directions as response parameters also differ. This cannot truly reflect the response of the structure to the earthquake. Hence, the two-norm of the strain () was adopted as the response parameter, as it converts the strain values in each direction to a unique number and quantifies the dynamic response of the structure more comprehensively as:
The LURR of the monitoring point can be obtained using the stress time history of the seismic load as the system load parameter and as the system response parameter.
Fig. 3Time-history of input acceleration
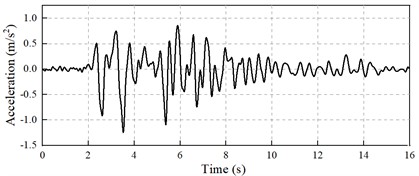
Fig. 4LURR time history curves of each monitoring point under different PGA conditions
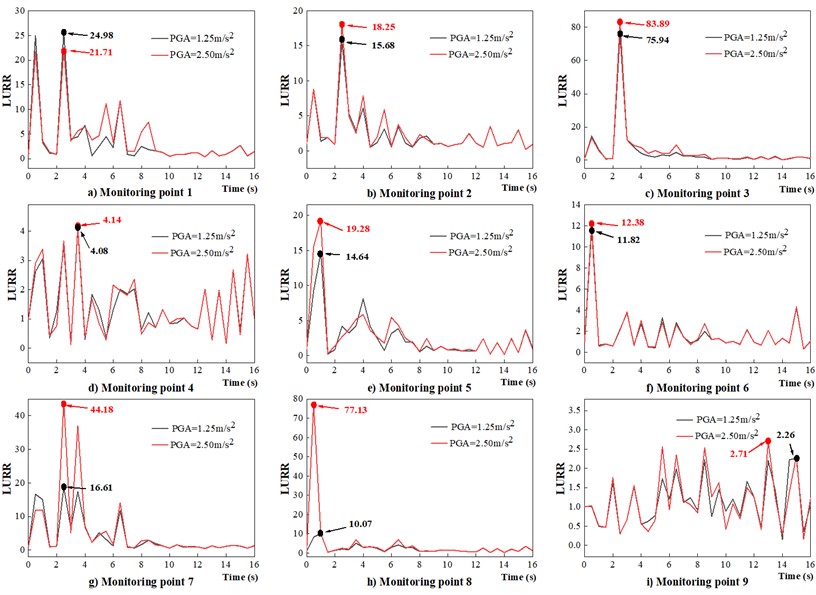
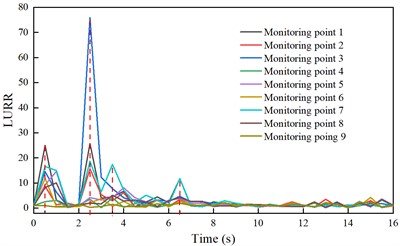
When the PGA is 1.25 m/s2, the maximum displacements of the arch crown of the model presented in this paper and of the model of Yan et al. [18] are 8.79 and 9.72 mm, respectively. The maximum side-wall displacements are 12.35 and 13.32 mm, respectively. The numerical model presented in this paper is accurate to within the displacement error (1 mm), and is therefore plausible. Figs. 4-5 plot the LURR time-history curves at each monitoring point. According to the above analysis, the structure is considered stable when the LURR is approximately 1. As shown in Fig. 4, the LURR at monitoring point 9, located deep in the surrounding rock, fluctuates within the (0, 2) interval during the process, indicating that the point remains stable during the earthquake. Most of the LURR time-history curves at monitoring points 1-8 near the tunnel face fluctuate sharply, and the maximum LURR value at each point is much greater than 1. This indicates different degrees of destabilization damage in each part of the tunnel section in the earthquake project. The calculation results reveal relatively uniform LURR curves at each monitoring point during the same earthquake (Fig. 5). However, the amplitude varies at each point, owing to the variations in the stability between points. At 0.5 s, the seismic wave has not yet peaked, and the first wave peak appears in the LURR curve at each monitoring point. This indicates that the surrounding rock system generates a very large response after entering the vibration state from rest; this is consistent with the results of Yang et al. [17]. In the subsequent vibration, the LURR peak times at each monitoring point are 2.5, 3.5, and 6.5 s, and are consistent with the peak acceleration time of the input seismic wave. After 9 s, the LURR at each monitoring point fluctuates less with seismic action until the action terminates.
Fig. 5LURR time history curves of each monitoring point under PGA = 1.25 m/s2
The LURR varies considerably between the monitoring points. The maximum LURR under seismic action in earth tunnels occurs at the side wall. As the PGA increases, the LURRs at the monitoring points increase to different extents, and the maximum LURRs of sensitive parts, such as side walls, increases significantly. For example, the maximum LURRs of monitoring points 3, 7, and 8 increase by 7.95, 27.57, and 67.06, respectively. Moreover, for highly stable parts, the maximum LURR variation is equal to or less than 1. As the PGA increases, the stability of the earth tunnel decreases, and the side walls and parts near the arch crown are most vulnerable to seismic loading. These parts belong to the potential damage area and deserve particular attention when planning seismic reinforcement in practice. The base plate is less susceptible to seismic loads. These conclusions are consistent with those reported by Yan et al. [18], thus indicating that the LURR is appropriate for determining the dynamic tunnel stability.
4. Stability analysis of tunnels across fault zones under seismic loading
Section 3 verified the rationale of using the LURR theory to analyze the dynamic stability of the tunnel through the unlined earth tunnel model. In this section, the theory is used to study the range of the longitudinal influence of different faults on a tunnel structure during an earthquake.
4.1. Definition of the intersection angle of the fault and tunnel
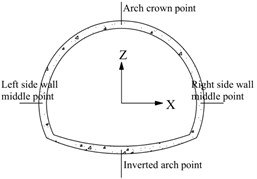
This study considers a single fault, intersecting the horizontal and longitudinal axes of the tunnel at different angles, to study the effect of the fault system on the seismic behavior of tunnels. Most 2D models have only been used to study the different intersection angles between a fault and tunnel cross section [6]. However, in realistic engineering, the intersection geometry position between a fault and tunnel must be determined by the dip and strike of the fault. The present study defines the spatial position relationship between the two angles: , defined as the angle between the fault plane and horizontal plane (-axis) of the tunnel, see Fig. 6(a); and , defined as the angle between the tunnel cross section (-axis) and the fault strike, see Fig. 6(b).
4.2. Numerical model and parameters
To assess the range of influence of the fault system on the seismic behavior of the tunnel structure, a 3D model with a tunnel, a fault, and surrounding rock was constructed as shown in Fig. 7. The -axis was directed along the transverse direction of the tunnel, -axis along the longitudinal direction, and -axis along the vertical direction. The model dimensions in the three directions were 90, 300, and 90 m, respectively. The cross-fault tunnel was divided into three parts according to the relative positions of the fault system and tunnel. The tunnel fault section (henceforth referred to as the “fault section”) was on the range where the tunnel intersects the fault. The ordinary section of the tunnel (the “ordinary section”) was located far from the fault and was not affected by it. The section affected by the tunnel fault (the “affected section”) was the tunnel range that did not intersect with the fault but was still affected by it. This range was the focus of this study. The maximum grid size of the model was 3 m, meeting the requirements of dynamics calculation accuracy. The dynamics calculations were based on the FLAC3D finite-difference software. The tunnel span was 13 m, and the tunnel geometry location and monitoring points were arranged as shown in Fig. 8.
Fig. 6Definition of the intersection angles of the fault and tunnel
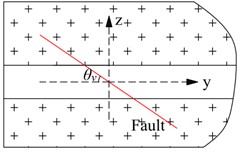
a) Right view
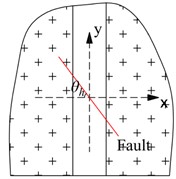
b) Top view
Fig. 73D model of the tunnel-fault system
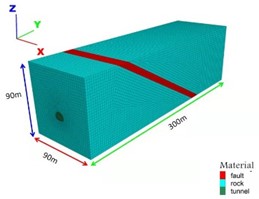
Fig. 8Tunnel model diagram
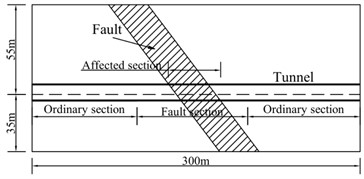
a) Longitudinal section
b) Arrangement of monitoring points
The simulation was divided into three steps to reflect the actual construction process.
Step 1: Before the tunnel excavation, the model balanced the initial stress field according to the self-weight stress. The model is constrained by the displacement at the bottom and around it.
Step 2: A full-section excavation of the tunnel was conducted. The excavation length of each step was 2 m. After completing each step of the excavation cycle, a lining with a thickness of 60 cm was applied. The surrounding rock and lining materials were considered elastic-plastic bodies, and the Mohr-Coulomb yield criterion was used. The “interface” element was used to simulate the contact between fault and surrounding rock. The model parameters of the rock mass, interface, fault, and lining used in this study under static and dynamic conditions are listed in Table 2.
Step 3: The third step was the dynamic response calculation. A free-field boundary was applied around the model, and a quiet boundary was applied at the bottom of the model. Rayleigh damping was adopted, with a critical damping ratio of 5 % according to the model self-oscillation frequency. The Kobe wave was used as the seismic wave for the model input (Fig. 3). Because S-waves have a larger amplitude than P-waves, seismic waves were used input as S-waves and they propagated along the -axis from the bottom to the top of the model, with the direction of vibration being the -axis.
Table 2Geomechanical properties of the rock and fault used in the numerical solutions
Material | Rock mass | Fault | Rock-Fault interface | Lining |
Density (kg/m3) | 2.0×10³ | 1.8×10³ | – | 2.5×10³ |
Elastic bulk modulus (MPa) | 1.33×10³ | 1.67×10³ | – | 1.72×10⁴ |
Elastic shear modulus (MPa) | 4.44×10² | 3.57×10² | – | 1.29×10⁴ |
Poisson’s ratio | 0.35 | 0.40 | – | 0.20 |
Friction angle (°) | 25.00 | 20.00 | 17.00 | 54.00 |
Cohesion (MPa) | 0.12 | 0.08 | 0.05 | 2.42 |
Stiffness-normal (N·m-3) | – | – | 109 | – |
Stiffness-shear (N·m-3) | – | – | 109 | – |
Tensile strength (MPa) | 1.00 | 0.50 | 0.10 | 2.00 |
4.3. Outlier detection mechanism based on boxplot
To determine the longitudinal influence range of the fault zone on the tunnel structure during an earthquake using the LURR, 560 monitoring points were placed at 1 m intervals at the arch crown, in the middle of the left and right sidewalls, and at the bottom of the inverted arch to monitor the strain response time curve of the lining structure. The maximum value of the LURR for each monitoring point during the earthquake was calculated. The stability of the tunnel structures within the influence range of faults was poor, causing the LURR in this range to be significantly greater than that outside the influence range. The longitudinal influence range of the fault zone on the tunnel structure under the action of an earthquake could be determined by finding the locations of the monitoring points corresponding to the anomalies.
A boxplot is a statistical graph used to show the discretization of data. It can also be used to judge outliers. In practice, boxplots have been shown to be reliable for processing and identifying abnormal data. In the boxplot, is the lower quartile of the data group, is the upper quartile, and IQR is the difference between and . In this study, 1.5 was used as the outlier coefficient. The data was considered anomalous if it exceeded or was less than .
4.4. Results and analysis
The effects of faults on the seismic performance of the tunnel structure were investigated for different fault angles, fault thicknesses, and PGAs. Table 3 lists the parameters used in the model tests.
Table 3Parameters used in seismic behavior analysis of tunnels across fault zones
Section | (°) | (°) | Thickness (m) | Max. Acc. (g) |
1 | 30, 45, 60, 75, 90 | 0 | 4 | 0.2 |
2 | 90 | 0, 15, 30, 45, 60 | 4 | 0.2 |
3 | 30 | 0 | 1, 4, 8, 16 | 0.2 |
4 | 30 | 0 | 4 | 0.1, 0.2, 0.3, 0.4, 0.5 |
4.4.1. Effect of the fault dip angle.
To analyze the effect of the fault dip on the damage range of the tunnel structure experiencing seismic dynamics, the midpoint of the intersection of the fault and tunnel was used as the origin of the tunnel -axis. The strain time curves for the monitoring points at the arch crown, bottom of the inverted arch, and midpoint of the side walls within 140 m on either side of the -axis origin were extracted. For each measurement point, the LURR time curve was calculated, and the maximum LURR value was selected. The distribution curve of the LURR maxima in each part of the tunnel along the tunnel -axis was plotted, and the tunnel range affected by the fault was judged based on the anomalous values.
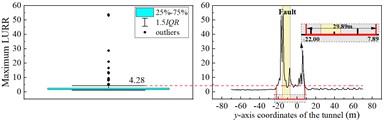
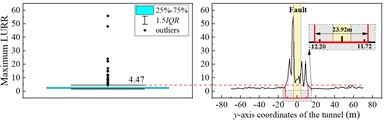
As an example, we consider an LURR-based stability analysis of cross-fault tunnels with 30°. Fig. 9 plots the distribution curve of the maximum value of the LURR along the tunnel -axis, for each monitoring position, at 30°.
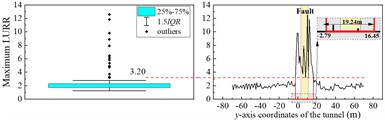
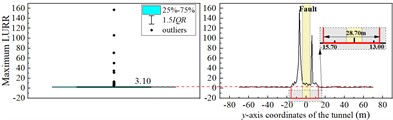
In the ordinary section away from the fault, the maximum value of the LURR at the arch crown fluctuates slightly above and below two. The maximum value of the LURR at the arch crown fluctuates sharply in the range of the -axis (−22,7.89), indicating that the arch crown has entered the influence range of the fault. A maximum LURR of the arch crown of 53.83 appears at the intersection with the fault-surrounding rock interface. The distribution of the LURR maximum value at the bottom of the inverted arch and midpoint of the side walls along the y-axis of the tunnel is similar to that of the arch crown. In the ordinary section of the tunnel, the maximum LURR at different monitoring points shows small fluctuations near a value of 2, and the tunnel structure remains generally stable. After entering the affected section, the maximum LURR values at each monitoring point shows large fluctuations. Simultaneously, peaks appear at the intersection of the fault-surrounding the rock interface and tunnel structure, indicating that the fault significantly affects the stability of the tunnel structure under seismic action. Significant dynamic instability occurs in the tunnel structure near the fault, making the intersection of the fault-surrounding rock interface with the tunnel structure the most dangerous part. The -axis ranges of the tunnel with large fluctuations in the maximum values of the LURR at the arch crown, bottom of the inverted arch, and midpoints of the left and right sidewalls are (–22, 7.89), (–2.79, 16.45), (–15.70, 13.00), and (–12.20, 11.72), respectively. The range of the affected section in this condition is (–22, 16.45), totaling 38.45 m. The range of the tunnel fault section in this condition is (–15.25,10.93), totaling 26.18 m.
Fig. 9Maximum LURR distribution curve along the tunnel y-axis
a) Arch crown
b) Inverted arch
c) Left side wall
d) Right side wall
Fig. 10 shows the displacement distribution curve along the tunnel -axis for 30°. Under the effect of an earthquake, in the ordinary section of the tunnel, the convergence value of the tunnel vertical displacement (the difference between the vertical displacement of the bottom of the inverted arch and arch crown) fluctuates slightly at 5 mm. In the affected section of the tunnel, settlement occurs at the arch crown, and a slight uplift occurs at the bottom of the inverted arch. The maximum vertical convergence of the tunnel occurs at the intersection of the fault-surrounding rock interface with the arch crown, reaching 57 mm.
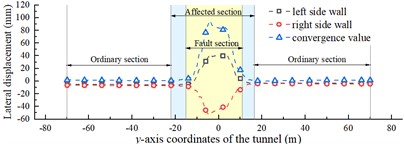
In the ordinary section, the convergence value of the tunnel lateral displacement (the difference between the lateral displacement at the midpoint of the left wall and that of the right wall) fluctuates slightly at approximately 1 mm. The affected section shows a tendency for the midpoint of the left sidewall to converge toward the center of the tunnel, but no abrupt change occurs. In the fault section, the convergence value of the tunnel lateral displacement increases rapidly, reaching a maximum of 96 mm where the fault-surrounding rock interface intersects the tunnel side wall. This indicates that the middle wall is the weak part of the tunnel structure, when excited by lateral ground vibrations. Liu et al. [19] drew a similar conclusion.
Fig. 10Displacement response of the tunnel under θv= 30°
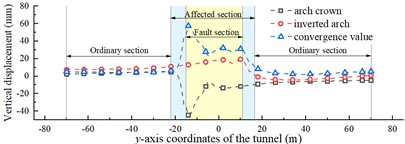
a) Vertical displacement
b) Lateral displacement
During the earthquake, the vertical displacements of the inverted arch and arch crown of the ordinary section of the foot wall are 7-9 and 3-5 mm, respectively, and those of the ordinary section of the hanging wall are –3 to 0 and –8 to –5 mm, respectively. The earthquake triggers the displacements of the fault and the surrounding rocks asynchronously, leading to further fault dislocation. Owing the dependence of the tunnel structure on the strata, a dislocation of approximately 10 mm occurs where the tunnel intersects the fault. This is the main reason for the sudden increase in the LURR at this site and for the instability failure. The LURR in the fault section at the nonintersecting position is relatively small but still exceeds that in the ordinary section. This indicates that, in cross-fault tunnels, fault dislocation is the leading cause of dynamic tunnel instability, and seismic vibration and fault material weakness are secondary causes. This conclusion is consistent with the findings of Cui et al. [20].
Fig. 11Range of the tunnel affected section and fault section under different fault dip angle θv
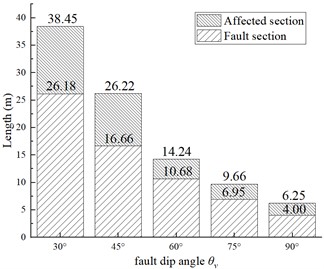
Fig. 11 compares the range of the affected and fault sections at different fault dips ( 30°, 45°, 60°, 75°, and 90°). The range of the affected and fault sections gradually decreases as increases. When 90°, the extents of the affected section and fault section are 83.74 and 84.72 % smaller than those for 30°, respectively. The convergence values of the displacements in the ordinary section of the tunnel do not vary significantly with . They all fluctuate within a small range and remained generally stable, but there are significant differences in the affected section (Fig. 12). As decreases, the displacement convergence value in the affected section gradually increases. As it approaches the intersection location of the fault-surrounding rock interface with the tunnel, the displacement convergence value increases. When decreases from 90° to 60°, the increase in its lateral and vertical displacement convergence value is significantly smaller than when decreases from 60° to 30°. For the present analysis, one can conclude that tunnels crossing minor dip faults should be avoided as much as possible during the tunnel design phase. Longitudinal seismic protection measures are necessary when the tunnel crosses a fault. Especially in an area where the fault-surrounding rock interface intersects the tunnel, cross-sectional seismic protection measures should be strengthened to prevent the structural damage caused by fault movements.
Fig. 12Displacement convergence value along the tunnel y-axis under different fault dip angle θv
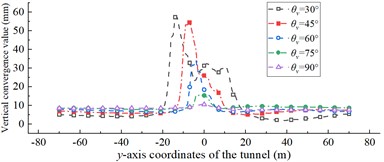
a) Vertical convergence value
b) Lateral convergence value
4.4.2. Effects of the fault strike
Fig. 13 compares the extent of the affected and fault sections for 0°, 15°, 30°, 45°, and 60°. When 0°, the tunnel crosses the fault zone orthogonally. The affected section and fault section ranges are minimal. As increases, the affected and fault section ranges increase gradually. For 0° 45°, the range of the affected section expands by 3-7 m for every 15° increase; however, the range of the affected section increases by 16.48 m relative to 45° for 60°. This shows that, as increases, the extent of the affected section also increases. Therefore, in an actual tunnel construction, the tunnel should be made orthogonal to the fault strike at a large angle.
Fig. 13Range of the tunnel affected section and fault section under different fault strike θh
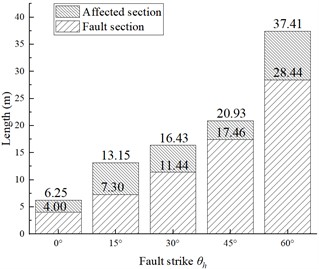
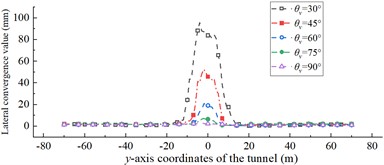
Fig. 14 plots the variation curves of the displacement convergence values along the tunnel -axis for different . The displacement convergence values of the ordinary section of the tunnel do not vary significantly for different . They all fluctuate within a small range and remain stable overall, but there are significant differences in the affected section. The maximum values of the vertical displacement convergence for 0°, 15°, 30°, 45°, and 60° were 11, 15, 19, 38, and 51 mm, respectively. This shows that, as decreases, the vertical convergence value increases gradually. The maximum value appears where the arch crown intersects the fault. At the same time, there is a significant difference between the maximum value of the vertical displacement convergence for greater or less than 45°. The convergence values of the lateral displacements for different cases do not vary significantly and are less than 10 mm.
Fig. 14Displacement convergence value along the tunnel y-axis under different fault strike θh
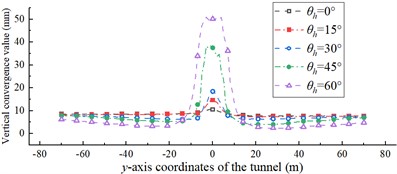
a) Vertical convergence value
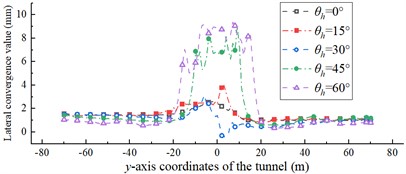
b) Lateral convergence value
4.4.3. Effects of the fault thickness
The thickness of geological faults may vary from a few to several hundred meters. However, assessing the impact of such a wide range of fault thicknesses is difficult. The most-common fault thicknesses in actual tunneling projects range from a few tens of centimeters to several meters because tunnels are generally far from thicker faults during the alignment selection phase [6]. Therefore, this study considered only faults with small thicknesses (1, 4, 8, and 16 m). Fig. 15 compares the ranges of the affected and fault sections for different fault thicknesses. When the fault thickness was 1 m, both the affected and fault sections of this tunnel had the smallest ranges (29.83 and 20.19 m, respectively). As the fault thickness increased, the ranges of the affected and fault sections also increased gradually. When the fault thickness was 16 m, the affected and fault sections had the most-extensive ranges of 57.58 and 50.19 m, respectively.
Fig. 15Range of the tunnel affected section and fault section under different fault thickness
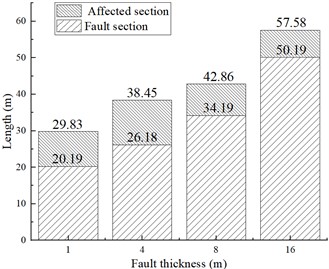
Fig. 16 shows the variation curves of the displacement convergence values along the tunnel -axis for different fault thicknesses. The displacement convergence values of the ordinary section of the tunnel were almost the same for different fault thicknesses. They all fluctuated in a small range from 0 to 3 mm and remained stable overall. However, there were significant differences in the affected section. The maximum convergence values of the vertical displacement for fault thicknesses of 1, 4, 8, and 16 m were 51, 57, 46, and 43 mm, respectively. The vertical displacement convergence value curve along the tunnel y-axis displays a double peak. The peak of the curve appears where the fault-surrounding rock interface intersects the tunnel vault. As the fault thickness increases, the range of the affected section becomes more extensive, and the difference between the two peak sizes decreases. The maximum values of the lateral displacement convergence for fault thicknesses 1, 4, 8, and 16 m were 184, 96, 94, and 117 mm, respectively. For faults of thickness below 4 m, the contact surfaces on both sides of the fault interact with each other instead, causing the large convergence value of the lateral displacement in the tunnel sidewalls. The results show that, as the fault thickness increases, the extent of the affected section also increases. However, as the fault thickness decreases, the degree of damage to the tunnel sidewalls increases.
Fig. 16Displacement convergence value along the tunnel y-axis under different fault thickness
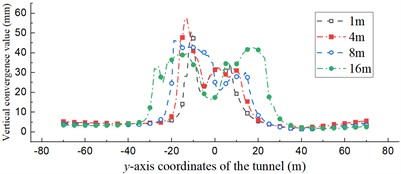
a) Vertical convergence value
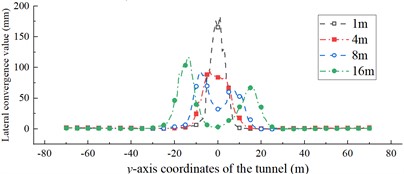
b) Lateral convergence value
4.4.4. Effect of the peak ground accelerations
Fig. 17 compares the ranges of the affected and fault sections at different peak seismic accelerations (PGA = 0.1, 0.2, 0.3, 0.4, and 0.5 g). As the PGA increases, the range of the affected section does not undergo a regular expansion but instead fluctuates within a small range of approximately 36 m. The median of the maximum value of the LURR for each tunnel segment is taken as the typical LURR for that segment (Fig. 18). The typical LURR of all the parts of the ordinary section fluctuate around approximately two at different PGAs, indicating that destabilization damage does not occur in the ordinary section. However, with the increasing PGA, the typical LURR of the affected section increase gradually. For a PGA of 0.1 g, the typical LURRs of the left and right sidewall midpoints, arch crowns, and inverted arches of the tunnel influence section are 4.41, 3.67, 3.42, and 2.64, respectively. For a PGA of 0.5 g, the typical LURR of each site is 14.62, 10.32, 10.19, and 7.14, respectively, indicating that the instability of the affected section increases gradually with the PGA.
Fig. 17Range of the tunnel affected section and fault section under different PGAs
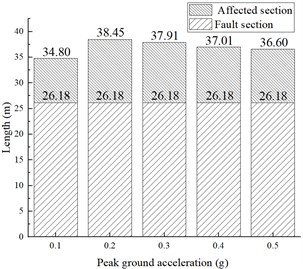
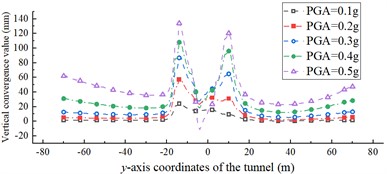
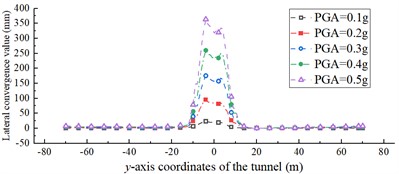
Fig. 19 shows the variation curves of the displacement convergence values along the tunnel -axis for different PGAs. The lateral displacement convergence values of the ordinary section are almost the same for different PGAs. Although the vertical displacement convergence values vary considerably under different PGAs, the LURR suggests that the ordinary section generally remains stable. For a PGA of 0.1, 0.2, 0.3, 0.4, and 0.5 g, the maximum values of the vertical displacement convergence of the affected section are 24, 57, 87, 108, and 134 mm, respectively. The maximum values of the lateral displacement convergence of the affected section are 23, 96, 176, 260, and 364 mm, respectively. As the PGA increases, the tunnel convergence value within the affected section also increases significantly. Moreover, with an increase in PGA, the vertical displacement convergence value along the -axis of the tunnel displays a double peak, and the convergence peak gradually approaches the intersection position of the fault-surrounding rock interface with the tunnel structure. The convergence value of the lateral displacement of the tunnel increases with proximity to the intersection.
Fig. 18Typical LURR of the tunnel affected section and ordinary section under different PGAs
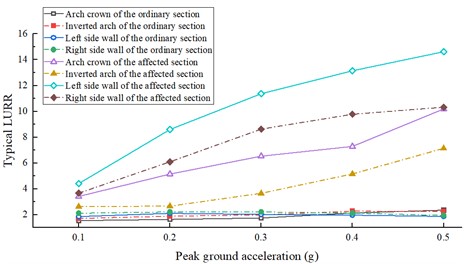
The ordinary section remains stable at PGA = 0.5 g, but the affected section shows a significant destabilization trend at PGA = 0.1 g. With increasing seismic intensity, the risk of destabilization and degree of damage in the affected section of the tunnel increase significantly (especially at the intersection with the fault-surrounding rock interface), even in the absence of damage in the ordinary section. For cross-fault-zone tunnels, the seismic protection level of the affected section should be increased.
Fig. 19Displacement convergence value along the tunnel y-axis under different PGAs
a) Vertical convergence value
b) Lateral convergence value
5. Discussion
This study developed an LURR-based method for determining the dynamic stability of tunnels. Seismic waves were used as the system load/unload parameters. The tunnel-structure strain response was the response parameter. An abnormal value of the LURR variation law defined the destabilization threshold. A comparison with the example calculated by Yan et al. [18] shows that the LURR reflects the evolution process of the tunnel structure, and it can be used to identify the weak parts of the tunnel structure during an earthquake. The results are consistent with those of Yan et al. [18], which is based on the traditional dynamic stability determination method. This verifies the accuracy of the dynamic stability determination method based on the LURR.
Current theoretical research into methods for determining the dynamic stability of underground engineering is limited. Most researchers still use the determination method of static stability in the dynamic analysis of underground engineering, such as the plastic zone area of the surrounding rock and ultimate relative displacement of critical positions. However, the extent of the plastic zone in dynamic finite-element analysis is limited by mesh sizes, allowing only a qualitative analysis. Meanwhile, the judgment of instability based on the penetration of the plastic zone is largely subjective. In addition, the ultimate relative displacement of the structure varies significantly with working conditions. It is difficult to judge the structural stability based on the ultimate relative displacement because of the influence of the periodic seismic load. Misjudgment can therefore occur. A seismic wave can be considered as an unloading and loading process occurring in a nonlinear system. The LURR quantifies the degree of deviation from the steady state of a nonlinear system, and expresses the system evolution from stability to instability from a macroscopic point of view. Compared with the plastic zone and ultimate relative displacement, which are derived from static instability, the LURR is more suitable for determining the dynamic stability during earthquakes.
As discussed in Section 4, the convergence values of the vertical displacements in the ordinary section of the tunnel during a high-intensity earthquake are more significant than those in the affected section of the tunnel during a low-intensity earthquake. The former damage appears more significant than the latter when analyzed using the conventional limit relative displacement method. However, the LURR analysis suggests that the typical LURR of the ordinary section fluctuates slightly around approximately two under a 0.1 g-0.5 g seismic load, while the typical LURR of the affected section greatly exceeds two and increases gradually with the PGA. This result indicates the superior stability of the ordinary section of the tunnel during a high-intensity earthquake, relative to that of the affected section of the tunnel during a low-intensity earthquake.
This study used only the anomalous values and abrupt transitions of the LURR variation law as the destabilization threshold. The range interval of the LURR near 1 was used as the system stability interval. The LURR dynamic destabilization threshold could not be determined precisely. The LURR can be infinite in theory, which makes the precise quantification of the degree of structural damage challenging. In the future, the damage factor and other covariates should be combined to quantify the LURR and construct a complete dynamic instability determination system.
6. Conclusions
The effect of seismic loading on tunnel stability across faults was investigated by numerical simulations. Based on the LURR theory, evaluation indices were established to describe the tunnel stability. The method accuracy was verified using arithmetic examples. The method was used to analyze the seismic performance of cross-fault tunnel structures. The following conclusions can be drawn.
1) The LURR responds more accurately to the degree of deviation of the structure from the steady state during an earthquake. The LURR method of determining dynamic tunnel stability was developed by using seismic waves as the system loading/unloading parameters, the tunnel structure strain response as the response parameter, and the anomalous value of the LURR variation law as the destabilization threshold. The reasonableness of the method was verified using arithmetic examples.
2) The LURR time curve at each monitoring point has a relatively uniform waveform for a given earthquake. However, the amplitude varies according to the stability at each point. At the beginning of an earthquake, the seismic wave has not yet peaked, and the first wave peak appears in the LURR curve at each monitoring point. This indicates that the surrounding rock system responds very strongly after entering the vibration state from rest. The LURR wave peak time at each point in the subsequent vibration is consistent with the acceleration peak time of the input seismic wave.
3) The LURR can be used to determine the potential damage zones in the tunnel structure. With increasing PGA, the LURR increases more in the less stable parts of the tunnel structure but remains constant in the stable part. In this study, as the PGA increased from 1.25 to 2.50 m/s2, the increase in LURR is more significant in the sidewalls of the soil tunnel compared to other parts of the tunnel. Areas with significant changes in LURR correspond to areas of potential tunnel damage. The seismic reinforcement of this part should be considered in actual projects.
4) Fault misalignment is the leading cause of seismic damage in cross-fault tunnels, followed by soft fault filling. The degree of instability increases with the proximity of the tunnel structure to the fault-surrounding rock interface. The ordinary and affected sections of the tunnel are not uniformly sensitive to earthquakes, and there are significant differences in the critical PGAs where damage may occur. An actual tunnel project should improve the seismic-protection level of the affected section around the fault.
5) The range of influence of geological faults on tunnels under seismic action depends mainly on the inherent parameters of the faults, independent of the seismic intensity. The seismic intensity mainly affects the instability degree of the tunnel. The impact range of the fault zone in the tunnel under seismic action increases with the fault thickness. In actual tunnel line selection, tunnels should be orthogonal when crossing large-dip and minor-thickness faults as much as possible. In particular, a fault with a dip angle below 60° and an intersection angle between the fault strike and longitudinal tunnel axis exceeding 45° should be avoided as much as possible when selecting the tunnel line.
6) Accurately describing structural stability under dynamic action using conventional methods is challenging and error-prone. According to the LURR theory, provided that the physical quantities are related to loading and unloading, their response ratios should change abruptly when the structure is destabilized. This provides a criterion for structural instability. However, in theory, the LURR may be infinite, making it difficult to quantify structural damage accurately. The LURR dynamic instability threshold has yet to be determined precisely. In the future, the damage factor and other covariates should be combined to quantify the LURR and construct a complete dynamic instability determination system.
References
-
M. Varma, V. B. Maji, and A. Boominathan, “Numerical modeling of a tunnel in jointed rocks subjected to seismic loading,” Underground Space, Vol. 4, No. 2, pp. 133–146, Jun. 2019, https://doi.org/10.1016/j.undsp.2018.11.001
-
G. Y. Cui, M. N. Wang, L. Yu, and G. J. Lin, “Study on the characteristics and mechanism of seismic damage for tunnel structures on fault rupture zone in Wenchuan seismic disastrous area,” (in Chinese), China Civil Engineering Journal, Vol. 46, No. 11, pp. 122–127, Nov. 2013, https://doi.org/10.15951/j.tmgcxb.2013.11.014
-
L. Fang, S. P. Jiang, Z. Lin, and F. Q. Wang, “Shaking table model test study of tunnel through fault,” (in Chinese), Rock and Soil Mechanics, Vol. 32, No. 9, pp. 2709–2820, Sep. 2011, https://doi.org/10.16285/j.rsm.2011.09.044
-
L. Fan, J.-L. Chen, S.-Q. Peng, B.-X. Qi, Q.-W. Zhou, and F. Wang, “Seismic response of tunnel under normal fault slips by shaking table test technique,” Journal of Central South University, Vol. 27, No. 4, pp. 1306–1319, Apr. 2020, https://doi.org/10.1007/s11771-020-4368-0
-
X. Z. Liu, X. L. Wang, and L. L. Lin, “Model experiment on effect of normal fault with 75°dip angle stick-slip dislocation on highway tunnel,” (in Chinese), Chinese Journal of Rock Mechanics and Engineering, Vol. 32, No. 8, pp. 1714–1720, Aug. 2013, https://doi.org/10.3969/j.issn.1000-6915.2013.08.025
-
X. Wang, Q. Xiong, H. Zhou, J. Chen, and M. Xiao, “Three-dimensional (3D) dynamic finite element modeling of the effects of a geological fault on the seismic response of underground caverns,” Tunnelling and Underground Space Technology, Vol. 96, p. 103210, Feb. 2020, https://doi.org/10.1016/j.tust.2019.103210
-
X. Tan and F. Gao, “Research on instability judgment method of tunnel system based on theory of load-unload response ratio,” World of Mining-Surface and Underground, Vol. 73, No. 3, pp. 160–169, May 2021.
-
F. Gong and C. Wu, “Identifying crack compaction and crack damage stress thresholds of rock using load-unload response ratio (LURR)theory,” Rock Mechanics and Rock Engineering, Vol. 53, No. 2, pp. 943–954, Feb. 2020, https://doi.org/10.1007/s00603-019-01936-z
-
S. Zhang, R. Yang, J. Tan, Y. Zhang, and J. Jiang, “The evolution characteristics of rock fracture instability under cyclic loading on the basis of the enhanced LURR,” Frontiers in Earth Science, Vol. 10, p. 1069046, Jan. 2023, https://doi.org/10.3389/feart.2022.1069046
-
A. S. Zakupin and M. Y. Andreeva, “Application of the LURR method for studying seismicity in the southern kuril islands,” Russian Journal of Pacific Geology, Vol. 16, No. 3, pp. 205–217, Jun. 2022, https://doi.org/10.1134/s1819714022030071
-
K. Wu, Q. Sheng, and U. H. Zhang, “Research on early warning of rainfall-induced landslides based on load-unload response ratio theory,” (in Chinese), Journal of Disaster Prevention and Mitigation Engineering, Vol. 31, No. 6, pp. 632–636, Dec. 2011, https://doi.org/10.13409/j.cnki.jdpme.2011.06.018
-
T. Jiang, S. Ma, B. Xu, and J. Ma, “Study on laws of load-unload response of slope under seismic load,” (in Chinese), Chinese Journal of Rock Mechanics and Engineering, Vol. 23, No. 22, pp. 3803–3807, Nov. 2004, https://doi.org/10.3321/j.issn:1000-6915.2004.22.013
-
L.-P. Zhang, H.-Z. Yu, and X.-C. Yin, “Failure potential evaluation in engineering experiments using load/unload response ratio method,” Pure and Applied Geophysics, Vol. 170, No. 1-2, pp. 237–245, Jan. 2013, https://doi.org/10.1007/s00024-011-0370-7
-
X. C. Yin and C. Yin, “The precursor of instability for nonlinear systems and its application to earthquake prediction,” Science in China (Series B), Vol. 34, No. 8, pp. 977–986, Aug. 1991.
-
X. C. Yin, Y. C. Wang, K. Y. Peng, Y. L. Bai, H. T. Wang, and X. F. Yin, “Development of a new approach to earthquake prediction: load/unload response ratio (LURR) theory,” Pure and Applied Geophysics, Vol. 157, No. 11, pp. 2365–2383, Dec. 2000, https://doi.org/10.1007/pl00001088
-
C. Shi, W. Y. Xu, J. W. Zhou, and X. Q. Zhou, “Dynamic stability research by using load/unload ratio method,” (in Chinese), Rock and Soil Mechanics, Vol. 28, Oct. 2007, https://doi.org/10.16285/j.rsm.2007.s1.157
-
J. H. Yang, Q. Sheng, Z. Q. Zhu, and X. L. Leng, “Loading/unloading response ratio study of seismic response on underground rock cavern group,” (in Chinese), Rock and Soil Mechanics, Vol. 33, No. 7, pp. 2127–2132, Jul. 2012, https://doi.org/10.16285/j.rsm.2012.07.014
-
Z. X. Yan, S. Shi, P. Jiang, and W. G. Huang, “Numerical analysis of tunnel dynamic response under earthquake,” (in Chinese), Chinese Journal of Underground Space and Engineering, Vol. 9, No. 5, pp. 1025–1034, Oct. 2013.
-
G. Q. Liu, M. Xiao, Y. Yang, and J. Q. Ren, “Numerical simulation and analysis method of seismic response for hydraulic tunnel across fault,” (in Chinese), Journal of Hunan University (Natural Sciences), Vol. 45, No. 11, pp. 140–148, Nov. 2018, https://doi.org/10.16339/j.cnki.hdxbzkb.2018.11.018
-
G. Y. Cui, Q. Zhao, M. N. Wang, and G. J. Lin, “Aseismic reinforcement technology of second liner collapse control of tunnel structure in fault rupture zone,” (in Chinese), Journal of Chang’an University (Natural Science Edition), Vol. 35, No. 2, pp. 107–113, Mar. 2015, https://doi.org/10.19721/j.cnki.1671-8879.2015.02.016
About this article

This project is supported by national natural science foundation (No. 51178095), the Research and Innovation Program for Graduate Students in Chongqing (2022B0002) and Sponsored by Natural Science Foundation of Chongqing, China (CSTB2023NSCQ-MSX0503).
The datasets generated during and/or analyzed during the current study are available from the corresponding author on reasonable request.
Qiang Hui wrote the manuscript. Feng Gao reviewed the manuscript. Qiang Hui, Xukai Tan and Dongmei You processed the data and images.
The authors declare that they have no conflict of interest.
