Abstract
The heliostat is different from the ordinary low building because of the special shape of the heliostat. The wind tunnel pressure test is carried out the model of heliostats in the range of azimuth angles are between 0° to 180° and the range of elevation angles are between 0° to 90. The wind pressure time history of each measuring point on the mirror panel are obtained. On this basis, the mean wind pressure distribution of the mirror panel under typical working conditions is obtained, and then the maximum (minimum) value of the mean wind pressure under all working conditions and corresponding working conditions and measuring points are obtained. Then 10 representative measuring points are selected to study the variation law of wind pressure with wind direction angle and pitch angle respectively, and then the variation law of the mean wind pressure of 10 measuring points under all working conditions is obtained. Finally, the interference effect of the mean wind pressure of heliostats is studied, and the variation law of the interference effect of the mean wind pressure is obtained, and the maximum value, minimum value and corresponding working conditions of the interference effect are obtained. The results show that the maximum value of the mean wind pressure of heliostats under all working conditions is appeared at the measurement point of the lower edge of the mirror panel and on working condition 15-60 (wind direction angle - elevation angle), and the minimum value is appeared at the measurement point of the upper left corner of the mirror panel and on working condition 150-20. The variation law of the mean wind pressure of 10 measuring points under all working conditions is similar, and the position of measuring points has little effect on the variation law of the mean wind pressure under all working conditions. Only the working condition of the maximum value and minimum value are affected by the position of the measuring points. The mean wind pressure distribution under the most unfavorable working condition of heliostats is obtained, the maximum (minimum) value of the interference effect and corresponding working conditions are obtained. Which can be a reference for structural design and research.
Highlights
- The maximum (minimum) value of the mean wind pressure under all working conditions and corresponding working conditions and measuring points are obtained.
- Study the variation law of wind pressure with wind direction angle and pitch angle respectively, and then the variation law of the mean wind pressure of different measuring points under all working conditions is obtained.
- The variation law of the interference effect of the mean wind pressure is obtained, and the maximum value, minimum value and corresponding working conditions of the interference effect are obtained.
- The position of measuring points has little effect on the variation law of the mean wind pressure under all most working conditions except the working condition of the maximum value and minimum value.
1. Introduction
Development and utilization of solar energy is an important development trend in the field of renewable energy. The predict of International Energy Agency (IEA) is that solar power generation will account for more than 20 % of the global power supply by 2040. Various solar thermal power generation systems have been studied and developed in recent years. Advantages of tower solar thermal power station are large scale, small heat loss, high spotlight ratio and high temperature, and tower solar thermal power station is one of the lowest cost solar thermal power generation systems [1]. Heliostats are one of the main components of a tower solar thermal power station. Not only most of the site are occupied by heliostats, but also at least half of the investment of power station are occupied by heliostats [2]. Heliostats are mostly built in open and gentle areas, and often accompanied by strong winds. Because of its own characteristics, the heliostat structure is sensitive to wind load and the wind resistance stability of heliostat is poor. Heliostats are damaged under the action of strong wind easily, so the wind resistance design of heliostat can not be ignored [3]-[9]. It is important to analyze the wind load of heliostats and to study the performance of heliostats and research are becoming more and more extensive and comprehensive [10]-[16].
Research on the wind pressure of the heliostat was began in 1960s. Peterka [11] found that the mean wind pressure of the mirror panel can be reduced by 70 % and the fluctuating wind pressure also can be reduced relatively when the heliostat in certain positions of heliostats was compared with isolated heliostat. Wang Y. G. [17] found that the wind pressure distribution is mainly affected by the nearby turbulence when the wind direction angle is 0° to 90°, and when the wind direction angle is 90° to 180°, the wind pressure of the mirror panel is smaller than the wind pressure when the wind direction angle is 0° to 90° due to the influence of the rotating shaft and support arms. Gong [18] presented selected results of wind tunnel measurements of wind pressures on the heliostat. Wind pressure distributions are presented under typical working conditions and fluctuating wind pressure characteristics are analyzed. However, existing researches on wind pressure of heliostats are insufficient and contents of tests are not comprehensive. Only the wind pressure distribution of the mirror panel under some working conditions and the variation law of measuring points under some working conditions are studied by existing researches. The variation law of the wind pressure of the mirror panel with the change of the wind direction angle and the elevation angle has been less studied, and the variation law of the wind pressure of the mirror panel under all working conditions has not been studied. So the wind pressure of heliostat’s mirror panel needed to more comprehensive researches.
Since the tower solar thermal power station is composed of heliostats, the interference effect cannot be ignored in strong winds. However, the research is still few in this area, researchers often draw on the previous research results of building interference. Hussain [19] explored the effect of the external dimensions of low buildings on the wind pressure of buildings surface. Based on results of the wind tunnel test, Surry [20] thought is necessary to pay attention to the interference of special-shaped buildings. English [21] considered that the interference effect has a large impact which is produced by distance of low buildings and the wind direction angle. Zhang [22] considered that the influence of interference is greatest when the angle between the axis of two adjacent buildings and the wind direction angle is 30°-45°. Kareem [23] tested the interference effect of 1, 2 and 3 disturbing cylinders on the disturbed cylinders respectively based on different arrangement methods. Xie [24]-[25] tested the interference effect of 1 and 2 disturbing high-rise buildings respectively, and drew the contour map of interference factors for design reference. However, the heliostat is different from common low-rise buildings, interference effect of wind load is more complex because of the shape size of heliostat, working characteristics, terrain conditions and other factors. The interference effect of heliostats cannot be evaluated by research results of common low-rise buildings interference effect accurately. And due to excessive working conditions, it is still a lack of sufficient test data. Therefore, the interference effect of wind load should be studied.
This article is based on the existing research on the wind pressure and wind pressure interference effects of heliostats. The most common rectangular independent column bracket type heliostat is studied in this paper [26]. Based on the wind tunnel test of heliostats, the variation law of the mean wind pressure distribution of heliostats under all working conditions is studied. Ten representative measuring points of heliostats’ mirror panel were screened and the variation law of the mean wind pressure of ten representative measuring points with change of wind direction angle and pitch angle was studied. And then the variation law of the mean wind pressure under all working conditions of these 10 measurement points are studied. Finally, the interference effect of wind pressure in heliostats is studied, and the variation law of wind pressure interference effect of heliostats is obtained. The deficiency of the analysis of wind pressure of heliostats and the research on the interference effect of wind pressure of heliostats are made up by the research on wind pressure of heliostats in this article. The theoretical basis for the design and further research of heliostats can be provided by these research results.
2. Overview of the wind tunnel test
2.1. Pressure measuring equipment of the wind tunnel
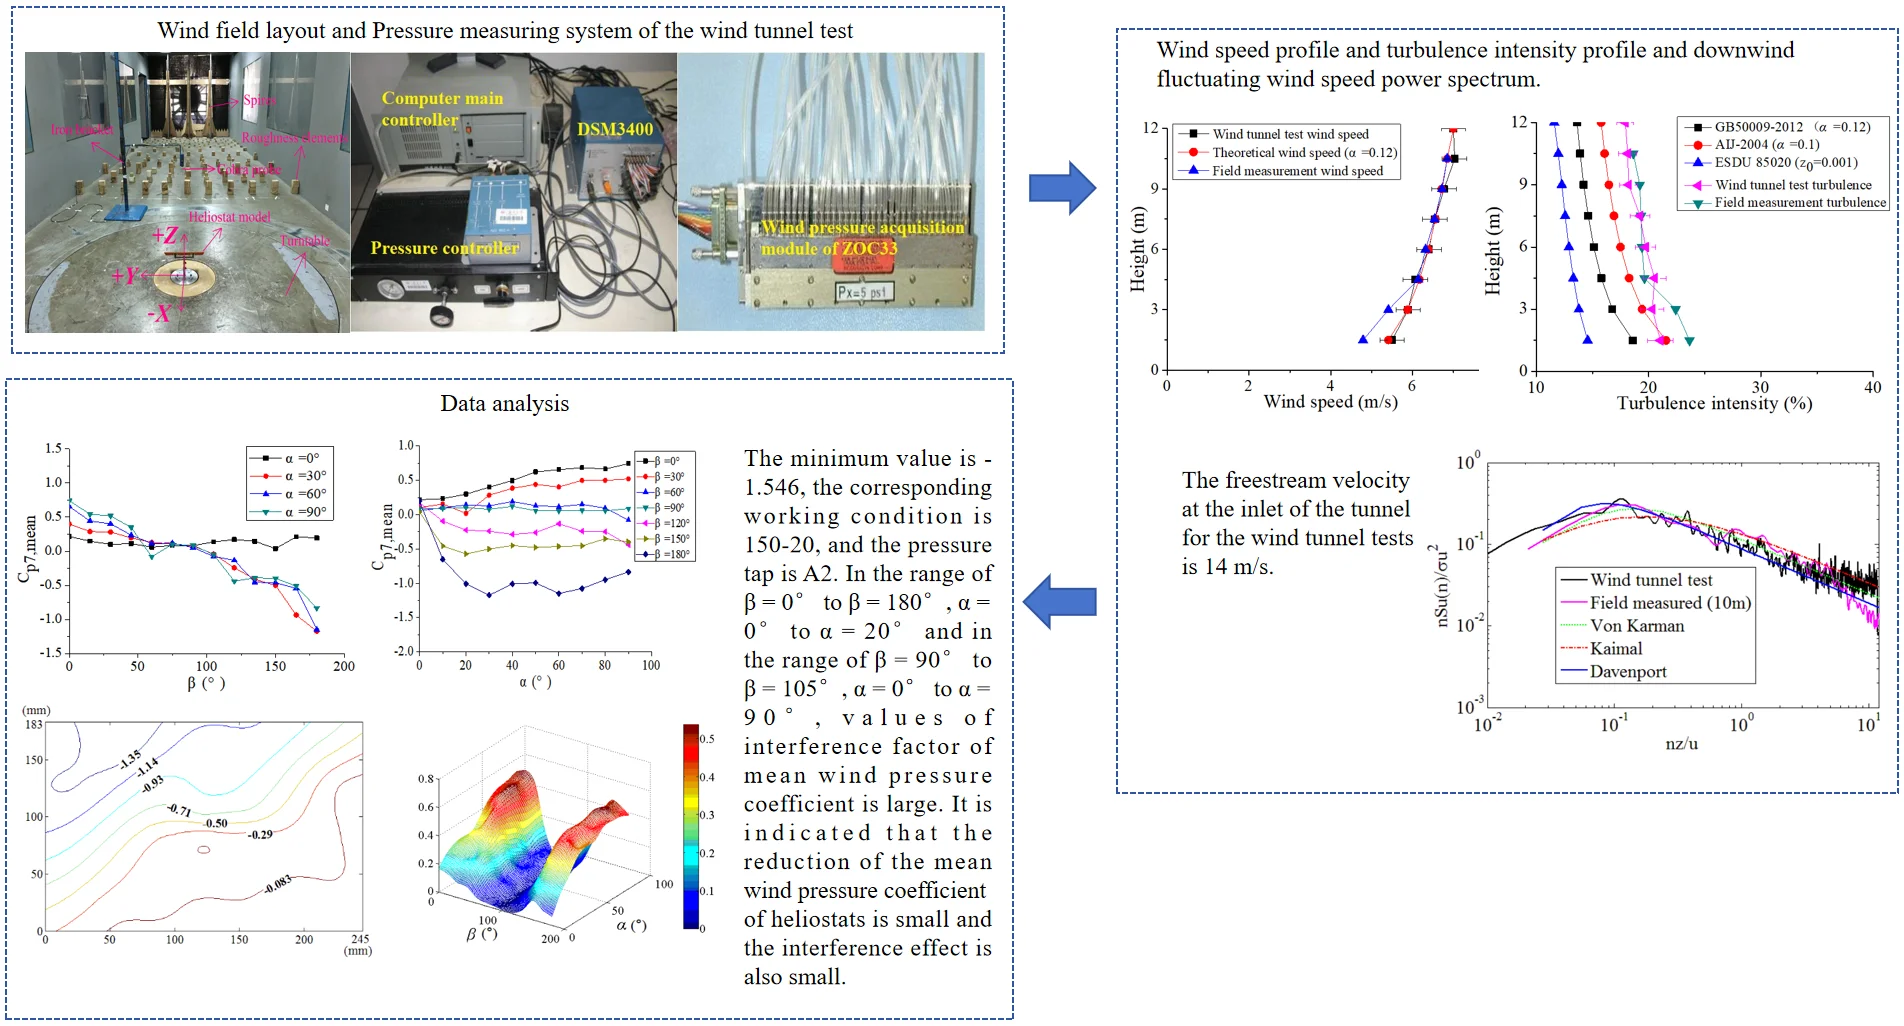
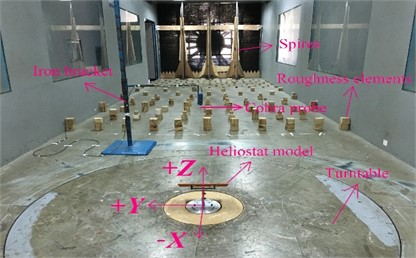
The experiment is conducted in the HD-3 atmospheric boundary layer wind tunnel field at Hunan University. The model is the heliostat of a tower solar thermal power station in northwest of China. The measurement and control system in the HD-3 is mainly composed of fan control system, wind measuring system, force and moment measuring system, pressure measuring system, turntable control system and monitored control system. The Australian TFI cobra probe is used in the wind measuring system (Fig. 1 [27]). The wind measuring system can be used to measure wind speed and turbulence of the flow field. The wind field is simulated by the arrangement of roughness elements, spires in the upstream region of the incoming wind, the purpose of which is to promote the uniform flow to form a flow field that meets the requirements in the vicinity of the measured model. The simulated wind speed and turbulence profile can be obtained by adjusting the spacing and arrangement of the roughness elements and spires in the upstream region (Fig. 2, Fig. 2 were taken by Xiong Qiwei in the HD-3 atmospheric boundary layer wind tunnel field at Hunan University in May 2017).
Fig. 1The Australian TFI cobra probe
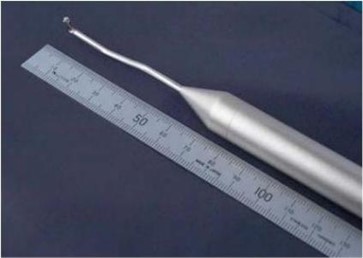
Fig. 2Wind field layout of the wind tunnel test
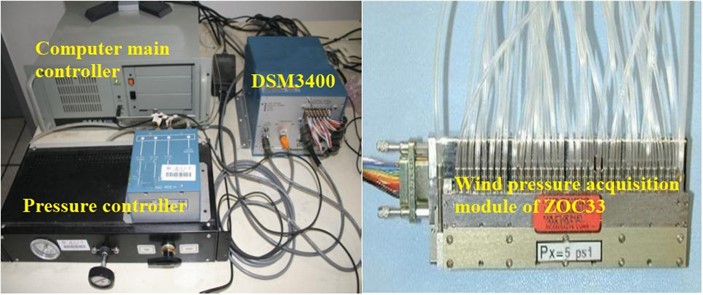
The pressure measuring system are composed of hardwares and softwares. Hardwares are mainly composed of computer main controller, pressure controller, electronic pressure scanning valve of DSM3400 (including wind pressure acquisition module of ZOC33 of 8 groups, each module has 64 channels) (Fig. 3 [27]). Softwares are composed of signal acquisition software and data processing software, the sampling frequency is 312.5 Hz.
Fig. 3Pressure measuring system of the wind tunnel
2.2. Heliostat model and layout of measure point
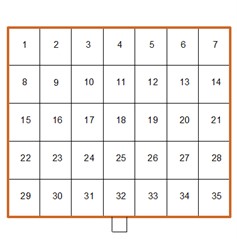
The prototype of heliostat’s mirror panel is composed of 35 sub-mirror panels. According to results of Gong report [28], it is not necessary to take account of the gap size effects on the wind load during the design process of heliostats. Therefore, in order to facilitate the study, the mirror panel of the heliostat model is composed of the whole panel, but the mirror panel is still divided into 35 sub-mirror panels with equal area (Fig. 4 and Fig. 5 were taken by Xiong Qiwei in the HD-3 atmospheric boundary layer wind tunnel field at Hunan University in May 2017). In order to measure the wind pressure on the front and back side of the mirror panel, the double-facing symmetrical placement pressure taps are used. 32 pairs of pressure taps are arranged on the mirror panel. Because the sub-mirror panel area is very small, the pressure tap is arranged in the middle of each sub-mirror panel, and the wind pressure measured by pressure taps is represents the wind pressure of the sub-mirror panel approximately. The front pressure taps are arranged from A1 to A32, the back pressure taps are arranged from B1 to B32, the same numbers of A1 to A32 and B1 to B32 in pressure taps are the sub-mirror front and the back facing symmetrical pressure taps. Because of the existence of the simplified support plate, pressure taps of numbered 9, 13, 16, 20, 23 and 27 cannot be arranged on sub-mirror panels. Due to the existence of the rotating shaft, pressure taps of numbered 17,18 and 19 cannot be arranged in the middle of sub-mirror panels. So four pressure taps are arranged the position on the front and back of the sub-mirror panel 17, 18 and 19 without affecting the wind pressure test, and the measured wind pressure is represented the upper and lower 1/2 sub-mirror wind pressure respectively. In the preparation stage of the pressure measurement test for heliostats, 32 pairs of pressure taps on the mirror panel of the heliostat model are checked, all pressure taps are in good condition. Pressure taps’ setting of the heliostat model can be found in Fig. 6.
Fig. 4The front of the heliostat model
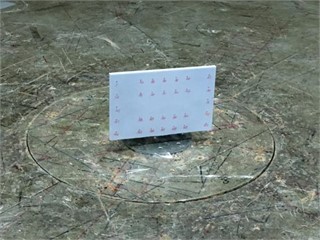
Fig. 5The back of the heliostat model
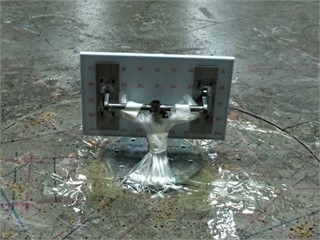
Fig. 6Layout of pressure taps and sub-mirror panel number
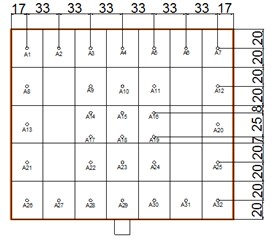
a) Front of mirror panel
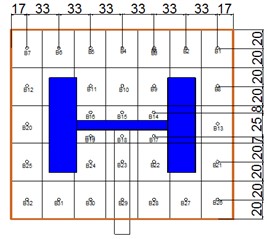
b) Back of mirror panel
c) Sub-mirror panel number
2.3. Layout of heliostats
The radial grid method is usually used for the arrangement of heliostats, and the method was proposed by professor Lipps [29] and professor Vanthull [29] at the University of Houston. Heliostats are arranged on many concentric rings with the endothermic tower as the center, the center of the circle is radially distributed outwards, and the distance between the different rings is not the same. The radius of the first ring is related to the height of the endothermic tower, while the radius of other rings is determined by the radial spacing between adjacent rings. The circumferential spacing between heliostats should ensure that the heliostat does not interfere with each other during operation, and the farther away from the endothermic tower, the circumferential spacing between the heliostat is greater. The occlusion effect between mirror reflected light can be reduced by this arrangement method. In this wind tunnel test, heliostats are arranged according to the radial grid method (Fig. 7). Because numbers of heliostats are too much, only radial five rows and circumferential five rows of heliostats (a total of 9 heliostats) are chose.
Fig. 7Radial grid distribution
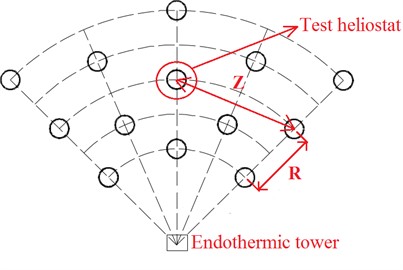
Fig. 8Distribution of heliostats (mm)
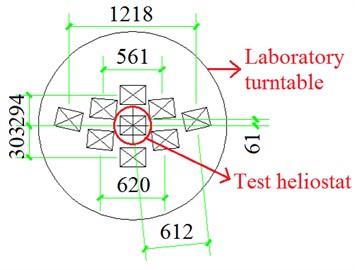
Heliostat models are fixed on the turntable of the wind tunnel during the test, and different wind direction angles are simulated by turntable rotates. The interval between heliostat models can be calculated according to the following formula. When the reflectivity is greater than 90 %, the radial spacing “” and circumferential spacing “” of heliostats can be calculated according to the following formula:
where is the width of the heliostat mirror panel and is the length of the heliostat mirror panel, is the height angle of the absorber on the tower relative to the heliostat, is the correction factor for the height of endothermic tower. This article 180 m, the nearest heliostat from the endothermic tower is 80 m. The layout size between actual heliostats is obtained by calculation, and then the layout size between heliostat models of the laboratory is obtained by geometric scaling ratio of 1:30 (Fig. 8 and Table 1). The “” and the “” are determined by the calculation formula and the scale ratio of the laboratory turntable is set in 1:1, other layout dimensions are measured by the "Auto CAD" software with its own measuring tools.
2.4. Wind field simulation
The simulated atmospheric boundary layer of the measured wind field in the northwest of China and wind tunnel experimental conditions have been discussed in detail in the document by Xiong [30] and Li [30]. The wind speed and turbulence intensity profile of the measured wind field in the northwest region simulated at the center of the wind tunnel turntable is shown in Fig. 10. The fluctuating wind speed power spectrum of the wind tunnel simulation is shown in Fig. 11, the power spectra profile of wind tunnel test is at the height of 0.4 m.
Table 1Layout size of heliostats
Row number of heliostats | First row | Second row | Third row |
(m) | 5.490 | 5.490 | 5.490 |
(m) | 7.350 | 7.350 | 7.350 |
(rad) | 1.153 | 1.112 | 1.073 |
(m) | 8.826 | 9.095 | 9.357 |
(m) | 16.834 | 18.355 | 18.609 |
(mm) | 294 | 303 | 312 |
(mm) | 561 | 612 | 620 |
Fig. 9Wind speed profile and turbulence intensity profile
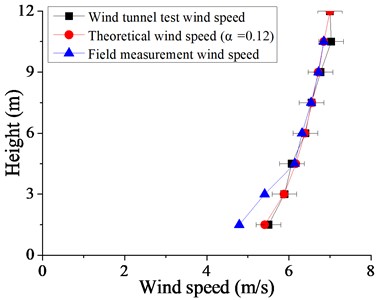
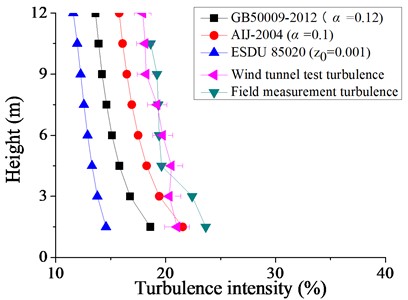
Fig. 10Downwind fluctuating wind speed power spectrum
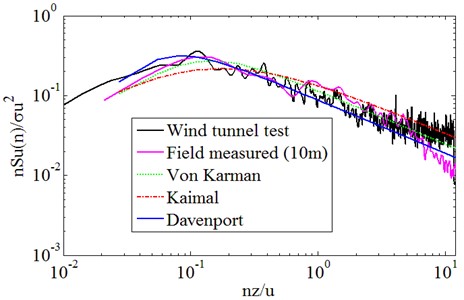
From Fig. 10, it can be seen that the agreement between the wind speed spectra obtained from wind tunnel test and field measurement is reasonable with a deviation in the peak frequency between signals. It is because of the boundary layer wind tunnels are usually designed for testing at scales of the order of 1:100 or smaller. For the wind tunnel test of low-rise structures below 10 m, the scale ratio is relatively larger (1:30-1:10). After the wind profile and turbulence intensity are satisfied, it is difficult to satisfy some other wind characteristics of actual topographic conditions simultaneously. In comparing the measured spectrum, test spectrum with the empirical spectrum, the longitudinal fluctuating wind power spectrum is in good agreement with von Karman’s spectrum. Therefore, von Karman's spectrum is most suitable for the characterization of the distribution of fluctuating wind energy in the frequency domain at the heights of 10 m from the ground in the desert area.
3. Test working conditions and data processing
3.1. Test working conditions
The test is consisted of 130 working conditions and each working condition is corresponded to a combination of a wind direction angle and a elevation angle. The wind direction angle is varied from 0° to 180° with increment of 15° from the front of the mirror panel in anti-clock wise to the back of the mirror panel. The elevation angle is varied from 0° to 90° with increment of 10° from the mirror panel parallel ground to the mirror panel perpendicular ground. The coordinate system of the wind direction angles and elevation angles is shown in Fig. 11.
Fig. 11The coordinate system of heliostat’s wind tunnel test
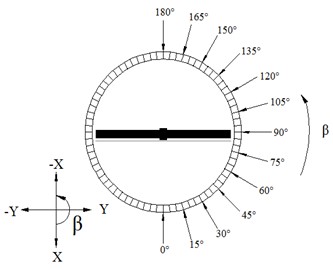
a) The coordinate system of wind direction angle
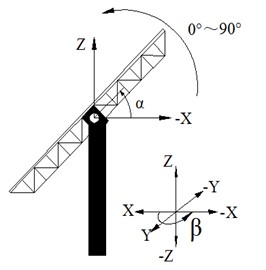
b) The coordinate system of elevation angle
3.2. Definition of parameters
In the field of structural wind engineering, wind pressure coefficient (non-dimensional) is generally used to represent the wind pressure acting on the surface of the structure. For the heliostat, the wind pressure coefficient is defined as the net wind pressure coefficient of the mirror panel (the wind pressure coefficient at the front pressure taps of the mirror panel minus the wind pressure coefficient at the back pressure taps of the mirror panel). Eq. (3) is the calculation equation of net wind pressure coefficient for each measuring position on mirror panel:
where is wind pressure coefficient, is the number of pressure tap, and are the wind pressures of pressure taps on front side and backside. is the air density, is the mean wind speed at the height of during the test, and is the reference height of wind tunnel test, 0.4 m which corresponds to a prototype height of 12 m. With a sampling frequency of 312.5 Hz, 10,000 data were recorded for each pressure tap, and the sampling time is 32 s. By analyzing , the mean wind pressure coefficient could be calculated according to Eq. (4):
where is the mean wind pressure coefficient of the pressure tap , is the time history value of the wind pressure coefficient of a certain pressure tap, 1, 2,…, , is the number of samples.
In order to study the effect of wind pressure interference of heliostats in the wind tunnel test, Eq. (5) is the calculation equation of interference factor of mean wind pressure coefficient ():
where and are the mean wind pressure coefficient of isolated heliostat and heliostats.
4. Wind pressure coefficient of heliostats
4.1. Mean wind pressure distribution of heliostats
S. Becker [31] conducted an experimental study on the flow field structure of rectangular obstacles with different aspect ratios in two different types of boundary layers. Where the size of the rectangular obstacle thickness is much smaller than the size of length and width, which is similar to the shape size of the mirror panel of heliostat. The schematic diagram of the flow direction when the incoming flow encounters a rectangular obstacle and the heliostat is shown in Fig. 12.
Fig. 12The flow direction when the incoming flow encounters a rectangular obstacle and the heliostat
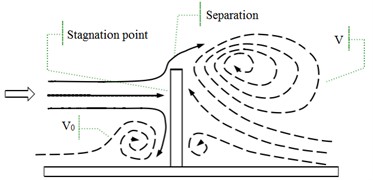
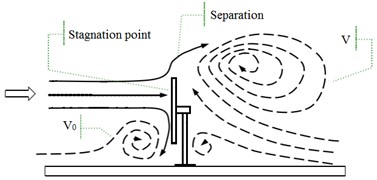
The incoming flow has a stagnation point about 2/3 of the height of the heliostat mirror panel (Stagnation point in Fig. 12) by the analysis of S. Becker. The incoming flow is dispersed in all directions after meeting the heliostat. The airflow above the stagnation point crosses the top of the heliostat, and forms a large clockwise vortex on the back of the heliostat. So the wind pressure back of the heliostat is negative pressure. While the airflow below the stagnation point meets the ground and forms a clockwise vortex.
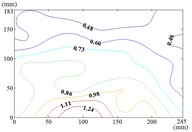
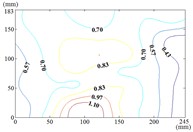
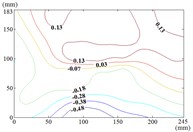
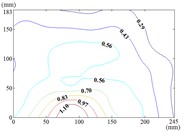
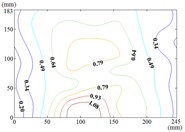
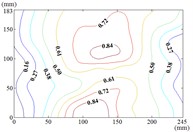
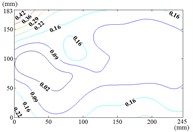
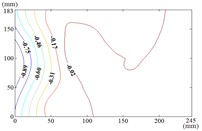
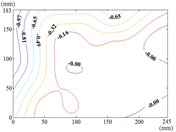
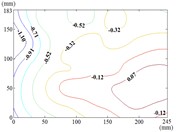
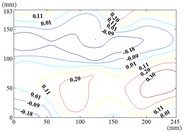
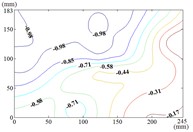
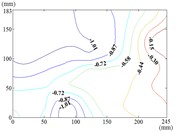
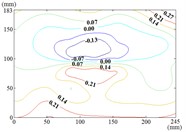
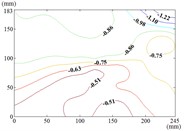
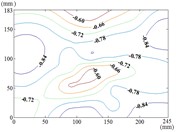
The influence of change of wind direction angle and elevation angle on the wind pressure distribution of the mirror panel should be taken into account in the wind resistance design of heliostats. Due to limited length of article, the contours of mean wind pressure coefficient of the mirror panel under typical working conditions are shown in Fig. 13.
When the working condition is 0-0, values of of heliostats are basically positive in the upper half of the mirror panel and negative in the lower half of the mirror panel. The variation law of mean wind pressure coefficient is decreased from the middle to the bottom of the mirror panel, and increased from the middle to the upper of the mirror panel and then decreased. As the increase of , values of of heliostats are all positive. The variation law of mean wind pressure coefficient is increased from top to bottom of the mirror panel, and the maximum value is reached in the middle of the bottom of the mirror panel.
The incoming wind which is touched at the edge of the side of the mirror panel will be shunted. Due to the existence of the rotating shaft and the support plate, a large vortex is generated when the airflow is contacted the axis of rotating shaft and the support plate, and which is acted on the back of the mirror panel, so the mean wind pressure coefficient is negative which is on the back of the mirror panel.
Fig. 13Mean wind pressure coefficient contours of heliostats
a) Working condition 0-0
b) Working condition 0-30
c) Working condition 0-60
d) Working condition 0-90
e) Working condition 30-0
f) Working condition 30-30
g) Working condition 30-60
h) Working condition 30-90
i) Working condition 60-0
j) Working condition 60-30
k) Working condition 60-60
l) Working condition 60-90
m) Working condition 90-0
n) Working condition 90-30
o) Working condition 90-60
p) Working condition 90-90
q) Working condition 120-0
r) Working condition 120-30
s) Working condition 120-60
t) Working condition 120-90
u) Working condition 150-0
v) Working condition 150-30
w) Working condition 150-60
x) Working condition 150-90
y) Working condition 180-0
z) Working condition 180-30
aa) Working condition 180-60
ab) Working condition 180-90
Therefore, the positive wind pressure coefficient on the front of the mirror minus the negative wind pressure coefficient on the back of the mirror panel is equal to the net wind pressure coefficient in the Fig. 13.
When the working condition is 30-0, the incoming wind which is touched at the edge of the mirror panel will be shunted. Air flow is acted on the back of the mirror panel, and values of of this area are negative. So that values of in half area of the mirror panel which is contacted the incoming wind at first is basically negative and the other half area is positive. As the increase of α, the maximum value of is reached in the middle of the bottom of the mirror panel. The variation law of mean wind pressure coefficient is decreased from bottom to top of the mirror panel and decreased from middle to outside of the mirror panel. When the working condition is 30-90, the maximum value of is reached in the middle of the mirror panel and in the middle of the bottom of the mirror panel, and then decreased in the other parts of the mirror panel.
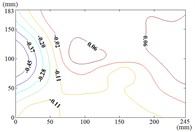
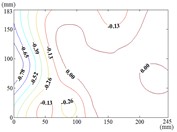
When the working condition is 60-0, the incoming wind which is touched at the edge of the short side of the mirror panel will be shunted. Air flow is acted on the back of the mirror panel, so that the is took the mirror panel diagonal as the boundary, and values of of the lower left area are negative and values of of the upper right area are positive. When the working condition is 60-30, the variation law of mean wind pressure coefficient is decreased from the upper left corner and lower right corner to the middle of the mirror panel. When the working condition is 60-60, the variation law of mean wind pressure coefficient is decreased from four corners to the middle of the mirror panel. When the working condition is 60-90, The negative is appeared in 1/4 position of upper of the mirror panel and the minimum value of is reached in the lower left corner of the mirror panel, and the maximum value is reached in the upper left corner of the mirror panel.
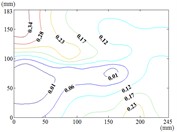
When 90°, values of of the 1/4 area of the mirror panel which is touched the incoming wind at first is negative. The variation law of mean wind pressure coefficient of the negative region is decreased from the distal end to the proximal end. The minimum value of is reached in the edge of the mirror panel that is touched the incoming wind at first. Values of of other parts of the mirror panel is positive, and values of positive region are small, close to 0.
From 90° to 180° and 0°, the incoming wind which is touched at the edge of the mirror panel will be shunted. Air flow is acted on the back of the mirror panel, and values of of this area are negative. So that the is took the mirror panel diagonal as the boundary, and values of of the upper left area are negative and values of the lower right area are positive. As the increase of , values of of heliostats are all negative. The variation law of mean wind pressure coefficient is increased from proximal end to the distal end of the mirror panel which is touched the incoming wind, and the minimum value is reached at the proximal end of the mirror panel which is touched the incoming wind.
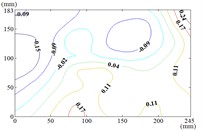
When the working condition is 180-0, the variation law of mean wind pressure coefficient is decreased from top and bottom edge to the middle of the mirror panel. The negative is appeared in 1/4 position of upper of the mirror panel, and values of in the middle of the mirror panel are trended to 0. When the working condition is 180-30, the variation law of mean wind pressure coefficient is decreased from bottom to the top of the mirror panel, and the minimum value is reached in the upper right corner of the mirror panel. When the working condition is 180-60, the variation law of mean wind pressure coefficient is decreased from the lower left corner to the upper right corner of the mirror panel, and the minimum value is reached in the upper right corner of the mirror panel. When the working condition is 180-90, the minimum value is reached in the left edge, right edge and lower right corner of the mirror panel. Then values of are increased in the other parts of the mirror panel. The maximum value is reached in the middle of the upper edge of the mirror panel and in the 2/5 position of lower of the mirror panel.
4.2. Maximum (minimum) mean wind pressure coefficient of heliostats
The maximum (minimum) mean wind pressure coefficient under all working conditions and corresponding working conditions are shown in Table 2 and Table 3.
Table 2Maximum (minimum) value of mean wind pressure coefficient at different elevation angles
Maximum value of | Minimum value of | |||||
Pressure tap | Pressure tap | |||||
0° | 150° | A25 | 0.395 | 15° | A28 | –0.576 |
10° | 30° | A28 | 0.759 | 165° | A2 | –1.218 |
20° | 30° | A28 | 1.201 | 150° | A2 | –1.546 |
30° | 30° | A28 | 1.160 | 150° | A2 | –1.336 |
40° | 15° | A28 | 1.227 | 165° | A2 | –1.296 |
50° | 15° | A28 | 1.348 | 165° | A2 | –1.165 |
60° | 15° | A28 | 1.427 | 165° | A2 | –1.248 |
70° | 15° | A28 | 1.279 | 165° | A2 | –1.132 |
80° | 15° | A28 | 1.209 | 150° | A2 | –1.163 |
90° | 0° | A28 | 1.152 | 165° | A28 | –1.178 |
Table 3Maximum (minimum) value of mean wind pressure coefficient at different wind direction angles
Maximum value of | Minimum value of | |||||
Pressure tap | Pressure tap | |||||
0° | 50° | A28 | 1.240 | 0° | A28 | –0.544 |
15° | 60° | A28 | 1.427 | 0° | A28 | –0.576 |
30° | 40° | A28 | 1.231 | 0° | A28 | –0.470 |
45° | 40° | A29 | 0.675 | 0° | A13 | –0.376 |
60° | 40° | A8 | 0.484 | 0° | A13 | –0.468 |
75° | 40° | A14 | 0.235 | 90° | A13 | –0.565 |
90° | 40° | A27 | 0.184 | 60° | A13 | –0.828 |
105° | 50° | A12 | 0.302 | 50° | A13 | –1.109 |
120° | 90° | A25 | 0.265 | 40° | A8 | –1.260 |
135° | 0° | A28 | 0.202 | 30° | A8 | –1.240 |
150° | 0° | A25 | 0.395 | 20° | A2 | –1.546 |
165° | 0° | A18 | 0.222 | 20° | A1 | –1.326 |
180° | 0° | A27 | 0.243 | 30° | A7 | –1.173 |
When the elevation angle is constant, these maximum values of are appeared in the case of 90° except for 0°, and when 0°, the maximum value of is appeared in the case of 150°. The pressure tap of maximum value is appeared in the middle of the lower edge of the mirror panel. When the elevation angle is constant, these minimum values of are appeared in the case of 90° except for 0°, and when 0°, the maximum value of is appeared in the case of 15°. The pressure tap of minimum value is appeared in the upper left corner of the mirror panel. The maximum value is 1.427 and the corresponding working condition is 15-60 in Table 2. The minimum value is –1.546 and the corresponding working condition is 150-20 in Table 2.
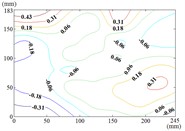
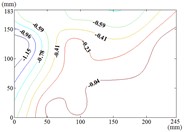
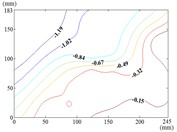
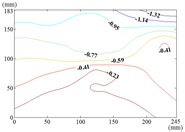
When the wind direction angle is constant, the pressure tap of maximum value is appeared in the lower edge, right edge and middle of the mirror panel. The pressure tap of minimum value is appeared in left edge, lower edge and upper left corner of the mirror panel. It can be seen from Table 2 and Table 3, the maximum value is 1.427, the corresponding working condition is 15-60, and the pressure tap is A28. The minimum value is –1.546, the corresponding working condition is 150-20, and the pressure tap is A2. The mean wind pressure coefficient contours of working conditions corresponding to the maximum (minimum) values (the most unfavorable working conditions) are shown in Fig. 14.
The maximum value of the working condition 15-60 is appeared in the middle of the lower edge of the mirror panel, which is proximal end edge of the mirror panel that is touched the incoming wind at first. Then the variation law of mean wind pressure coefficient is decreased from the middle of the lower edge to the upper right corner of the mirror panel. The minimum value of the working condition 150-20 is appeared in the upper left corner of the mirror panel, which is proximal end corner of the mirror panel that is touched the incoming wind at first. Then the variation law of mean wind pressure coefficient is increased from the upper left corner to the lower right corner of the mirror panel.
Fig. 14The mean wind pressure coefficient contours of the most unfavorable working conditions of heliostats
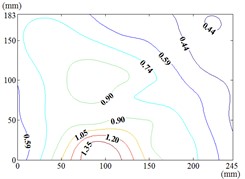
a) Working condition 15-60
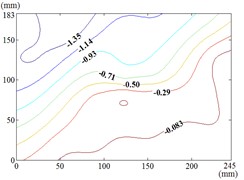
b) Working condition 150-20
5. The variation law of mean wind pressure coefficient of heliostats
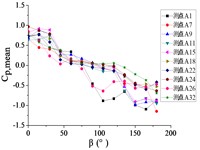
5.1. The variation law of mean wind pressure coefficient with change of wind direction angle
In order to analyze the influence of the wind direction angle on of pressure taps in different areas of the mirror panel, 10 representative pressure taps are selected (indicated by the number on the front of the mirror panel): A1, A7, A9, A11, A15, A18, A22, A24, A26 and A32. Among them, A1, A7, A26 and A32 are pressure taps of four corners of the mirror panel. A9, A11, A22 and A24 are pressure taps in the middle circle of the mirror panel. A15 and A18 are pressure taps in the middle of the mirror panel. The variation law of mean wind pressure coefficient of these pressure taps with change of wind direction angle is obtained.
Fig. 15The variation law of mean wind pressure coefficient of a pressure tap with change of wind direction angle
a) Pressure tap A1
b) Pressure tap A7
c) Pressure tap A9
d) Pressure tap A11
e) Pressure tap A15
f) Pressure tap A18
g) Pressure tap A22
h) Pressure tap A24
i) Pressure tap A26
j) Pressure tap A32
Ten representative pressure taps can be divided into three categories: pressure taps A7 and A32 are category I. When 0°, the curve is fluctuated near the value of 0. When is the other angle, the curve is decreased monotonously with the increase of , the value of is the maximum when 0° and the value of is the minimum when 180°. However, the absolute value of minimum value of A7 is much greater than the maximum value of A7, while the absolute value of minimum value of A32 is equivalent to the maximum value of A32.
Pressure taps A9, A11, A15, A18, A22 and A24 are category II. When 0°, the curve is fluctuated near the value of 0. When is other angle, from 0° to 90°, the curve is tended to flatten and then decreased, and from 90° to β = 180°, the curve is decreased and then increased or tended to flatten. The value of is the maximum when 15° or 30°, and the value of is the minimum when 150° or 165°.
Pressure taps A1 and A26 are category III. When 0°, the curve is fluctuated near the value of 0. When is other angle, from 0° to 105°, the curve is decreased, and from 105° to 180°, the curve is tended to flatten. The category III is the transition stage of category I and category II, and the characteristics of both curves of category I and category II are shown in curves of category III.
Pressure taps A1 and A26 are belonged to the left area of the front of the mirror panel, pressure taps A7 and A32 are belonged to the right area of the front of the mirror panel, and other six pressure taps are belonged to the middle area of the front of the mirror panel. From 0° to 180°, the incoming wind will be acted on the area where pressure taps A1 and A26 are located at first, then the incoming wind will be acted on the area where pressure taps A9, A11, A15, A18, A22 and A24 are located, and finally the incoming wind will be acted on the areas where pressure taps A7 and A32 are located. Therefore, the curve of the mean wind pressure coefficient of pressure taps are similar in the same area, and variation law of the mean wind pressure coefficient will also be exhibited the in Fig. 15.
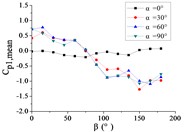
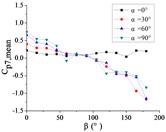
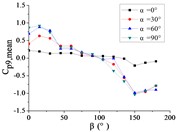
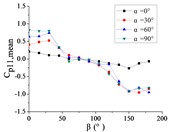
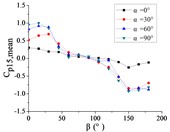
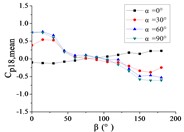
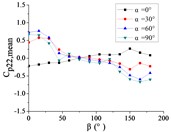
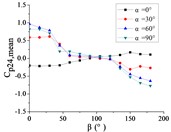
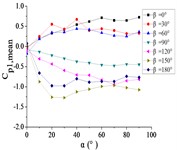
Fig. 16The variation law of mean wind pressure coefficient of 10 pressure taps with change of wind direction angle
a) Elevation angle 0°
b) Elevation angle 30°
c) Elevation angle 60°
d) Elevation angle 90°
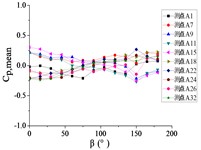
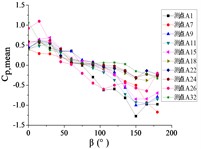
When 0°, the curve is fluctuated near the value of 0. However, there is a little differences of ten curves: curves of A9, A11 and A15 are trended to decrease, the curve of A7 is trended to be horizontal, and other curves are trended to increase.
When 30°, as the increase of , curves of ten pressure taps are trended to decreased. However, the decline interval of A18, A22, A24 and A32 is from 0.5 to –0.5, while the decline interval of other pressure taps are from 0.5 to –1.0. Curves of A18, A22, A24 and A32 are flat, while curves of other pressure taps are steep, relatively.
When 60°, as the increase of , curves of ten pressure taps are trended to decreased. But the decline interval of ten pressure taps are from 1.0 to –1.0. When 30°, differentiation of the slope of curves is more obvious than differentiation of the slope of curves when 60°. But curves of A1 and A26 are still the most obvious floating curves in curves of ten pressure taps.
When 90°, as the increase of , curves of ten pressure taps are trended to decreased and the decline interval of ten pressure taps are from 1.0 to –1.0. The slope of curves are more similar.
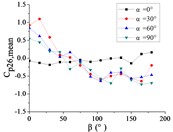
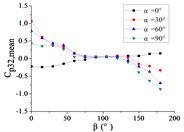
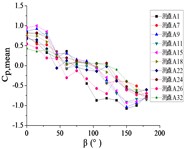
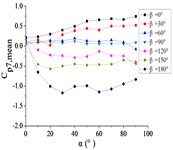
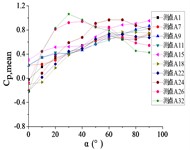
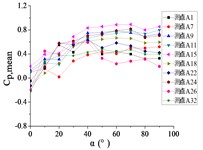
5.2. The variation law of mean wind pressure coefficient with change of elevation angle
When 0° and 30°, curves of the pressure taps A1~A15 are increased with the increase of and reached the maximum at 90°. As the increase of , curves of the pressure taps A18, A22 and A24 are increased to the maximum, and then curves are trended to be flat. As the increase of α, curves of the pressure taps A26 and A32 are increased at first and then decreased.
When 60°, as the increase of , the curve of pressure tap A1 is increased to the maximum, and then curves are trended to be flat. As the increase of , the curve of pressure tap A9 is fluctuated near the value of 0.25, and curves of other pressure taps are fluctuated near the value of 0.
When 90°, as the increase of , the curve of pressure tap A1 is decreased. As the increase of , the curve of pressure tap A26 is decreased at first and then increased, and curves of other pressure taps are fluctuated near the value of 0 and curves are closest to 0.
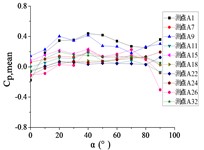
When 120°, as the increase of , curves of pressure taps A1 and A26 are decreased. As the increase of α, curves of pressure taps A7, A9, A11 and A15 are fluctuated near the value of –0.25, and curves of other pressure taps are fluctuated near the value of 0.
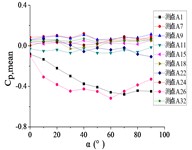
When 150° and 180°, as the increase of , the curve of pressure tap A1 is decreased at first and then increased. As the increase of , curves of pressure taps A7, A9, A11 and A15 are decreased to the minimum, and then curves are trended to be flat. As the increase of , curves of other pressure taps are decreased.
Fig. 17The variation law of mean wind pressure coefficient of a pressure tap with change of elevation angle
a) Pressure tap A1
b) Pressure tap A7
c) Pressure tap A9
d) Pressure tap A11
e) Pressure tap A15
f) Pressure tap A18
g) Pressure tap A22
h) Pressure tap A24
i) Pressure tap A26
j) Pressure tap A32
From 0° to 90°, as the increase of , curves of ten pressure taps are increased to the maximum and then trended to be flat.
When 90°, curves of pressure taps A1 and A26 are fluctuated greatly. As the increase of , the curve of pressure tap A1 is decreased, and the curve of pressure tap A26 is decreased at first and then increased. As the increase of , curves of other pressure taps are fluctuated near the value of 0.
From 90° to 180°, curves of ten pressure taps are trended to decreased, the variation law is divided into two categories. Pressure taps A1~A15 which are in the upper half of the mirror panel are category I. As increase of , curves of pressure taps A1~A15 are decreased to the minimum, and then curves are trended to be flat. Pressure taps A18~A32 which are in the lower half of the mirror panel are category II. As increase of , curves of pressure taps A1~A15 are trended to be flat at first, and then curves are decreased to the minimum. Finally, the difference between two categories is obvious.
Fig. 18The variation law of mean wind pressure coefficient of ten pressure taps with change of elevation angle
a) Wind direction angle 0°
b) Wind direction angle 30°
c) Wind direction angle 60°
d) Wind direction angle 90°
e) Wind direction angle 120°
f) Wind direction angle 150°
g) Wind direction angle 180°
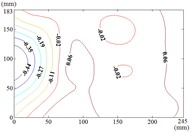
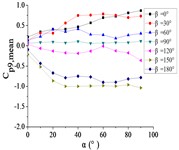
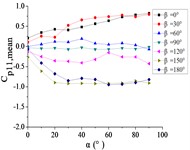
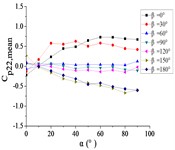
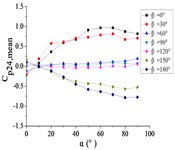
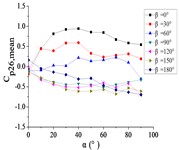
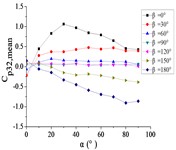
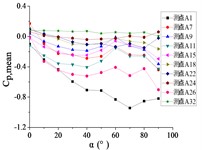
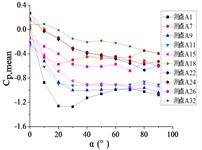
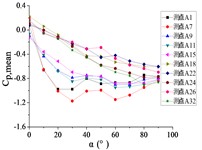
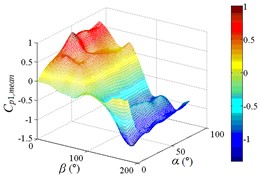
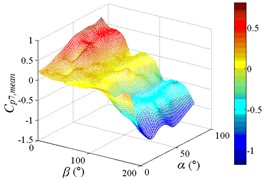
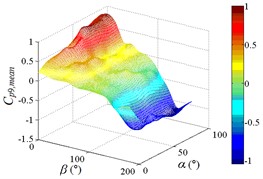
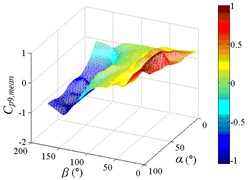
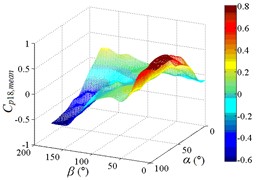
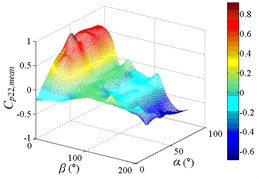
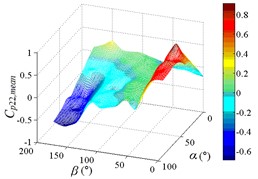
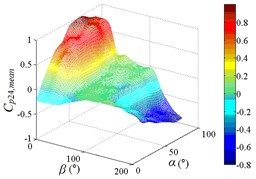
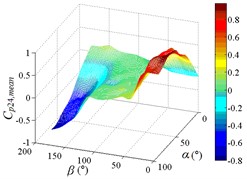
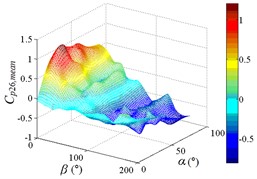
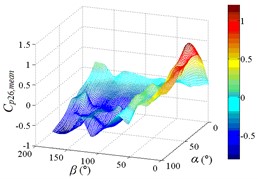
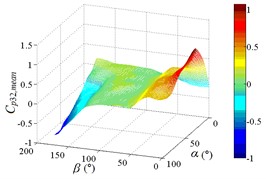
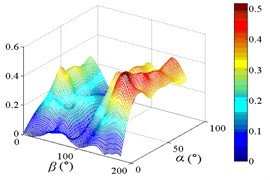
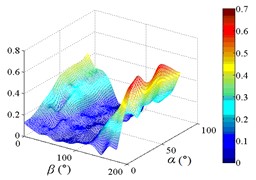
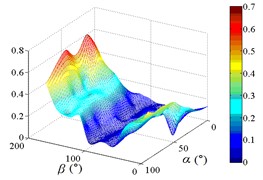
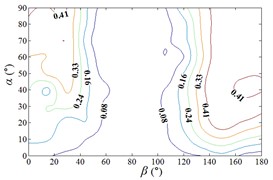
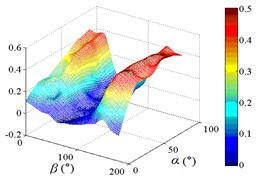
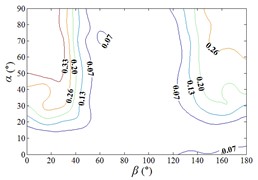
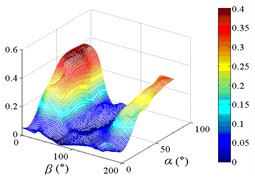
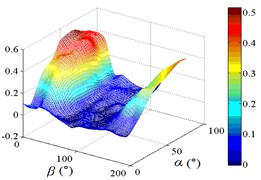
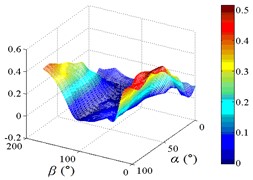
5.3. The variation law of mean wind pressure coefficient of pressure taps under all working conditions
The variation law of mean wind pressure coefficient under 130 working conditions is analyzed by selected ten representative pressure taps in the mirror panel.
As increase of , values of the mean wind pressure coefficient under all working conditions of ten pressure taps are decreased. The maximum value of the mean wind pressure coefficient is appeared in 0°, and values of the mean wind pressure coefficient are reduced to 0 at 90°, and the minimum value of the mean wind pressure coefficient is appeared in 180°.
As the position of pressure taps are moved from the top edge to the bottom edge of the mirror panel, the range of larger values in contours is moved downward from upper left corner of contours, and the range of smaller values in contours is moved from the middle of the right side to the upper right corner of contours. It can be found from the 3D diagram that the maximum is also moved from working condition 0-90 to working condition 0-30, and the minimum is moved from working condition 180-30 to working condition 180-90.
Values of the mean wind pressure coefficient of ten pressure taps are fluctuated near the value of 0 when 90°, and curves is also distributed horizontally at value of 0. From 0° to 90° (except for 0°), as increase of , the variation law of the mean wind pressure coefficient of ten pressure taps is decreased from the maximum to 0 and then fluctuated near the value of 0, and then decreased to the minimum. The 3D diagram is distributed in step shape.
Therefore, the variation law of the mean wind pressure coefficient under all working conditions of ten pressure taps is similar. The position of pressure taps has little effect on the variation law of the mean wind pressure coefficient under all working conditions. Only the working condition of the maximum and minimum is affect by the different position of pressure taps.
Fig. 19The variation law of mean wind pressure coefficient of ten pressure taps under all working conditions
a1) Contour of pressure tap A1
a2) One visual angle of 3D of A1
a3) Another visual angle of 3D of A1
b1) Contour of pressure tap A7
b2) One visual angle of 3D of A7
b3) Another visual angle of 3D of A7
c1) Contour of pressure tap A9
c2) One visual angle of 3D of A9
c3) Another visual angle of 3D of A9
d1) Contour of pressure tap A11
d2) One visual angle of 3D of A11
d3) Another visual angle of 3D of A11
e1) Contour of pressure tap A15
e2) One visual angle of 3D of A15
e3) Another visual angle of 3D of A15
f1) Contour of pressure tap A18
f2) One visual angle of 3D of A18
f3) Another visual angle of 3D of A18
g1) Contour of pressure tap A22
g2) One visual angle of 3D of A22
g3) Another visual angle of 3D of A22
h1) Contour of pressure tap A24
h2) One visual angle of 3D of A24
h3) Another visual angle of 3D of A24
i1) Contour of pressure tap A26
i2) One visual angle of 3D of A26
i3) Another visual angle of 3D of A26
j1) Contour of pressure tap A28
j2) One visual angle of 3D of A32
j3) Another visual angle of 3D of A32
As shown in Table 4, maximum values of ten pressure taps under all working conditions are concentrated between 0.742 to 1.098, and the corresponding working conditions are 0-30, 0-70, 0-90, 15-30, 15-40, 15-70 and 15-90, respectively. The corresponding working conditions of the maximum value of ten pressure taps under all working conditions are divided into two categories. The working conditions 0-30, 15-30 and 15-40 are categories I. The characteristic of categories I is that the mirror panel is basically facing upwind, and elevation amplitude is not large, the range of elevation is 30° to 40°. The working conditions 0-70, 0-90, 15-70 and 15-90 are categories II. The characteristic of categories II is that the mirror panel is basically facing upwind with a large elevation angle, and the mirror panel is almost perpendicular to the ground, the range of elevation is 70° to 90°.
Minimum values of ten pressure taps under all working conditions are concentrated between -0.614 to 1.326. The corresponding working conditions of the minimum value of ten pressure taps under all working conditions are also divided into two categories. The working conditions 165-20, 165-30 and 180-30 are categories III. The characteristic of categories III is that the back of mirror panel is basically facing upwind, and elevation amplitude is not large, the range of elevation is 20° to 30°. The working conditions 165-70, 165-80, 165-90 and 180-80 are categories IV. The characteristic of categories IV is that the back of mirror panel is basically facing upwind with a large elevation angle, and the mirror panel is almost perpendicular to the ground, the range of elevation is 70° to 90°.
Table 4Maximum (minimum) value of mean wind pressure coefficient under all working conditions of ten pressure taps
Pressure tap | Maximum value of | Minimum value of | ||
Working condition | Working condition | |||
A1 | 15-40 | 0.939 | 165-20 | –1.326 |
A7 | 0-90 | 0.742 | 180-30 | –1.173 |
A9 | 15-90 | 0.920 | 165-70 | –1.037 |
A11 | 0-90 | 0.822 | 165-30 | –0.954 |
A15 | 15-90 | 0.998 | 165-70 | –0.965 |
A18 | 15-70 | 0.773 | 165-80 | –0.614 |
A22 | 15-40 | 0.915 | 165-90 | –0.669 |
A24 | 0-70 | 0.968 | 180-80 | –0.784 |
A26 | 15-30 | 1.098 | 165-80 | –0.789 |
A32 | 0-30 | 1.064 | 180-80 | –0.907 |
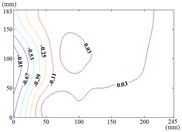
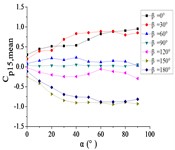
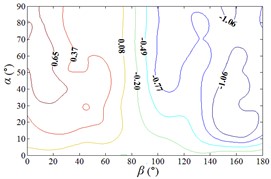
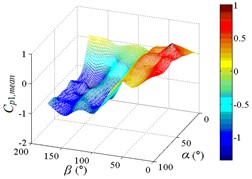
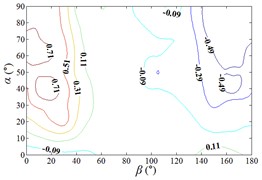
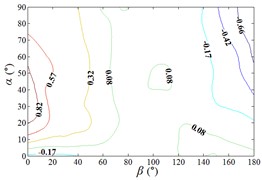
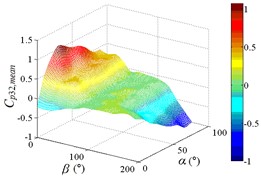
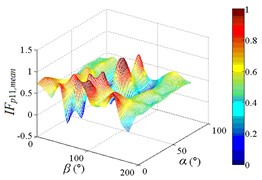
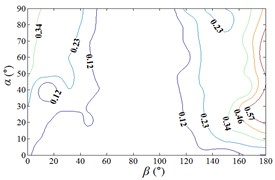
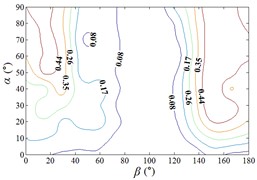
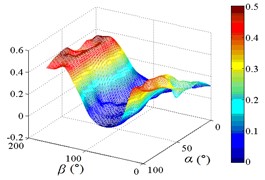
6. Interference effect of mean wind pressure in heliostats
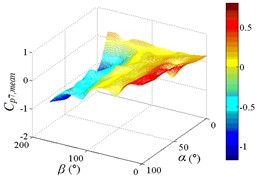
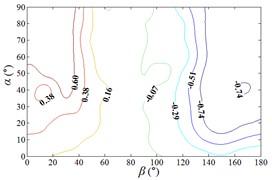
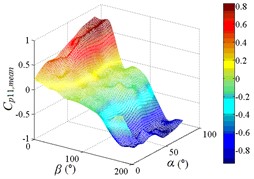
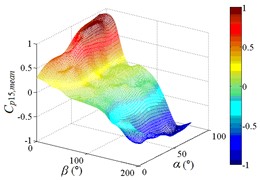
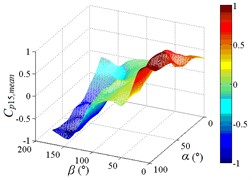
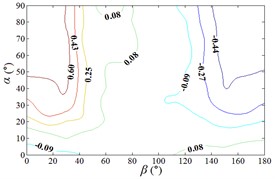
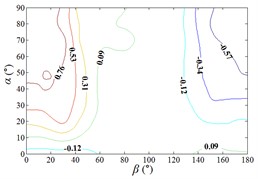
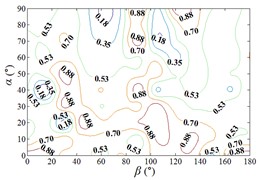
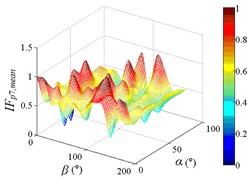
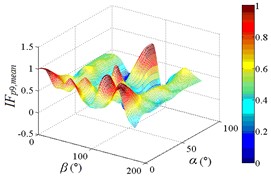
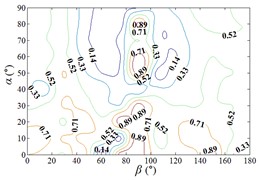
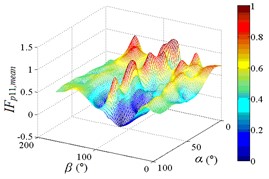
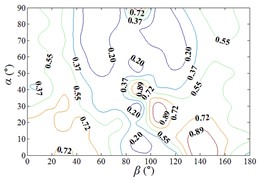
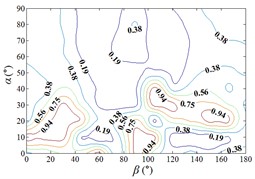
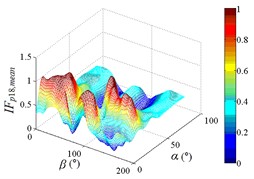
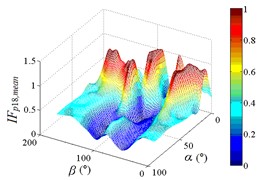
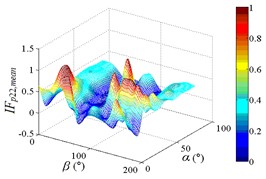
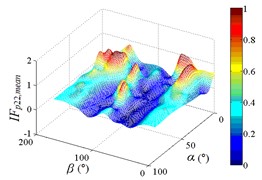
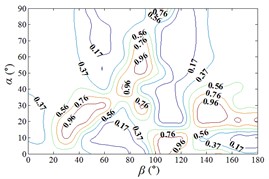
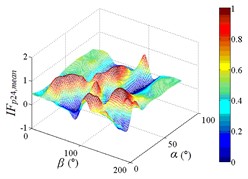
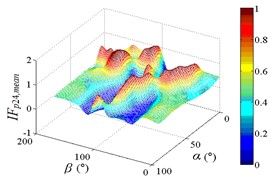
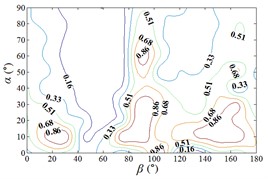
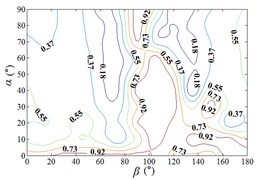
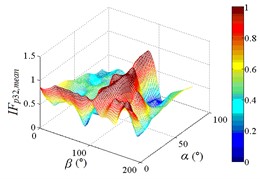
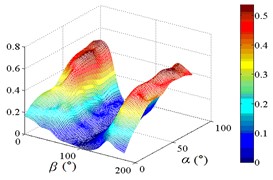
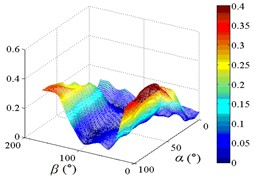
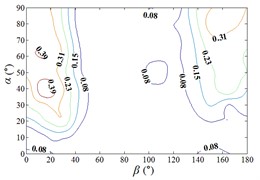
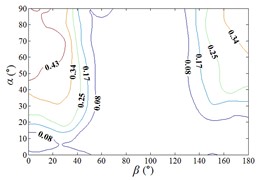
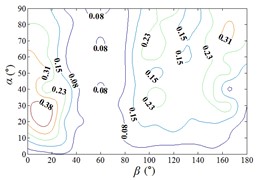
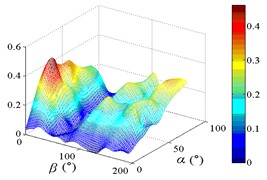
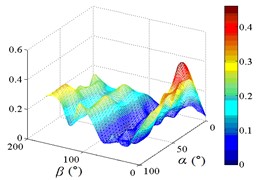
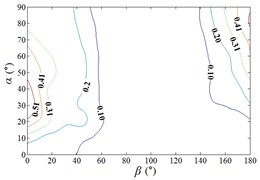
Distribution of interference factor “IF” of mean wind pressure coefficient are shown in Fig. 20.
According to the analysis of the interference effect of mean wind pressure of ten pressure taps under all working conditions, four characteristics of of ten pressure taps are as follow:
From 0° to 20°, the mirror panel is almost parallel to the ground. And from 90° to 105°, the mirror panel is almost parallel to the incoming wind. Values of are both large in the range of 0° to 20° and in the range of 90° to 105°. And the shape of distribution of larger value is similar to the English letter “T”. Values of under most working conditions are concentrated between 0.7 to 1.0, which are indicated that the interference effect is small. The maximum value of is 1.0, which is indicated that peripheral heliostats are not interfere the middle heliostat.
In the range of 45° to 75°, 20° to 90° and in the range of 120° to 135°, 20° to 90°, values of are small. Regions of smaller values distribution are on both sides of regions of larger values distribution. Values of under most working conditions are concentrated between 0.1 to 0.4, which are indicated that the interference effect is large and peripheral heliostats are interfered the middle heliostat.
In the range of 0° to 30°, 20° to 90° and in the range of 150° to 180°, 20° to 90°, the mirror panel is almost facing the incoming wind or the back of mirror panel is almost facing the incoming wind. Values of under most working conditions are concentrated between 0.4 to 0.6.
Fig. 20Distribution of IFpi,mean of heliostats
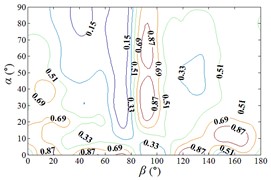
a1) Contour of pressure tap A1
a2) One visual angle of 3D of A1
a3) Another visual angle of 3D of A1
b1) Contour of pressure tap A7
b2) One visual angle of 3D of A7
b3) Another visual angle of 3D of A7
c1) Contour of pressure tap A9
c2) One visual angle of 3D of A9
c3) Another visual angle of 3D of A9
d1) Contour of pressure tap A11
d2) One visual angle of 3D of A11
d3) Another visual angle of 3D of A11
e1) Contour of pressure tap A15
e2) One visual angle of 3D of A15
e3) Another visual angle of 3D of A15
f1) Contour of pressure tap A18
f2) One visual angle of 3D of A18
f3) Another visual angle of 3D of A18
g1) Contour of pressure tap A22
g2) One visual angle of 3D of A22
g3) Another visual angle of 3D of A22
h1) Contour of pressure tap A24
h2) One visual angle of 3D of A24
h3) Another visual angle of 3D of A24
i1) Contour of pressure tap A26
i2) One visual angle of 3D of A26
i3) Another visual angle of 3D of A26
j1) Contour of pressure tap A32
i2) One visual angle of 3D of A32
i3) Another visual angle of 3D of A32
If the occlusion area is divided into 0 % to 100 %, the interference effect of peripheral heliostats to the middle heliostat is small when the occlusion area is almost 0 %. However, the interference effect of peripheral heliostats to the middle heliostat is large when the range of occlusion area is almost 50 %, and the interference effect of peripheral heliostats to the middle heliostat is in the middle when the range of occlusion area is almost 100 %.
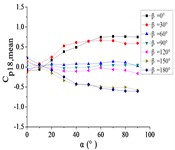
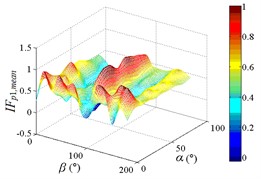
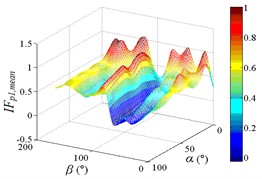
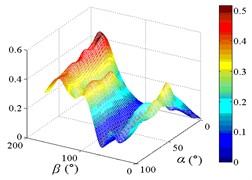
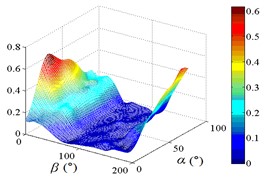
Fig. 21Envelope diagram of IFpi,mean
a1) Contour of pressure tap A1
a2) One visual angle of 3D of A1
a3) Another visual angle of 3D of A1
b1) Contour of pressure tap A7
b2) One visual angle of 3D of A7
b3) Another visual angle of 3D of A7
c1) Contour of pressure tap A9
c2) One visual angle of 3D of A9
c3) Another visual angle of 3D of A9
d1) Contour of pressure tap A11
d2) One visual angle of 3D of A11
d3) Another visual angle of 3D of A11
e1) Contour of pressure tap A15
e2) One visual angle of 3D of A15
e3) Another visual angle of 3D of A15
f1) Contour of pressure tap A18
f2) One visual angle of 3D of A18
f3) Another visual angle of 3D of A18
g1) Contour of pressure tap A22
g2) One visual angle of 3D of A22
g3) Another visual angle of 3D of A22
h1) Contour of pressure tap A24
h2) One visual angle of 3D of A24
h3) Another visual angle of 3D of A24
i1) Contour of pressure tap A26
i2) One visual angle of 3D of A26
i3) Another visual angle of 3D of A26
j1) Contour of pressure tap A32
j2) One visual angle of 3D of A32
j3) Another visual angle of 3D of A32
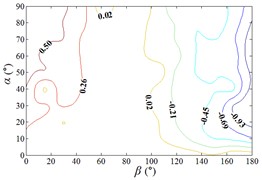
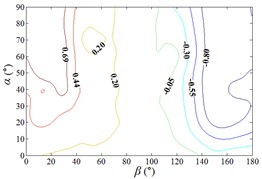
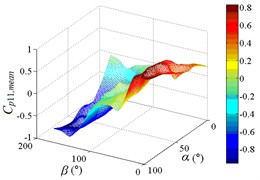
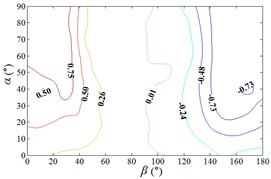
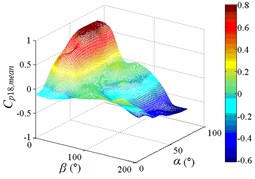
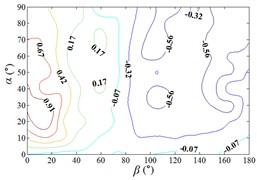
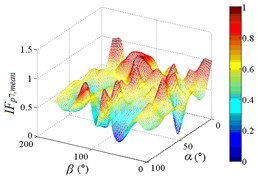
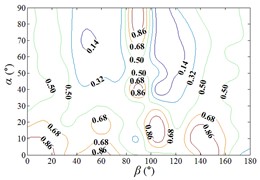
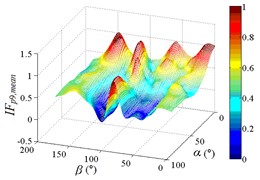
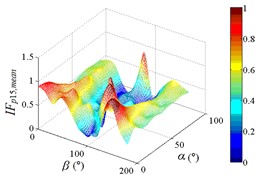
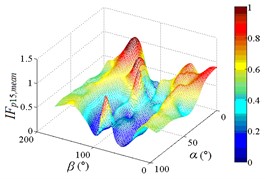
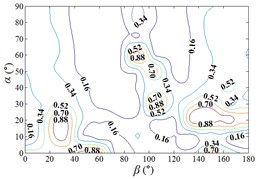
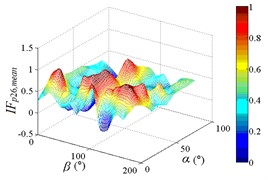
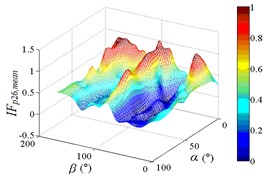
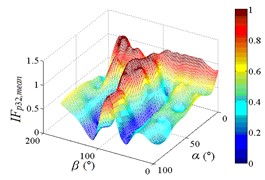
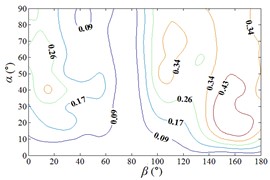
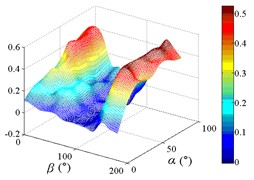
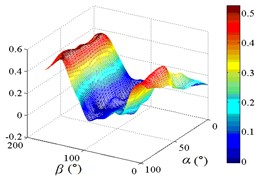
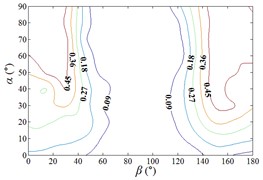
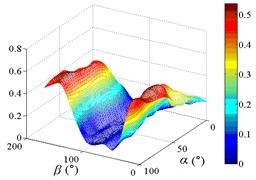
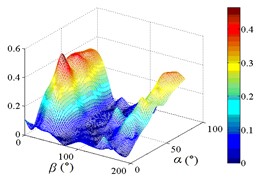
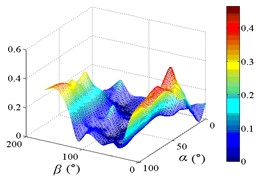
In order to obtain the parameters of mean wind pressure coefficient interference factor which can be provide reference for the design, the maximum value of mean wind pressure coefficient in isolated heliostat are taken as values of denominator in Eq. (5), and envelope figures of mean wind pressure coefficient interference factor are obtained.
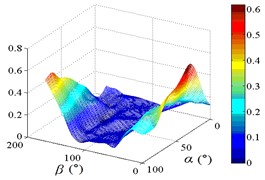
Due to the influence of heliostats occlusion, values of is less than 0.6 in most working conditions. From 0° to 90°, as increase of , value of is decreased, and from 90° to 180°, as increase of , value of is increased. Maximum values of in the envelope diagram are appeared in the range of 0° to 15° and in the range of 165° to 180°. Minimum values of in the envelope diagram are appeared in the range of 75° to 105°. The 3D diagram of Envelope diagram of is similar to the English letter “U”. The maximum value and the corresponding working condition of interference factor of mean wind pressure coefficient in the envelop diagram are shown in Table 5.
The maximum value in the envelope diagram of interference factor of mean wind pressure coefficient is the ratio of the maximum value of mean wind pressure coefficient of heliostats to the maximum value of mean wind pressure coefficient of isolated heliostat. The maximum interference effect of mean wind pressure coefficient of heliostats can be analyzed, and the reference for the design of heliostats can be provided by the analysis result. Therefore, researchers should pay attention to the mechanical properties of heliostats under working conditions in Table 5.
Table 5The maximum value and the corresponding working condition of interference factor of mean wind pressure coefficient in the envelop diagram
Interference factor of mean wind pressure coefficient | |||||
Maximum value | 0.510 | 0.684 | 0.520 | 0.489 | 0.534 |
working condition | 165-20 | 180-30 | 165-70 | 165-30 | 15-90 |
Interference factor of mean wind pressure coefficient | |||||
Maximum value | 0.397 | 0.467 | 0.509 | 0.435 | 0.615 |
working condition | 15-70 | 15-40 | 0-70 | 15-30 | 0-30 |
7. Conclusions
In the wind tunnel test, contours of the mean wind pressure coefficient of mirror panel of heliostats under the typical working conditions are obtained. Ten representative pressure taps are selected to analyze the variation law of wind pressure coefficient with change of wind direction angle and elevation angle. Then the variation law of wind pressure coefficient of ten pressure taps under all working conditions is analyzed. Finally, the interference effect of mean wind pressure coefficient of heliostats is studied. The conclusions are summarized as follow:
When 0°, the incoming wind that is touched at the edge of mirror panel will be shunted. Air flow is acted on the back of the mirror panel, the minimum value of is in the edge of the mirror panel that is touched the incoming wind at first and then increased from the edge to the distal end edge or distal end corner.
From 0° to 180° (except for 0°) and when 90° (except for 60°), the maximum value of is in the lower edge of the mirror panel and then decreased on the other parts of mirror panel. When 90°, values of in the mirror panel are almost negative. The minimum value of is in the edge or corner of mirror panel that is touched the incoming wind at first and then increased from the edge or corner to the distal end edge or distal end corner.
The variation law of wind pressure coefficient of ten representative pressure taps with change of wind direction angle and elevation angle are analyzed. And the maximum (minimum) value of the mean wind pressure coefficient of ten representative pressure taps of heliostats mirror panel under all working conditions are analyzed. The most unfavorable working condition to be considered in structural design and to be provided a reference for the analysis.
The variation law of mean wind pressure coefficient of 10 pressure taps of different position under all working conditions is analyzed. The variation law of the mean wind pressure coefficient under all working conditions of ten pressure taps is similar. Only the working condition of the maximum and minimum is affect by the different position of pressure taps. It should be studied and analyzed the corresponding working condition of the maximum (minimum) value of the mean wind pressure coefficient according to the working condition in actual. The basis for the research and analysis of the key working conditions of the screening of heliostats can be provided by the result.
The variation law of mean wind pressure coefficient interference effect is obtained. In the range of 0° to 180°, 0° to 20° and in the range of 90° to 105°, 0° to 90°, values of interference factor of mean wind pressure coefficient is large. It is indicated that the reduction of the mean wind pressure coefficient of heliostats is small and the interference effect is also small. The mean wind pressure coefficient of heliostats are decreased under other working conditions and the interference factors are decreased accordingly. It is indicated that the interference effect is increased. The maximum (minimum) value and corresponding working condition of interference effect can be obtained. The basis for the research and analysis of the key working conditions of the screening of heliostats also can be provided by the result, and the reference for the design of heliostats also can be provided by the result.
References
-
F. Trieb, “Competitive solar thermal power stations until 2010-the challenge of market introduction,” Renewable Energy, Vol. 19, No. 1-2, pp. 163–171, Jan. 2000, https://doi.org/10.1016/s0960-1481(99)00052-x
-
A. Pfahl et al., “Reduced to minimum cost: lay-down heliostat with monolithic mirror-panel and closed loop control,” SolarPACES 2017: International Conference on Concentrating Solar Power and Chemical Energy Systems, Vol. 2033, No. 1, 2018, https://doi.org/10.1063/1.5067066
-
P. J. Brosens, “Oscillations of a rigid heliostat mirror caused by fluctuating wind,” Solar Energy, Vol. 4, No. 1, p. 49, Jan. 1960, https://doi.org/10.1016/0038-092x(60)90052-9
-
P. J. Brosens, “Aerodynamic stability of a heliostat structure,” Solar Energy, Vol. 4, No. 1, p. 49, Jan. 1960, https://doi.org/10.1016/0038-092x(60)90051-7
-
S. Hoyer, “Wind excited rigid-body vibrations of the heliostat mirror for the proposed dept. of defense solar furnace,” Solar Energy, Vol. 6, No. 4, p. 169, Oct. 1962, https://doi.org/10.1016/0038-092x(62)90144-5
-
O. Yemenici and M. O. Aksoy, “An experimental and numerical study of wind effects on a ground-mounted solar panel at different panel tilt angles and wind directions,” Journal of Wind Engineering and Industrial Aerodynamics, Vol. 213, p. 104630, Jun. 2021, https://doi.org/10.1016/j.jweia.2021.104630
-
X.-H. He, H. Ding, H.-Q. Jing, F. Zhang, X.-P. Wu, and X.-J. Weng, “Wind-induced vibration and its suppression of photovoltaic modules supported by suspension cables,” Journal of Wind Engineering and Industrial Aerodynamics, Vol. 206, p. 104275, Nov. 2020, https://doi.org/10.1016/j.jweia.2020.104275
-
S. Benammar and K. F. Tee, “Structural reliability analysis of a heliostat under wind load for concentrating solar power,” Solar Energy, Vol. 181, pp. 43–52, Mar. 2019, https://doi.org/10.1016/j.solener.2019.01.085
-
B. Ji, Q. Xiong, P. Xing, and P. Qiu, “Dynamic response characteristics of heliostat under hail impacting in Tibetan Plateau of China,” Renewable Energy, Vol. 190, pp. 261–273, May 2022, https://doi.org/10.1016/j.renene.2022.03.132
-
J. H. Strickland, R. R. Matty, and G. H. Barton, “Vortex shedding from square plates perpendicular to a ground plane,” AIAA Journal, Vol. 18, No. 6, pp. 715–716, Jun. 1980, https://doi.org/10.2514/3.7680
-
J. Peterka, B. Bienkiewicz, N. Hosoya, and J. Cermak, “Heliostat mean wind load reduction,” Energy, Vol. 12, No. 3-4, pp. 261–267, Mar. 1987, https://doi.org/10.1016/0360-5442(87)90084-3
-
M. J. Emes, A. Jafari, F. Ghanadi, and M. Arjomandi, “Hinge and overturning moments due to unsteady heliostat pressure distributions in a turbulent atmospheric boundary layer,” Solar Energy, Vol. 193, pp. 604–617, Nov. 2019, https://doi.org/10.1016/j.solener.2019.09.097
-
M. J. Emes, F. Ghanadi, M. Arjomandi, and R. M. Kelso, “Investigation of peak wind loads on tandem heliostats in stow position,” Renewable Energy, Vol. 121, pp. 548–558, Jun. 2018, https://doi.org/10.1016/j.renene.2018.01.080
-
J. R. Wolmarans and K. J. Craig, “One-way fluid-structure interaction of a medium-sized heliostat using scale-resolving CFD simulation,” Solar Energy, Vol. 191, pp. 84–99, Oct. 2019, https://doi.org/10.1016/j.solener.2019.08.068
-
Q. Xiong, Z. Li, H. Luo, Z. Zhao, and A. Jiang, “Study of probability characteristics and peak value of heliostat support column base shear,” Renewable Energy, Vol. 168, pp. 1058–1072, May 2021, https://doi.org/10.1016/j.renene.2020.12.027
-
M. J. Emes, A. Jafari, J. Coventry, and M. Arjomandi, “The influence of atmospheric boundary layer turbulence on the design wind loads and cost of heliostats,” Solar Energy, Vol. 207, pp. 796–812, Sep. 2020, https://doi.org/10.1016/j.solener.2020.07.022
-
Y. G. Wang, Z. N. Li, B. Gong, and Q. S. Li, “Wind pressure and wind-induced vibration of heliostat,” Key Engineering Materials, Vol. 400-402, pp. 935–940, Oct. 2008, https://doi.org/10.4028/www.scientific.net/kem.400-402.935
-
B. Gong, Z. Wang, Z. Li, C. Zang, and Z. Wu, “Fluctuating wind pressure characteristics of heliostats,” Renewable Energy, Vol. 50, pp. 307–316, Feb. 2013, https://doi.org/10.1016/j.renene.2012.06.037
-
M. Hussain and B. E. Lee, “A wind tunnel study of the mean pressure forces acting on large groups of low-rise buildings,” Journal of Wind Engineering and Industrial Aerodynamics, Vol. 6, No. 3-4, pp. 207–225, Oct. 1980, https://doi.org/10.1016/0167-6105(80)90002-1
-
D. Surry and W. Mallais, “Adverse local wind loads induced by adjacent building,” Journal of Structural Engineering, Vol. 109, No. 3, pp. 816–820, Mar. 1983, https://doi.org/10.1061/(asce)0733-9445(1983)109:3(816)
-
E. C. English, “Shielding factors from wind-tunnel studies of prismatic structures,” Journal of Wind Engineering and Industrial Aerodynamics, Vol. 36, No. 3, pp. 611–619, Jan. 1990, https://doi.org/10.1016/0167-6105(90)90404-z
-
X. Zhang, “Interference effects of wind on the responses of tall buildings,” Journal of Wind Engineering and Industrial Aerodynamics, Vol. 41, No. 1-3, p. 867, Oct. 1992, https://doi.org/10.1016/0167-6105(92)90507-7
-
A. Kareem, T. Kijewski, and P.-C. Lu, “Investigation of interference effects for a group of finite cylinders,” Journal of Wind Engineering and Industrial Aerodynamics, Vol. 77-78, pp. 503–520, Sep. 1998, https://doi.org/10.1016/s0167-6105(98)00168-8
-
Z. N. Xie and M. Gu, “Mean interference effects among tall buildings,” Engineering Structures, Vol. 26, No. 9, pp. 1173–1183, Jul. 2004, https://doi.org/10.1016/j.engstruct.2004.03.007
-
Z. N. Xie and M. Gu, “Simplified formulas for evaluation of wind-induced interference effects among three tall buildings,” Journal of Wind Engineering and Industrial Aerodynamics, Vol. 95, No. 1, pp. 31–52, Jan. 2007, https://doi.org/10.1016/j.jweia.2006.05.003
-
A. Pfahl et al., “Progress in heliostat development,” Solar Energy, Vol. 152, pp. 3–37, Aug. 2017, https://doi.org/10.1016/j.solener.2017.03.029
-
B. Huang, “Study on the flow field of wind-blown sand and its effect on low-rise buildings,” (in Chinese), Hunan University, 2019.
-
B. Gong, Z. Li, Z. Wang, and Y. Wang, “Wind-induced dynamic response of Heliostat,” Renewable Energy, Vol. 38, No. 1, pp. 206–213, Feb. 2012, https://doi.org/10.1016/j.renene.2011.07.025
-
F. W. Lipps and L. L. Vant-Hull, “A cellwise method for the optimization of large central receiver systems,” Solar Energy, Vol. 20, No. 6, pp. 505–516, 1978, https://doi.org/10.1016/0038-092x(78)90067-1
-
Q. Xiong, Z. Li, H. Luo, and Z. Zhao, “Wind tunnel test study on wind load coefficients variation law of heliostat based on uniform design method,” Solar Energy, Vol. 184, pp. 209–229, May 2019, https://doi.org/10.1016/j.solener.2019.03.082
-
S. Becker, H. Lienhart, and F. Durst, “Flow around three-dimensional obstacles in boundary layers,” Journal of Wind Engineering and Industrial Aerodynamics, Vol. 90, No. 4-5, pp. 265–279, May 2002, https://doi.org/10.1016/s0167-6105(01)00209-4
About this article

The work described in this paper is fully supported by the National Natural Science Foundation of China Project [Grant number: 51678233]; Science and Technology Plan Project of Hunan Construction Engineering Group [Grant number: JGJTK2021-20].
The datasets generated during and/or analyzed during the current study are available from the corresponding author on reasonable request.
Xuan Li and Feifei Wang carried out indoor tests. Qiwei Xiong, Xuan Li and Feifei Wang wrote the paper. Anmin Jiang and Yanchen Dong reviewed the test plan and the manuscript of the paper.
The authors declare that they have no conflict of interest.
