Abstract
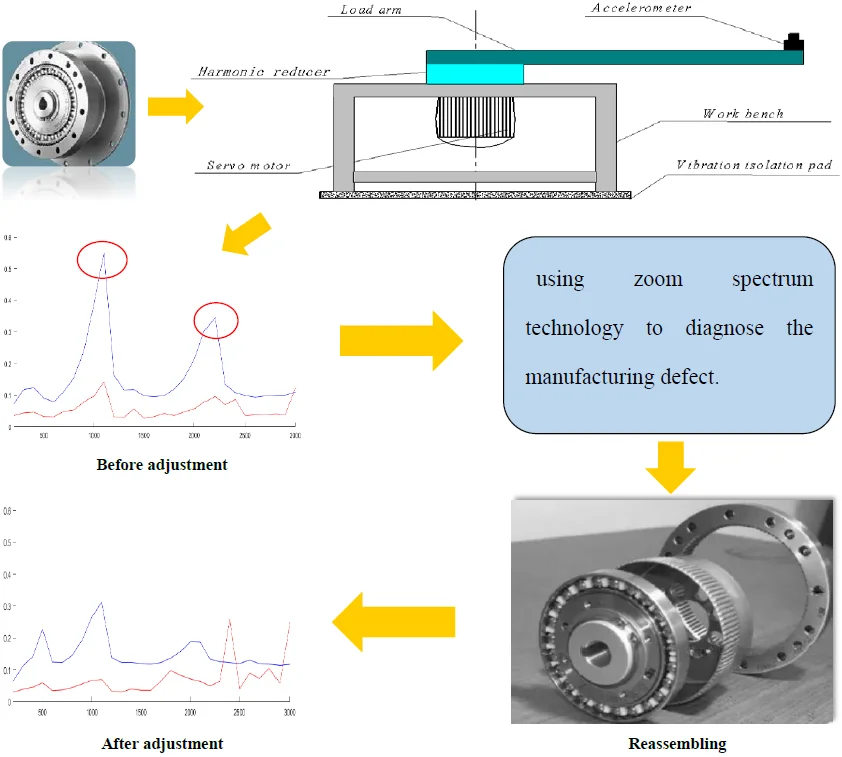
This paper will introduce the torsional vibration test method and signal analysis for a harmonic reducer in industrial robot. The harmonic reducer is generally applied to the fifth and sixth axes of the industrial robots, and the torsional vibration will affect the mechanical performance. To understand the torsional vibration condition of the harmonic reducer, the test device is set up through loading the corresponding moment of inertia. In the study, the curve of torsional characteristic is obtained, and it can be used to assess the mechanical performance; Using zoom spectrum technology on harmonic resonance, the characteristic frequency is identified in detail. The manufacturing defect of the harmonic reducer is diagnosed based on characteristic frequencies of its transmission, and defect elimination is successfully realized by adjustment of components in the harmonic driver; Some nonlinear vibration characteristics caused by stiffness with time periodic dependent, including bi-spectrum and harmonic resonance, etc., are investigated. The experimental results show that the test and analysis of torsional vibration have positive significance for the online quality assembly assurance of harmonic reducer.
Highlights
- The curve of torsional characteristic can be used to assess the mechanical dynamic performance of a harmonic driver.
- Using zoom spectrum technology on harmonic resonance, multiple characteristic frequencies will be identified with higher resolution, and the manufacturing defect can be diagnosed.
- Some nonlinear phenomenon, such as bi-spectrum, harmonic resonance in the spectrum and property of quasi-periodic in phase space, can be observed from the measured result.
1. Introduction
Under the action of the wave generator, the flexible pinion of the harmonic reducer continuously meshes with the rigid gear to realize the less-tooth power transmission [1]. It has advantages of small size and large transmission ratio, so it is widely used in various types of robot end joints. Henri Champliaud et al. believe that torsional stiffness is a key factor in the positioning accuracy and control of harmonic drive. They established the finite element model to find the stiffness of the wave generator has a significant impact on torsional stiffness in the harmonic driver under different torque loads, and the stiffness of the flexible wheel has different effects on the torsional stiffness [2]. M. Masoumi, H. Alimohammadi et al. used the shell theory to derive the vibration equations of the flexible wheel and the rigid wheel in the harmonic drive system, calculated the vibration response of the system in the moving condition, and studied the influence of the tooth profile and assembly eccentricity of the flexible wheel on harmonic drive system [3].
In this paper, according to the load of the harmonic reducer on the fifth axis of the industrial robot, the asymmetric inertia load of the harmonic reducer is used in the torsional vibration test [4, 5]. Meanwhile, signal processing and identification for torsional vibration are carried out.
2. Torsional vibration test
2.1. Test device
The 3D model of the 6 kg welding robot is shown in Fig. 1, where the fifth and sixth axis joints are all driven by harmonic reducers. The harmonic reducer in the fifth axis joint is subjected to an eccentric inertial load in the end. To simulate the actual working condition of the industrial robot, the equivalent moment of inertia is developed, and the torsional vibration test is performed on the harmonic reducer.
The end other than the fifth axis is divided into two parts, the welding torch and the end joint structure , and their moments of inertia to the fifth axis joint center line I can be calculated respectively. Then the moment of inertia of the end to the fifth axis joint is:
where and are the masses of and , and and are the distances from the center of mass to the center line of the fifth axis.
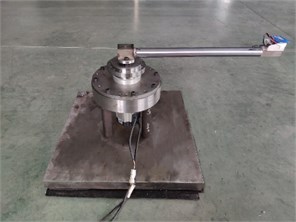
According to the moment of inertia P, the corresponding equivalent load arm is developed, and it is fixed to the output of harmonic driver. As shown in Fig. 3, it is a torsional vibration test device of harmonic reducer. The input end of the harmonic reducer is connected with a servo motor with adjustable speed. The wireless acceleration sensor is placed 0.55 m away from the center of rotation of the motor shaft. The circumferential vibration acceleration of the harmonic reducer is picked up, and it is used to reflect the torsional vibration acceleration or smoothness of rotation in practice.
Fig. 13D model of welding robot
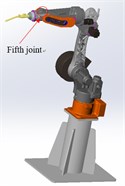
Fig. 2Partial enlarged drawing of a load on the fifth axis joint
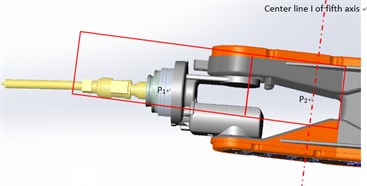
Fig. 3Schematic diagram of torsional vibration test device
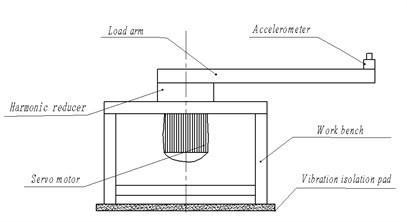
Fig. 4Torsional vibration test device
2.2. Measurement
The physical picture of the torsional vibration test device of harmonic reducer is shown in Fig. 4. The test sample is a SHG-20-80 harmonic reducer with transmission ratio 80. Referring to the working condition of industrial robot, the rotation speed of the motor is set from 300 rpm to 3000 rpm at an interval of 100 rpm, and the time history of torsional vibration corresponding to each speed is recorded.
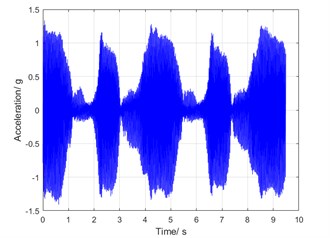
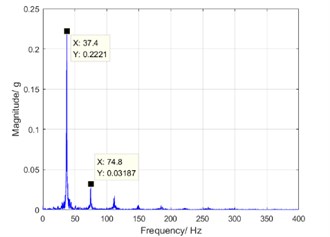
Fig. 5(a) is the time history of the torsional vibration acceleration, and Fig. 5(b) is a corresponding spectrum of it. It can be clearly observed that the torsional vibration components are mainly distributed in the low frequency band, and the components of the high frequency band correspond to the gear meshing frequency of the harmonic reducer. Since the high frequency components contribute a little to the vibration displacement [6, 7], the investigation focuses on the low frequency components of vibration.
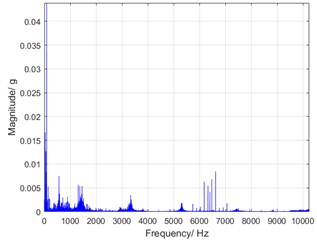
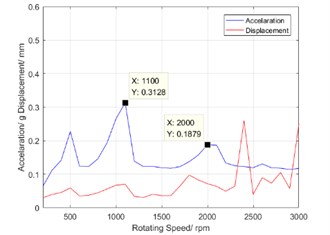
In engineering practice, the curve of vibration acceleration RMS value with speed and the curve of displacement RMS value with speed are used to evaluate the torsional vibration characteristics of a harmonic reducer [8]. They can intuitively reflect the vibration dynamic performance of the harmonic reducer. Fig. 6 shows the curve of vibration acceleration RMS value with speed and the curve of vibration displacement RMS value with speed. There are two peaks at the speed of 1100 rpm and 2200 rpm. Due to the peaks existing in the curve of torsional vibration characteristic, the vibration strength will be over large in application of industrial robot. Therefore, it is necessary to diagnose the defect source for harmonic reducer using the signal characteristics of torsional vibration.
Fig. 5Torsional vibration acceleration at speed of 2000 rpm
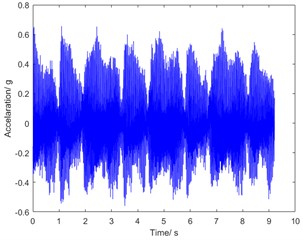
a) Time history
b) Spectrum
Fig. 6Torsional characteristic curve
3. Spectral feature
Harmonic drive is a gear drive with less-tooth difference. The number of teeth of the rigid gear is two more than that of the flexible pinion. When the cam rotates a turn, the flexible pinion rotates one turn and the two teeth. Assume that the number of teeth of the flexible pinion is , the cam rotates one revolution , and the corresponding frequency is . Then, the rotation frequency of the flexible pinion is , and the rotation frequency of the rigid gear is. Thus, the value of is close to . According to the transmission principle of the harmonic reducer, the formula of characteristic frequency is listed in Table 1, and the detailed characteristic frequencies are given when the cam runs at speed of 1100 rpm.
Since the characteristic frequency of the rigid gear is very similar to that of the flexible pinion, the spectral feature will be bi-spectrum. At the rotation speed of 1100 rpm, the frequency difference is 0.5 Hz, which produces a significant beat, as shown in Fig. 7(a). The vibration phenomenon of beat is caused by the inherent structure of teeth difference between the flexible pinion and the rigid gear.
To clearly observe the phenomenon of bi-spectrum, the first and second order frequency components are zoomed on the frequency coordinates. Then, a double peak can be seen in the zoom spectrum as shown in Figs. 8(a) and (b). In the bi-spectrum, the left peak is caused by the cumulative error of the rigid gear tooth and the cam profile error, and the right peak is caused by the accumulation error of the flexible pinion tooth or the eccentricity in driving shaft. Base on this property, defect diagnosing can be carried out for harmonic driver.
Table 1Characteristic frequencies in harmonic driver
Contents | Characteristic frequency formula | Characteristic frequency at 1100 rpm (Hz) |
Cam | 2/60 | 36.67 |
Rigid gear | 2/60 | 36.67 |
Flexible pinion | 37.125 | |
Meshing frequency | 5867 | |
Flexible bearing outer ring | 2.4 | |
Flexible bearing ball rotation | 25.57 |
Fig. 7Torsional vibration at rotation speed of 1100 rpm
a) Time history
b) Spectrum
Fig. 8Zoom spectrum on harmonic resonance
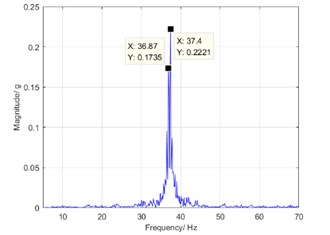
a) The first order frequency component
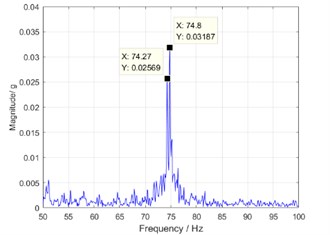
b) The second order frequency component
4. Defect elimination
As shown in Fig. 6, the vibration magnitude of the harmonic reducer is abnormal when the input shaft speed is at 1100 rpm and 2200 rpm. Meanwhile, observe that the right peak is higher than the left one in the first order zoom spectrum as shown in Fig. 7. Therefore, the dominant vibration may be caused by the eccentricity of driving components or the corresponding assembly problems based on the characteristic frequencies in Table 1.
In the study, the misalignment in the drive shaft is reduced by improving the design of the assembly structure. The torsional vibration spectrums before and after adjusting process are shown in Fig. 9. At the rotation speed of 1100 rpm, the peak of the dominant component is reduced by about 30 % after the adjustment. It means that the peak of harmonic resonance is reduced and defect elimination is successfully realized.
As a result, the magnitude of torsional vibration is significantly reduced. Compared with the curve before adjustment as shown in Fig. 6, the curve of torsional vibration characteristic after adjustment as shown in Fig. 10 has been significantly improved.
Fig. 9Torsional spectrum before and after adjustment at the rotation speed of 1100 rpm
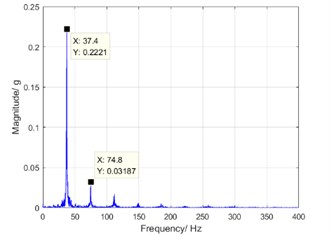
a) Before adjustment
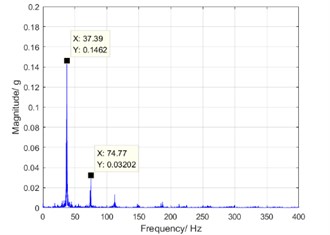
b) After adjustment
Fig. 10Torsional characteristic curve after adjustment
5. Harmonic resonance
Due to the cumulative error of the rigid gear and the flexible pinion in the gear manufacturing process, the torsional stiffness changes periodically with the transmission angle in the harmonic reducer. Therefore, the parameter torsional vibration will occur when the harmonic driver runs. Parametric vibration is a kind of nonlinear phenomenon. In the practice, typical parametric vibration characteristics, such as harmonic resonance and quasi-period, are found in the vibration spectrum and the phase space.
Fig. 11 are corresponding to spectrograms of sixth-order resonance (500 rpm), fourth-order resonance (800 rpm) when harmonic reducer runs, respectively. The phenomenon of harmonic resonance can be obviously seen.
Fig. 11Phenomenon of harmonic resonance
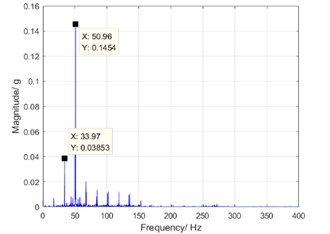
a) Six-order harmonic resonance at the speed of 500 rpm
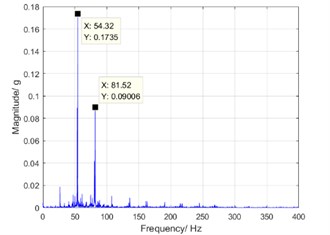
b) Fourth-order harmonic resonance at the speed of 800 rpm
Fig. 12 is two trajectories in phase diagrams corresponding to 500 rpm, 800 rpm, respectively. The phase diagram of the parametric vibration is of a quasi-periodic motion characteristic.
Fig. 12Trajectory in phase space
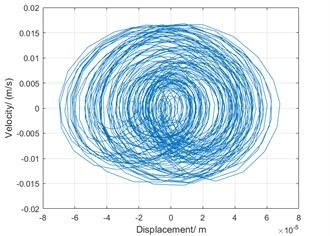
a) Phase diagram of torsional vibration at the speed of 500 rpm
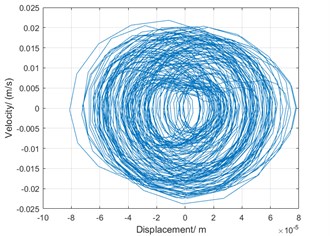
b) Phase diagram of torsional vibration at the speed of 800 rpm
6. Conclusions
The torsional vibration test is carried out on a harmonic reducer in industrial robot with asymmetrical inertia. Some advantages are summarized as follows:
1) The curve of torsional characteristic is easily measured, and it can be used to assess the mechanical dynamic performance of a harmonic driver.
2) If abnormal case occurs in the curve of torsional characteristic, using zoom spectrum technology on harmonic resonance, bi-spectrum will be analyzed in detail and the characteristic frequency will be identified with higher resolution. The manufacturing defect can be diagnosed, and it can be effectively eliminated through adjustment process for components of the harmonic driver. The given technology can be used in on-line quality assurance for product of harmonic driver.
3) If torsional stiffness with time periodic dependent occurs in the harmonic driver, some nonlinear phenomenon, such as bi-spectrum, harmonic resonance in the spectrum and property of quasi-periodic in phase space, can be observed from the measured result.
References
-
Gao H.-B., Zhuang H.-C., Li Z.-G., et al. Optimization and experimental research on a new-type short cylindrical cup-shaped harmonic reducer. Journal of Central South University, Vol. 19, Issue 7, 2012, p. 1869-1882.
-
Rhéaume F.-E., Champliaud H., Liu Z. Understanding and modelling the torsional stiffness of harmonic drives through finite-element method. Proceedings of the Institution of Mechanical Engineers, Part C: Journal of Mechanical Engineering Science, Vol. 223, Issue 2, 2009, p. 515-524.
-
Masoumi M., Alimohammadi H. An investigation into the vibration of harmonic drive systems. Frontiers of Mechanical Engineering, Vol. 8, Issue 4, 2013, p. 409-419.
-
Liu H., Cui S., Liu Y., et al. Design and vibration suppression control of a modular elastic joint. Sensors, Vol. 18, Issue 6, 2018, p. 1869.
-
Gonzalez Buelga A., Clare L. R., Neild S. A., et al. An electromagnetic inerter-based vibration suppression device. Smart Materials and Structures, Vol. 24, Issue 5, 2015, p. 055015.
-
Reducer for high precision control. Nabtesco, http://www.doc88.com/p-381943253074.html.
-
Zhao J., Yan S. Coupling vibration analysis for harmonic drive in joint and flexible arm undergoing large range motion. International Symposium on Flexible Automation, 2016, p. 442-449.
-
Huang D., Du J., Zhang L., et al. A wavelet-based algorithm for numerical integration on vibration acceleration measurement data. Journal of Vibroengineering, Vol. 7, Issue 16, 2014, p. 3469-3479.
About this article

