Abstract
Fractal dimension (FD) analysis has been widely used in signal processing. The key issue in signal processing is the singularity detection. One of the main problems for FD analysis of signals is its susceptibility to measurement noise, likely obscuring the identification of singularities. To address this deficiency, a new physical quantity, named ‘the scale-window fractal dimension (SWFD)’, is proposed and a SWFD analysis method is formed to identify the singularities in the noisy 2D signal. With this method, the noisy 2D signal first is decomposed into sets of scale signals with the aid of 2D Gabor wavelet transforms; then SWFD estimates are calculated along every scale signals to form the FD surface. The singularities can be localized by the sudden changes in the spatial variation of the FD surface. As an application of the method, the identification of damage singularity for an experimental composite plate is performed with the mode shapes measured by a scanning laser vibrometer as the analyzed 2D signals. The results show that the SWFD analysis method has the prominent features of high accuracy of singularity localization and strong robustness to noise.
1. Introduction
Singularity, usually caring the most important information of signal, can be used to determine the abnormal phenomenon of the signal. Hitherto, many kinds of singularity detection techniques have been developed [1], among which the fractal dimension (FD) analysis based methods have been the most widely used ones [2-8]. The FD is a ratio that provides a statistical index of complexity, which compares how the detail in a pattern changes with the scale at which it is measured. Many algorithms for estimating the FD have been proposed, such as algorithms by Pickover and Khorasani [2], Katz [3, 4], Higuchi [5], Maragos and Sun [6], Petrosian [7]. In time series analysis, Katz’s fractal dimension (KFD) calculation is derived directly from a 1D waveform signal, eliminating the preprocessing step of creating a binary sequence and is widely used to quantify the singularity or complexity of a waveform. The KFD for a waveform is defined by [3]:
where is the number of spatial sampling intervals of the waveform under investigation, is the maximum distance between the beginning point and the th point of the sampling sequence under investigation and is the sum of distances between successive points.
One of the successful applications of KFD is to identify damage of beams for health monitoring by the singularity analysis of the beam’s vibrational mode shapes. The typical studies can be seen in references [9-14]. These studies show that the KFD is high sensitivity to the singularities of the mode shapes and can be used to determine the location of the damage. However, an intrinsic deficiency is its susceptibility to measurement noise, likely obscuring the features of damage; besides, few studies applied the KFD to 2D signals for singularity extraction. To address these problems, this study presents an alternative method, which called ‘scale-window fractal dimension (SWFD) analysis’, to study the subtle singularities from the noisy 2D signals. This method involves two main processes: 1) Multi-resolution analysis relying on a 2D wavelet is performed to decompose a noisy 2D signal into multiple frequency-band components. Owing to the difference in frequency content, the noise component and the effective signal component that carries singularity information commonly occupy distinct frequency bands; 2) Parallel SWFD analysis is performed on every frequency-band component to produce a group of FD surface spectrum, of which the FD surface of the effective signal component accommodates the feature of singularity by eliminating the noise component. The method is experimentally validated using a scanning laser vibrometer (SLV) to acquire mode shape signals of an actual composite plate.
2. Scale 2D signals
Let be a 2D signal with the magnitude of signal at the grid point (,). The scale 2D signals can be obtained by the wavelet transform:
where is the amplitude of the point (,) at the scale , the symbol denotes the operation of convolution, and is a 2D wavelet. is defined as the scale 2D signal, conveying the -scale component of .
One of the suitable wavelet for the above processing is the 2D Gabor wavelet which can be defined as [15]:
where is the maximum frequency of the modulating sinusoidal plane wave and is the orientation of the major axis of the elliptical Gaussian. To obtain the scale 2D signals, a simplified form of Eq. (3) can be used here by making 1, 1, 0.
can be transformed into a series of scale 2D signals through Gabor wavelet. The lower- convey higher-frequency components of the 2D signal, and the higher- embody lower-frequency components of the 2D signal. Usually, the noise, trend, and singularity components have higher, lower, and in-between frequencies, respectively. Hence, they can be distributed at different-scale spaces.
3. SWFD analysis
To facilitate the use of KFD for 1D signal, , can be considered as a set of 1D lines approximately, such as:
where is a set of signal lines in the direction, indexed by , 1, 2,…, and is a set of signal lines in the direction, indexed by , 1, 2,…, .
Fusion of and by averaging can introduce a more reliable approximation to with the form as:
To locate the singularity of , a sliding window technique is adopted to produce FD trajectories for every signal lines of and . Let be a general instance of signal lines of . In particular, in the case of and , is a signal line of in the direction; in the case of and , is a signal line of in the direction. Let be a segment of , covering sampling points with the midpoint . A retrofitted KFD defined on is given as:
where and are the scale parameters corresponding to Eq. (1).
The retrofitted KFD, which we call “SWFD”, defines on the segment of the scale signals, not the whole original signal, quantifying the complexity of centered at . The new SWFD provides a way to observe the singularity characteristics from the scale signals. Furthermore, SWFD can calculate FD for each sampling points of the signal, so it has the potential to locate the singularities in space.
By regarding as a sliding window, we can move it to cover the signal line step by step, evaluating the SWFD in terms of Eq. (6) at each step. After the window slides across the signal line, a SWFD trajectory can be formed that depicts the line’s profile of complexity.
Notate and the operation of applying the sliding window individually to all the signal lines of and , respectively. When is performed, a set of SWFD trajectories can be produced, producing an -SWFD surface at the scale :
Similarly, can give rise to a -SWFD surface at the scale from :
and display the profiles of complexity of the and , respectively.
Corresponding to Eq. (5), fusion of and by averaging is adopted to form an --SWFD surface:
provides a full prospect of complexity of by calculating the estimates of SWFD for every sampling points. Singularity can cause a sharply increased SWFD peak of an --SWFD surface, overwhelming the neighboring elements. This SWFD peak creates energy concentration, resulting in low Shannon entropy for the surface. In contrast, noise or global trend components cannot induce energy concentration, usually giving rise to relatively greater Shannon entropy. This effect provides a Shannon entropy-based method [16] for selecting the proper --SWFD surface at a particular scale from the --SWFD surface spectrum of the scale 2D signals for singularity identification.
4. Experimental example
Damage detection in laminated composite plates is a research focus in the filed of structural health monitoring. Vibrational mode shape, a 2D signal, conveys spatial characteristics of the plate being inspected and has the potential to be used to locate damage. The damage detection of an experimental glass fiber reinforced polymer (GFRP) square plate is used here to display the effectiveness of the above SWFD analysis method by calculating the singularities of the mode shape.
4.1. Experimental setup
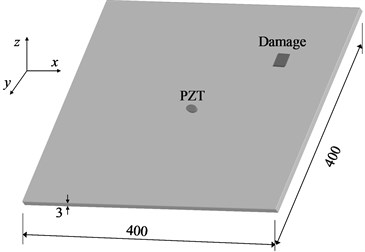
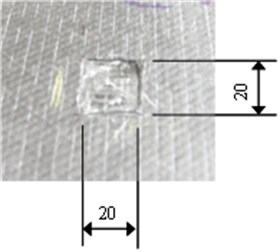
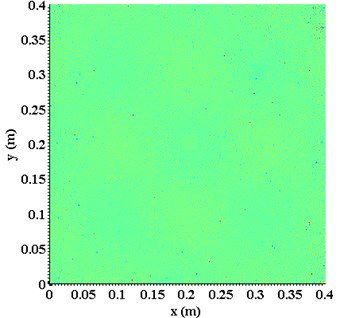
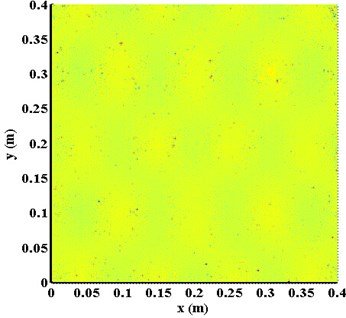
The GFRP plate has dimensions of length 400 mm, width 400 mm, and depth 3 mm. This specimen consists of four-ply unidirectional glass fiber mats oriented in the direction, with one out of four layers are removed from the specimen locally to simulate damage, as enclosed by the little square in Fig. 1. Vibration of the specimen is created using a circular 10 mm-diameter piezoelectric lead-zirconate-titanate (PZT) actuator, located at the geometrical center of the plate, to excite the plate harmonically and perpendicularly. When the specimen vibrates stably, a scanning laser vibrometer (SLV) (Polytec PSV-400) is employed to scan its non-heated surface, to register the isochronous transverse velocities at 374×374 sampling points evenly distributed across the surface. The array of isochronous transverse velocities constitutes mode shapes for the plate, as typically illustrated in Fig. 2 for the mode shapes at natural frequencies of 388.13 Hz and 1126.56 Hz. The mode shapes were disturbed by experimental uncertainty and measurement noise due to the limitation of measurement accuracy.
Fig. 1a) Specimen scheme, b) damage image (unit: mm)
a)
b)
4.2. Results
For the mode shape at natural frequency of 388.13 Hz, the proper --SWFD surface identified by the Shannon entropy-based method is shown in Fig. 3. A cluster of much higher-intensity patches can be clearly observed towards the upper right of the planform, clearly delineating the distribution of the damage. Similar results can be observed under the natural frequency of 1126.56 Hz, as shown in Fig. 4 with as the proper --SWFD surface. These observations validate that the proposed method can localize damage singularity in actual composite plates with great accuracy.
4.3. Comparison with existing methods
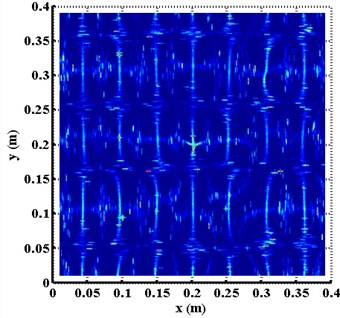
Fig. 5(a) and 5(b) present the results of the planforms of --surfaces , obtained by directly applying the KFD to mode shape lines at natural frequencies of 388.13 Hz and 1126.56 Hz, respectively, while exclusive of the scale concept. Moreover, planforms of the damage detection results constructed using the traditional modal curvature changes method [17] are shown in Fig. 6(a) and 6(b), respectively, based on the two different mode shapes. When comparing Fig. 5 and Fig. 6 with Fig. 1, respectively, it becomes clear that the damage singularity features can not be identified in these two cases.
Fig. 2Mode shapes at natural frequencies
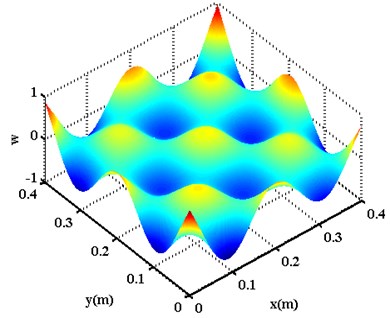
a) 388.13 Hz
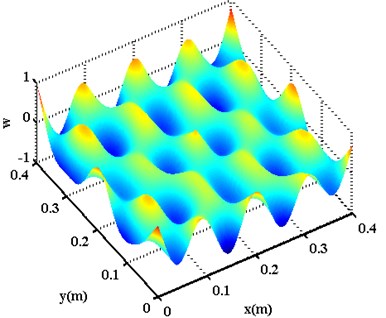
b) 1126.56 Hz
Fig. 3Planform of Πx+y9 constructed using the mode shape at natural frequency of 388.13 Hz
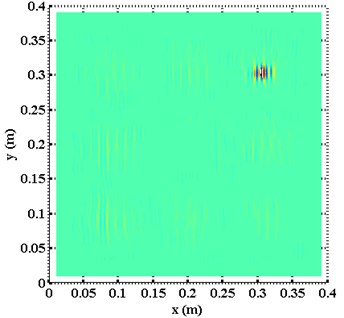
Fig. 4Planform of Πx+y8 constructed using the mode shape at natural frequency of 1126.56 Hz
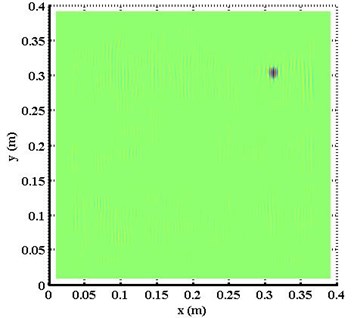
Fig. 5Planforms of Πx+y constructed using the mode shapes at natural frequencies
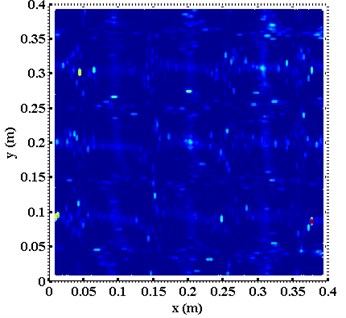
a) 388.13 Hz
b) 1126.56 Hz
Fig. 6Planforms of curvature mode shapes constructed using the mode shapes at natural frequencies
a) 388.13 Hz
a) 1126.56 Hz
5. Conclusions
New physical quantity, the SWFD, is proposed with the aim of detecting the singularity of the signal, while overcoming the weakness of susceptibility to noise of KFD. A SWFD analysis method is then formed based on combining the merits of wavelet transform for decomposing the signal into distinct scale signals to separate the noise and singularity information in different frequency bands and KFD in singularity characterization. The identification of damage for an experimental GFRP plate is used as an application of the proposed method, with the mode shapes measured by SLV as the analyzed 2D signals. The results show that the SWFD analysis method has an excellent ability to identify singularities in noisy 2D signals, and it’s a practical technology for structure damage diagnosis in plates.
References
-
Gautam S. Muralidhar, Alan C. Bovik, Mia K. Markey A steerable, multiscale singularity index. IEEE Signal Processing Letters, Vol. 20, Issue 1, 2013, p. 7-10.
-
Pickover C. A., Khorasani A. Fractal characterization of speech waveform graphs. Computers and Graphics, Vol. 10, Issue 1, 1986, p. 51-61.
-
Katz M. J. Fractals and the analysis of waveforms. Computers in Biology and Medicine, Vol. 18, Issue 3, 1988, p. 145-156.
-
Bai R. B., Radzieński M., Cao M. S., Ostachowicz W., Su Z. Non-baseline identification of delamination in plates using wavelet-aided fractal analysis of two-dimensional mode shapes. Journal of Intelligent Material Systems and Structures, Vol. 26, Issue 17, 2015, p. 2338-2350.
-
Higuchi T. Approach to an irregular time series on the basis of the fractal theory. Physica D: Nonlinear Phenomena, Vol. 31, Issue 2, 1988, p. 277-283.
-
Maragos P., Sun F. K. Measuring the fractal dimension of signals: morphological covers and iterative optimization. IEEE Transactions on Signal Processing, Vol. 41, Issue 1, 1993, p. 108-121.
-
Petrosian A. Kolmogorov complexity of finite sequences and recognition of different preictal EEG patterns. Proceedings of 8th Annual IEEE Symposium on Computer-Based Medical Systems, IEEE Computer Society, Washington, DC, 1995, p. 212-217.
-
Cao M. S., Xu H., Bai R. B., Ostachowicz W., Radzieński M., Chen L. Damage characterization in plates using singularity of scale mode shapes. Applied Physics Letters, Vol. 106, 2015, p. 121906.
-
Hadjileontiadis L. J., Douka E., Trochidis A. Fractal dimension analysis for crack identification in beam structures. Mechanical Systems and Signal Processing, Vol. 19, Issue 3, 2005, p. 659-674.
-
Qiao P., Cao M. S. Waveform fractal dimension for mode shape-based damage identification of beam-type structures. International Journal of Solids and Structures, Vol. 45, Issues 22-23, 2008, p. 5946-5961.
-
Katunin A. Fractal dimension-based crack identification technique of composite beams for on-line SHM systems. Machine Dynamics Research, Vol. 34, Issue 2, 2010, p. 60-69.
-
Li H., Huang Y., Ou J., Bao Y. Fractal dimension-based damage detection method for beams with a uniform cross-section. Computer-Aided Civil and Infrastructure Engineering, Vol. 26, Issue 3, 2011, p. 190-206.
-
Bai R. B., Cao M. S., Su Z. Q., Ostachowicz W., Xu H. Fractal dimension analysis of higher-order mode shapes for damage identification of beam structures. Mathematical Problems in Engineering, Vol. 2012, 2012, p. 454568.
-
Bai R. B., Song X. G., Radzieński M., Cao M. S., Ostachowicz W., Wang S. S. Crack location in beams by data fusion of fractal dimension features of laser-measured operating deflection shapes. Smart Structures and Systems, Vol. 13, Issue 6, 2014, p. 975-991.
-
Shen L., Bai L. A review of Gabor wavelets for face recognition. Pattern Analysis and Applications, Vol. 9, 2006, p. 273-292.
-
Bai R. B., Ostachowicz W., Cao M. S., Su Z. Crack detection in beams in noisy conditions using scale fractal dimension analysis of mode shapes. Smart Materials and Structures, Vol. 23, 2014, p. 065014.
-
Wu D., Law S. S. Damage localization in plate structures from uniform load surface curvature. Journal of Sound and Vibration, Vol. 276, 2004, p. 227-244.
About this article

The authors gratefully acknowledge the Natural Science Foundations of China (No. 51508156), the China Postdoctoral Science Foundation (Grant No. 2014M560386), and the Natural Science Foundation of Shandong Province of China (Grant No. ZR2014EL034).
