Abstract
Dynamic effects caused by sudden failure of the vertical load-bearing component are an important factor affecting the progressive collapse of building. In order to study the influence of dynamic effects on structure, a collapse experiment of a 1/3-scale, 2×3-bay and 2-story reinforced concrete frame with specially shaped columns with sudden column removal were carried out. The displacement response, reinforcement and concrete strains during the collapse of the frame were studied to reveal the dynamic response of structure such as deformation and internal force redistribution. Experimental results show that the influence of dynamic effects on structure at the moment of component failure was not significant. The structure was still in the elastic stage and collapse did not occur, indicating that reinforced concrete frame designed according to Chinese codes has a good behavior against progressive collapse caused by sudden loss of a first floor column. A progressive collapse dynamic analysis model was established using the alternate path method based on the test frame, and the relationship between the dynamic amplification factors and failure time were derived. Transient time history analysis was carried out on the finite element model of experimental frame using OpenSees to obtain the variation of dynamic amplification factor with the failure time.
1. Introduction
Progressive collapse is defined as the spread of an initial local failure from element to element eventually resulting in collapse of an entire structure or a disproportionately large part of it [1]. This kind of local failure often occurred under accidental loading with the characteristics of instantaneous damage. And progressive collapse is a complex mechanical process of structural systems, including failure and fracture of structural members, change of load transfer path in the systems and impact and contact of separated and falling structural members [2]. Because load redistribution effects will occur dynamically during an abnormal loading event or local collapse, the response of structure after the sudden destruction of local components presents dynamic characteristics and dynamic effects are important considerations properly representing structural behavior in a progressive collapse analysis [3, 4].
Linear static (LS), nonlinear static (NS), linear dynamic (LD) and nonlinear dynamic (ND) methods are four basic approaches for progressive collapse analysis. A most attractive merit of the LS procedure over other approaches is its simplicity in structural modeling and economy in execution. And most of the traditionally trained structural engineers do not routinely perform dynamic analysis [5, 6]. When using static analysis methods for structural design and analysis, the General Services Administration (GSA) [7] and Department of Defense (DoD) [8] guidelines apply a constant factor of 2.0, called the dynamic amplification factor (DAF), directly to the progressive collapse load combination within the affected areas of local damage to conservatively account for dynamic effects expected in an actual collapse event. Essentially, the progressive collapse process is a complex dynamic problems, the size of the dynamic effects is closely related to the failure time of components. Several studied have revealed that a constant DAF equal to 2.0 may lead to inconsistent results with that obtained from ND analysis approach [9-11].
Reinforced concrete (RC) frame with specially shaped columns offer advantages such as avoiding prominent corners in a room, increasing usable floor area, and reducing dead load of structure combined with the use of light in filled walls. However, specially shaped columns are weak at bearing capacity and seismic performance owing to the relatively smaller cross-section area. The column root is the key part controlling the failure of the total structure under seismic loading according to previous test results of frames [12, 13]. And studies on progressive collapse of structures are mainly concentrated in frames with rectangular columns and rarely involve frames with specially shaped columns. The dynamic responses of structure were studied through the test of RC frame with specially shaped columns subjected to a sudden loss of the middle column in the short side of frame. The relationships between the DAF and failure time were derived base on the experimental model. Transient time history analysis was conducted on the finite element model of the experimental frame using OpenSees and the variation of DAF with failure time was obtained.
2. Experimental investigation
2.1. Design of testing model frame
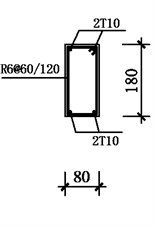
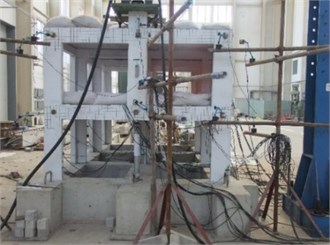
In order to study the dynamic responses of RC frame with specially shaped columns at the moment of the vertical load-bearing components failure, a 1/3-scale, 2×3-bay, 2-story RC frame with specially shaped columns was designed and manufactured as a reduced order model of a prototype four-story RC frame with specially shaped columns in accordance with requirements of design code of China [14, 15]. The geometrical dimensions of the model frame and reinforcements of beams and columns are exhibited in Fig. 1 and Fig. 2, respectively (all dimensions are in mm). The story height was 1000 mm, and the thickness of slab was 50 mm. T8 steel bars were orthogonally arranged inside the slab with the interval of 150 mm. During the concrete casting process of the model frame, B1 column at the first story designed as the failed column was substituted by a steel tube with welded spherical joint to support the superstructure. Picture of completed model frame is shown in Fig. 3.
The strength grade of longitudinal bars and stirrups used in beams and columns were 400 MPa and 300 MPa, respectively. C40 concrete was used for the model frame. The measured values of mechanical properties of reinforcing bars and concrete are shown in Table 1.
Fig. 1Dimension of model frame
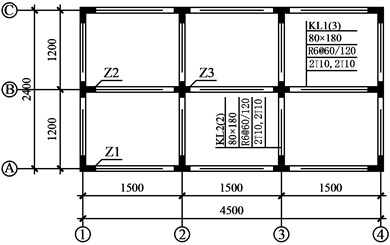
Table 1Material properties of steel bars and concrete
Reinforcement | Concrete | ||||
Bar type | Yield strength (MPa) | Ultimate tensile strength (MPa) | Elastic modulus (MPa) | Ratio of elongation (%) | Cubic compressive strength (MPa) |
300D6 | 417.0 | 541.4 | 2.12×10⁵ | 30.5 | 42.3 |
400D8 | 454.1 | 640.3 | 2.65×10⁵ | 28.5 | |
400D10 | 433.6 | 627.8 | 2.25×10⁵ | 29.1 | |
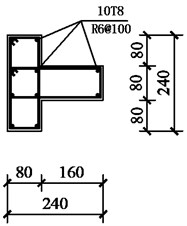
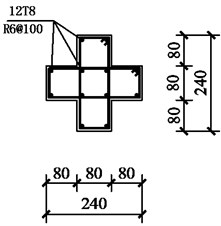
Fig. 2Section dimension and reinforcement details of beam and columns. (Note: R and T stands for steel bars with nominal yield strengths of 300 MPa and 400 MPa, respectively; the number following R or T represents the nominal diameter of a bar. @ stands for stirrup space)
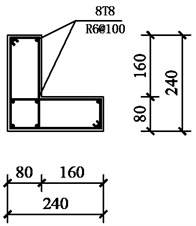
a) Z1 column
b) Z2 column
c) Z3 column
d) Beam
2.2. Loading equipment and protocol
The dynamic response and internal force redistribution of the model frame under gravity load was studied through suddenly removing the middle column in the short side of the ground floor. As shown in Fig. 3, the load in the experiment was applied by stacking sandbags uniformly on the slab. The load applied on the model frame was 2.8 kN/m2.
Fig. 3View of experimental model frame
2.3. Test set up and instrumentation
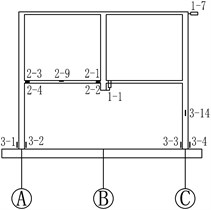
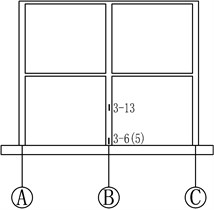
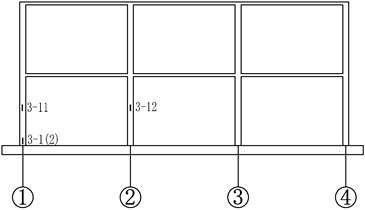
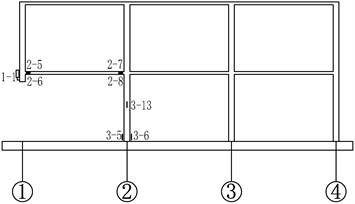
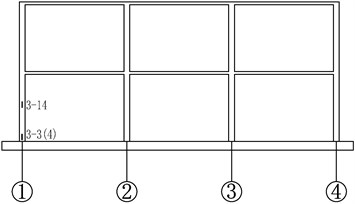
A high-frequency data acquisition system with a sampling rate of 1 MHz was applied in the experimental program. The vertical displacement of the joint on the top of failed column was measured by a laser displacement transducer. During the test, the variations of bar and concrete strains at critical sections were recorded to shed light on the internal force redistribution within the frame. Prior to the casting of the specimen, 9 strain gauges were attached onto steel bars at the ends and mid-span of beams connected to the failed column. Concrete strain gauges were attached to the surface of concrete on two sides of the column feet along the bending direction, with a distance of 20 mm to the column foot, to obtain the strain data of concrete at the bottom of ground floor columns. Four strain gauges were attached onto the column surfaces to measure the column axial forces. The detailed positions of the displacement transducer and strain gauges are shown in Fig. 4. It should be mentioned that all the readings of displacement transducer and strain gauges were initialized to zero before the B1 column was suddenly removed.
3. Experimental results and analysis
The sudden failure of Column B1 was simulated by suddenly removing the steel tube. Data of each measurement points were collected using dynamic data acquisition system and the dynamic responses of the structure at the moment of column removal was researched.
Fig. 4Details of testing setup and instrumentation. (Note: No. A-B in the graph, A represents the type of sensor, A = 1, 2 and 3 stand for the displacement transducers, steel strain gauge and concrete strain gauge, respectively; B represents the serial number)
a) Axis 1
b) Axis 2
c) Axis A
d) Axis B
e) Axis C
3.1. Dynamic displacement of structure
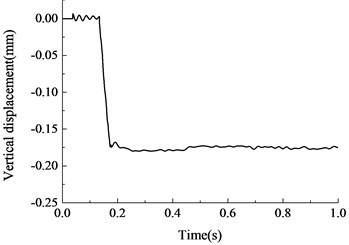
Fig. 5 shows the time history curves of vertical displacement of the joint on the top of the removed column measured by laser displacement transducer, in which the decrease of vertical displacement indicates that the measurement point is moving downward, whereas the increase means that it is moving upwards. It can be seen from the figure that there was a vertical vibrating process in the structure with the sudden loss of column B1. The superstructure moved downward due to gravity load firstly, began to decline after reaching a peak and became stable after a series of damped vibration. The vertical displacement of the beam-column joint on the top of the removed column after the stabilization of damped vibration was approximately 0.176 mm and the structure would not collapse. At the same time, there was no obvious crack was found at the frame beam connected to the failed column, indicating that the structure were still in the elastic deformation stage and the structure had sufficient capacity to prevent collapse under the applied load.
Fig. 5Vertical displacement-time histories of failed column
3.2. Dynamic strain
Before the collapse of structure, most part of the concrete had already cracked or crushed and the steel bars in the components played a key role to resist the progressive collapse of structure. Fig. 6 shows the time history curves of the steel strain at the end of the frame beam at the ground floor when the middle column B1 was suddenly removed. As exhibited in figure, there was a rapid variation of the steel strain at the end of the frame beam connected to the failed column. The bottom rebar at the beam-end close to the failed column was subjected to tension when the top rebar was subjected to compression, while the bottom rebar at the beam-end far away from the failed column was under compression and the top rebar was under tension. The strain of steel bars reached the maximum at about 0.05 s after the start of the experiment and became stable after damped vibration at about 0.8 s, after which moment the strain of rebar did not vary. The stabilized maximum strain was 50×10-6, which was far less than the yield strain of steel bars and the structure were still in elastic stage with sufficient safety reserves.
Fig. 6Strain-time histories of steel bars
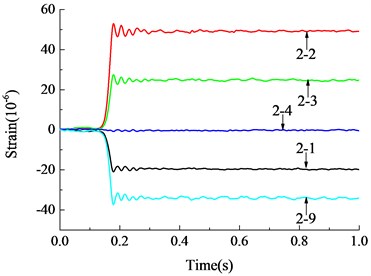
a) Beam A1-B1 at the ground floor
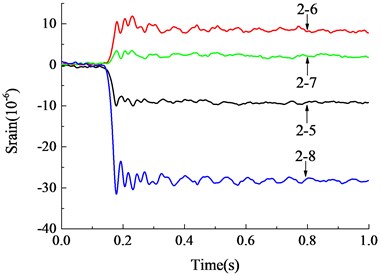
b) Beam B1-B2 at the ground floor
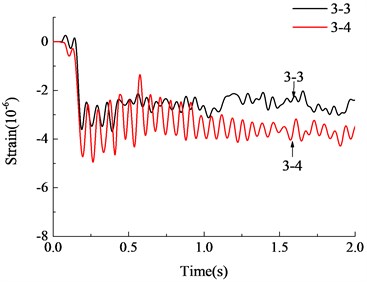
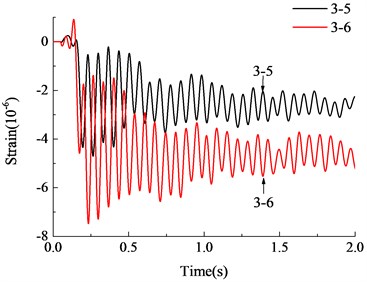
Fig. 7Strain-time histories of concrete
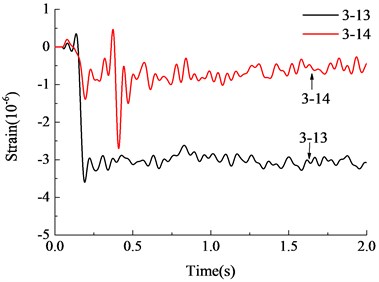
a) Strain at the middle of column B2, C1
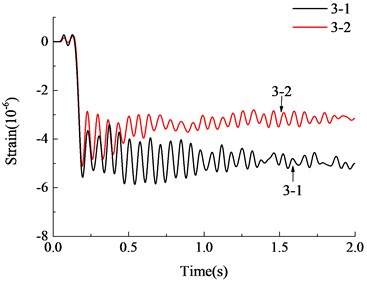
b) Strain at the bottom of column A1
c) Strain at the bottom of column C1
d) Strain at the bottom of column B2
After the failure of middle column B1 at the ground floor, the sustained load was transferred to the surrounding adjacent columns via frame beams and cast-in-place slabs. Fig. 7(a) shows the time history curves of concrete strain at the middle section of the frame column adjacent to the failed column at the ground floor. It can be seen from Fig. 7(a) that the compressive strain of the adjacent columns increased after the failure of middle column B1, suggesting that the load of superstructure originally sustained by the removed column was transferred to the adjacent columns via frame beams and cast-in-place slabs and the transferred additional load led to the increase of the axial stress and strain of the adjacent columns. The variation of concrete strain at the bottom of the adjacent columns is shown in Fig. 7(b)-Fig. 7(d). After the loss of middle column at the ground floor, the frame moved downward due to gravity load and the compressive strain of the adjacent columns increased. At the meantime, due to the additional moment inside the frame beams, additional moment was produced at the frame columns. As a result of the action of additional moment in the column, concrete at the bottom of the columns was subjected to compression at one side and tension at another. Under the coaction of the axial force and bending moment, the concrete strain at both sides of the bottom of the columns was slightly different. The final compressive strain was about 4-5 με and the concrete remained in elastic stage with no cracking. Therefore, it is seen from the experimental results that the influence of the dynamic response of the structure on structure is not significant. The structure was still in the elastic stage, and collapse did not occur.
4. Finite element model verification
4.1. Finite element model
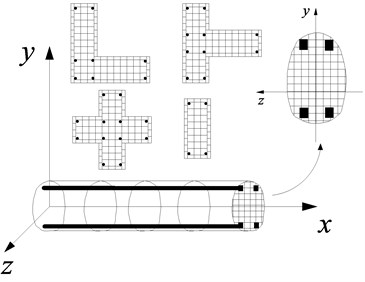
The OpenSees [16] platform was used in the simulations presented in this paper. The finite element model completely replicated the test model, in which the material properties and dimensions of the model were identical to the test model. The frame beam and column components were simulated using the Force-Based Beam-Column Element, which was based on the iterative force-based formulation. A variety of numerical integration options can be used in the element state determination and encompass both distributed plasticity and plastic hinge integration. The resistance and tangent stiffness matrix of the whole element are integrated along the element length in accordance with Gauss-Lobatto integration on the basis of determining the resistance and stiffness matrix on the control section. The control section of the element was modeled by fiber element and the material properties of concrete and steel bars were respectively assigned to fibers, as shown in Fig. 8. One force-based fiber element was used for one beam or column in the discretization of beams and columns, and five integration points per element were used. There are a total of 58 beam-column elements and 36 nodes. The finite element model was set up by beam elements with T-shaped or L-shaped sections, in which slabs was the flange of the frame beam, to consider the enhancement of slabs on beams.
Fig. 8Fiber section: Fiber divided of control section
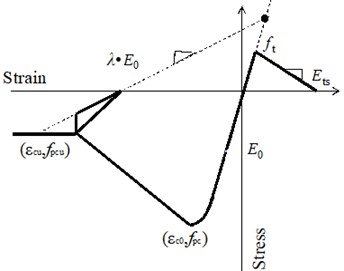
As shown in Fig. 9, the steel reinforcing bars were modeled using the “Hysteretic Material” which allows the definition of trilinear behavior. The first branch was used to define the elastic response of the material, the second accounts for the hardening stage, while the final branch was specified with a negative slope up to bar rupture. The material used to define the concrete is the “Concrete02 Material”, as shown in Fig. 10, which utilizes the well-known Kent and Park [17] model in compression and linear elastic behavior in tension up to tension cracking followed by linear softening. There were two kinds of concrete: the core concrete (Confined Concrete) confined by stirrup and the cover concrete (Unconfined Concrete). The constitutive equations and related parameters of the confined concrete under compression are defined as follows:
In which is the concrete strength enhancement coefficient due to stirrup constraints:
is the strain softening slope:
where is the compressive strain corresponding to the peak stress of concrete; is the compressive strength of concrete cylinder; is the yield strength of stirrup; is the volume-stirrup ratio of beams or columns; is the width of core concrete; is the stirrup spacing and is the ultimate compressive strain of concrete. The ultimate compressive strain of concrete is determined by the following formula suggested by Scoot:
Fig. 9Stress-strain relationship of steel
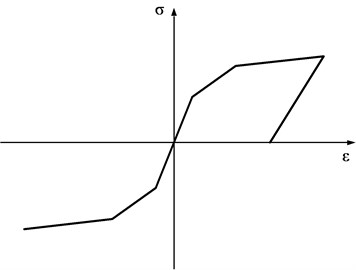
Fig. 10Stress-strain relationship of concrete
The instantaneous loading method was applied to investigate the dynamic response of structure when the middle column was removed. Nonlinear dynamic analysis involves the following steps: 1) performing nonlinear static analysis of the structure under gravity load to obtain the internal forces in the column to be removed; 2) removing the damaged column and applying the internal forces (, , and ) obtained in the previous step to the remaining structure, along with the gravity load. Note that the results of such analysis are identical to those of the previous analysis, where the column was not removed; 3) simulating the failure of column B1 through the mutual offset of load by applying forces changed over time, which was equal and opposite to , on the joint on the top of removed column. In the structural dynamic analysis, it is necessary to determine the damping. In this paper, Rayleigh damping was used, following:
where [] is structural damp matrix, [] is the structural mass matrix, [] is the structural stiffness matrix, is mass damping coefficient, is stiffness damping coefficient. The two coefficients can be obtained from Eqs. (6) and (7), respectively:
where and are th and th natural frequency of structure. and are the damping ratio of th and th vibration modes. In this paper, the damping ratio of the reinforced concrete was set to be 0.05 and corresponding vibration modes were selected as the first and second mode of the structure. Mode analysis for the frame was performed to determine the vibration characteristics of the structure. The calculation results of the first four vibration modes of natural frequency are summarized in Table 2.
Table 2The first four vibration modes of natural frequency (unit: rad/s)
Mode | 1 | 2 | 3 | 4 |
Natural frequency | 149.60 | 155.06 | 169.05 | 319.94 |
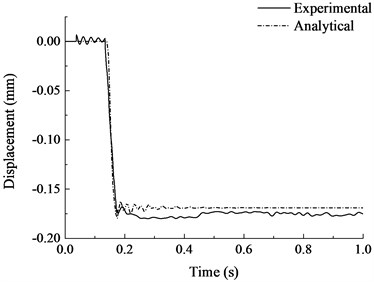
Fig. 11Vertical displacement-time history curves of failed column
4.2. Comparison of test and analytical results
The analytical results are compared with the experimental results in Fig. 11 and Fig. 12. As can be seen from the figure, the calculated results are in good agreement with the experimental results as a whole. The calculated vertical displacement at the top of failed column after vibration was 0.169 mm, which was close to the experimental results. It can be seen from the strain time history curves of steel bars that the finite element model was more ideal and with a larger stiffness. Strain vibration amplitude was slightly larger than the experimental results, the vibration damping rate was faster, but the overall trend and vibration amplitude were quite close. The structure leveled off after several vibrations and the stabilized strain were close to the experimental results. Generally speaking, the finite element analysis model established in this paper is accurate enough to simulate the dynamic response of RC frame structure with specially shaped columns at the moment of sudden column failure, which can laid a foundation for the subsequent progressive collapse anslysis of RC frame structure with specially shaped columns.
Fig. 12Strain-time history curves of steel bars
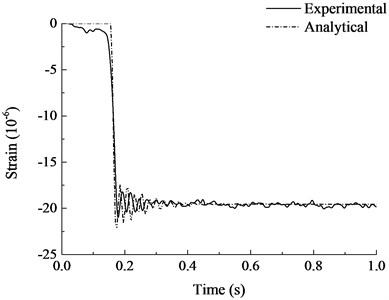
a) Measurement point 2-1
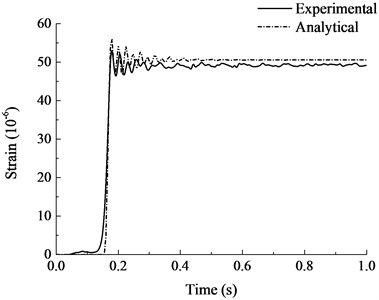
b) Measurement point 2-2
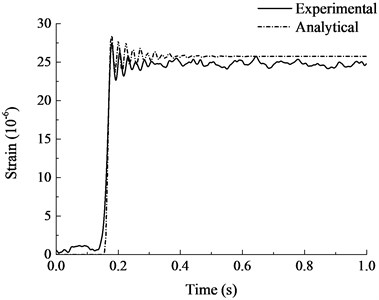
c) Measurement point 2-3
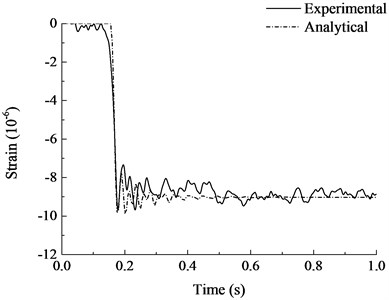
d) Measurement point 2-5
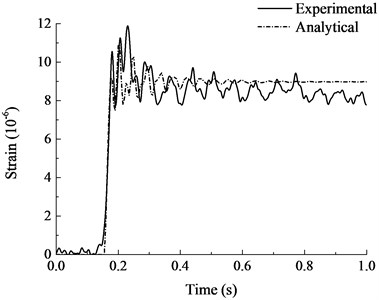
e) Measurement point 2-6
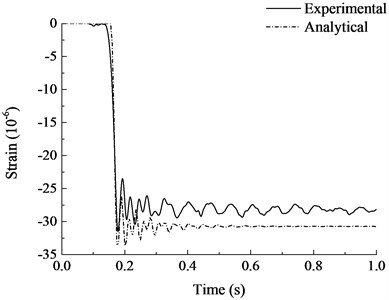
f) Measurement point 2-8
5. Dynamic effects analysis
The study of the dynamic effects of the structural system when a component removed suddenly is an important research aspect of structural progressive collapse. It is of important research significance to evaluate how much impact and damage will such dynamic effects lead to and whether or not such dynamic effects will exaggerate disproportional collapse of the building. In this paper, the theoretical derivation and finite element analysis methods were used to perform such study.
5.1. Theoretical derivation of dynamic effects
As shown in Fig. 13, one plane frame of the experimental frame where the removed column located in was selected to conduct the analysis. Dynamic knowledge was used to derive the relationship of the dynamic displacement at the failure point and dynamic amplification factor (DAF) after the complete loss of the middle column at the ground floor with the failure time of component. The mass which was evenly distributed in each level could be simplified into a mass point and the analytical model could be simplified into a single-degree-of-freedom (SDOF) vertical vibration system with two mass points. Only the B1 column at the ground floor was removed during the experiment. The two mass points were connected by frame column and the deformation of frame column was very small compared with the vibration amplitude of the failure point, and it can be therefore considered that identical vertical vibration was produced at the two mass points at the moment the vertical member was removed in a sudden. Therefore, the analytical model can be directly simplified into a SDOF vertical vibration system with one mass point, as shown in Fig. 14. The load (excluding self-weight of the structure) and mass distributed on the beam were concentrated in the center of the beam with magnitudes of () and , with only vertical displacement was considered. The dashed line in the figure denotes the position of static balance after the loss of middle column, is the initial vertical static displacement and denotes the combined force sustained by mass point . Set the failure time of the middle column to be , the load condition of mass point during the entire process of failure is demonstrated by Fig. 15, in which denotes the vertical supporting force applied to the upper structure during the process of column failure. Therefore, .
Fig. 13Sketch of RC plane frame
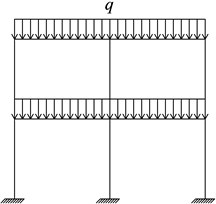
Fig. 14Simplified analysis model
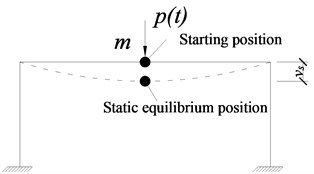
Fig. 15Stress analysis for mass point m
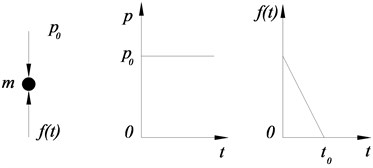
Fig. 16Equivalent load at mass point m
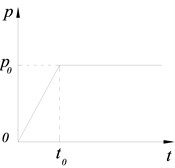
According to the principle of dynamic superposition, the load sustained by mass point is equivalent to a load form of maintaining a constant load after a linear increase (as shown in Fig. 16), in which 0- is the process of column failure [18]. The expressions are:
For the equivalent SDOF system starting from static (as shown in Fig. 14), the differential equations of motion can be established as Eq. (9):
where is the vertical displacement, is the damping ratio and is the circular frequency.
Displacement response of the structure under the load demonstrated in Fig. 16 can be calculated by Duhamel integral [18] as:
where is the circular frequency of damped free vibration.
When subjected to accidental load (such as blast, vehicle impacts etc.), the failure time of member is very short. As a result, the structure reaches the maximum response in a very short time. At this moment, energy dissipation due to damping is not obvious and the effect of damping can be ignored when calculating the maximum response. Therefore, the displacement response of the structure is:
Thus:
Make , the maximum dynamic displacement can be calculated as:
Make to be the maximum static displacement (the displacement generated by the structure when make the maximum load to be a static load), the dynamic amplification factor is:
In which ; is the structural stiffness; is the natural vibration period of the remaining structure. For a specific structure, the circular frequency , mass and stiffness are fixed. Under the load demonstrated in Fig. 16, the DAF is related to the time of column failure . In the stage of (process of column failure), is reversely proportional to ; in stage (after loss of column), the relationship between and is shown in Fig. 17.
Fig. 17Dynamic amplification factor
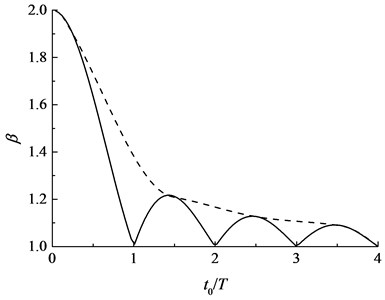
For progressive collapse problems, the loss of components occurs almost in a moment. At the moment of component failure, i.e. , the internal forces are redistributed in the structure and collapse will not yet occur. Therefore, dynamic effects of the structure after the complete loss of vertical components, i.e. stage , is of higher concerned. As shown in Fig. 17, after the local failure of components, the DAF lies between 1.0 and 2.0. If the failure time of component is short, i.e. , the DAF is close to 2.0, which is similar to the condition of a sudden load; if the failure time of component is long, i.e. , the DAF is close to 1.0, which is similar to the condition of a static load. In practical design, the outer envelope curve of the curve of in Fig. 17 can be used as the design basis for the value of DAF.
5.2. Finite element analysis of dynamic effects
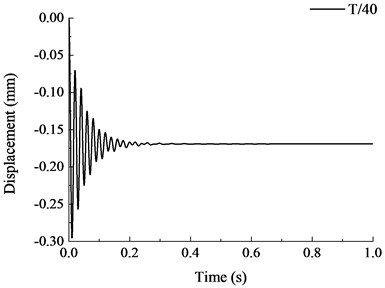
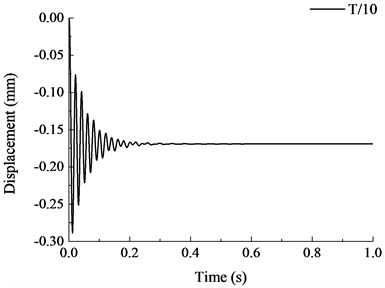
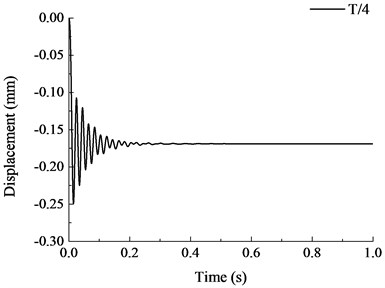
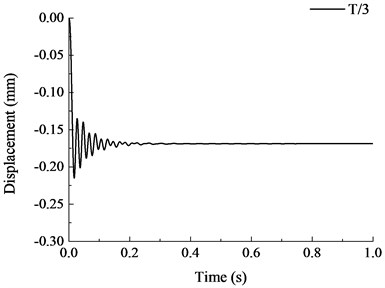
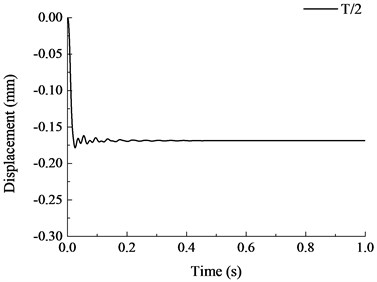
Transient time history analysis under different failure time were conducted based on the finite element model of the test frame previously established by OpenSees, and the vertical displacement time history curves of the failure point under different failure time were obtained. Define DAF as the ratio of maximum dynamic displacement and vertical displacement calculated by nonlinear static analysis, the effect of different failure time of members on the DAF at the failure point were studied. Choose 1/80, 1/40, 1/20, 1/10, 1/4, 1/3, 1/2, , 2, 3 and 4 as the respective failure time of the middle column at the ground floor to investigate the dynamic response of structure at different failure time. The above is the natural vibration period of the remaining structure after removal of column. It is known from the previous model analysis that 0.042 s.
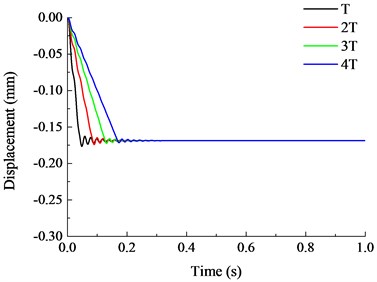
The vertical displacement time history curves under different failure time are shown in Fig. 18. It is shown that when the failure time of member increased, the vibration effect of the structure reduced and the maximum vertical displacement after stabilization also reduced. When the failure time of member was less than the natural vibration period of structure, the maximum vertical displacement increased significantly with the reduction of failure time. When , the vertical displacement curve at the top of the removed column was relatively stable and the maximum displacement of the structure was also stabilized at constant value. During the dynamic analysis of progressive collapse resistance for RC frame with specially shaped columns, when the specific failure time of component is uncertain, the failure time of member should be less than 1/10 of the natural vibration period of the remaining structure, where the dynamic response of the structure at this moment is the maximum. When the failure time is larger than the natural vibration period of the structure, the maximum vertical displacement becomes stable with the variation of failure time.
Fig. 18Vertical displacement time history curves under different failure time

a)
b)

c)
d)
e)
f)
g)
h), , and
Therefore, for a specific frame, a shorter failure time of member leads to more severe damage and a longer failure time may not lead to secondary damage to the frame structure. Thus, proper protection to the key load-carrying members of the structure to delay the failure time of those members can reduce the dynamic effects and damage degree of the remaining structure and therefore reduce the risks of progressive collapse of structure subjected to local damage.
Assume that the middle column B1 was completely removed, the vertical displacement of the structure at the top of the failed column calculated by nonlinear static analysis was –0.1785 mm. According to the maximum dynamic displacement acquired previously and Eq. (14), the DAF with respect to different failure time of member can be calculated, as shown in Table 3. It is seen from analysis results that the shorter the failure time of member, the closer the DAF is to 2; the longer the failure time of member, the closer the DAF is to 1 and the dynamic effects become stable and closes to 0. The above findings match the theoretical analytical results well.
Table 3Different DAF corresponding to different failure time
Failure time | 80 | 40 | 20 | 10 | 4 | 3 | 2 | 2 | 3 | 4 | |
DAF | 1.709 | 1.709 | 1.708 | 1.672 | 1.453 | 1.259 | 1.055 | 1.044 | 1.030 | 1.021 | 1.016 |
6. Conclusions
The dynamic response of the structure at the moment of column failure was studied through the test of RC frame with specially shaped columns. The influence of the failure time of the local component on the dynamic effects of structure was studied by numerical derivation and finite element analysis, with the following conclusions obtained:
1) The dynamic collapse test, when a middle column at the ground floor was removed, shows that the influence of dynamic effects on structure at the moment of component failure was not significant. The structure was still in the elastic stage and collapse did not occur, suggesting that RC frame with specially shaped columns designed according to Chinese codes had a good behavior against progressive collapse caused by sudden loss of a first floor column.
2) The finite element analytical model established by OpenSees is capable of simulating the dynamic response of frame structure with specially shaped columns at the moment of column failure. The model can be used to conduct the subsequent progressive collapse analysis on the frame structure with specially shaped columns.
3) The dynamic response at the moment of column failure is related to the failure time of vertical member. The shorter the failure time of member, the stronger the dynamic response of the structure; when the failure time of member is less than the vertical natural vibration period, the effect of failure time on the dynamic effects of structure is the most significant. When conducting dynamic analysis for progressive collapse of frame structure with specially shaped columns, it is recommended that the failure time of member should be less than 1/10 of the natural vibration period of the remaining structure.
4) The damage degree of the remaining structure is more severe when the failure time of component is shorter. A longer failure time reduces the damage degree of the remaining structure. Therefore, proper protection to the key load-carrying members of the structure to delay the failure time reduces the dynamic effects of the structure due to local damage and therefore reduces the risks of progressive collapse of structure subjected to local damage.
References
-
Minimum Design Loads for Buildings and Other Structures. American Society of Civil Engineers, Reston, Virginia, 2013, p. 636.
-
Starossek U. Typology of progressive collapse. Engineering Structures, Vol. 29, Issue 9, 2007, p. 2302-2307.
-
Smilowitz R. Analytical tools for progressive collapse analysis. Proceedings of National Workshop on Prevention of Progressive Collapse, 2002, p. 10-11.
-
Kaewkulchai G., Williamson E. B. Beam element formulation and solution procedure for dynamic progressive collapse analysis. Computers and Structures, Vol. 82, Issue 7, 2004, p. 639-651.
-
Burns J., Abruzzo J., Tamaro M., et al. Structural systems for progressive collapse prevention. Multihazard Mitigation Council National Workshop on Prevention of Progressive Collapse, Chicago, IL, 2002.
-
Marchand K. A., Alfawakhiri F. Facts for Steel Buildings: Blast and Progressive Collapse. American Institute of Steel Construction, 2004.
-
Progressive Collapse Analysis and Design Guidelines for New Federal Office Buildings and Major Modernization Projects. US General Service Administration, Washington, DC, 2003.
-
Unified Facilities Criteria: Design of Buildings to Resist Progressive Collapse. US Department of Defense, Washington, DC, 2005.
-
Tsai M. H., Lin B. H. Investigation of progressive collapse resistance and inelastic response for an earthquake-resistant RC building subjected to column failure. Engineering Structures, Vol. 30, Issue 12, 2008, p. 3619-3628.
-
Kim J., Kim T. Assessment of progressive collapse-resisting capacity of steel moment frames. Journal of Constructional Steel Research, Vol. 65, Issue 1, 2009, p. 169-179.
-
Kim H. S., Kim J., An D. W. Development of integrated system for progressive collapse analysis of building structures considering dynamic effects. Advances in Engineering Software, Vol. 40, Issue 1, 2009, p. 1-8.
-
Wang T., Liu X., Zhao H. Experimental research on seismic behavior of +-shaped columns reinforced with high-strength steel bars under cyclic loading. KSCE Journal of Civil Engineering, Vol. 19, Issue 4, 2015, p. 982-993.
-
Wang T., Zhang X. Frame property of unequal storey height with specially shaped columns under cyclic loading. Journal of Central South University of Technology, Vol. 17, Issue 6, 2010, p. 1364-1369, (in Chinese).
-
GB 50010-2010. Code for Design of Concrete Structures. China Architecture and Building Press, Beijing, China, 2010, (in Chinese).
-
JGJ 149-2006. Technical Specification for Concrete Structures with Specially Shaped Columns. China Architecture and Building Press, Beijing, China, 2006, (in Chinese).
-
McKenna F., Fenves G. L., Scott M. H. Open System for Earthquake Engineering Simulation. University of California, Berkeley, CA, 2000.
-
Scott B. D., Park R., Priestley M. Stress-strain behavior of concrete confined by overlapping hoops at low and high strain rates. ACI Journal Proceedings, Vol. 79, Issue 1, 1982.
-
Clough R. W., Penzien J. Dynamics of Structures. 3rd Edition. Computers and Structures, Inc., Berkeley, 2003.
About this article
The work presented in this paper was funded by the National Natural Science Foundation of China (No. 51178304) and the Specialized Research Fund for the Doctoral Program of Higher Education of China (No. 20120032120055), which are gratefully acknowledged.
