Abstract
This paper presents a diagnostics technique of beach buggy gearbox technical state based on the measurement of modal vibrations. It is well known that the vibration level of machine elements can be correlated to the technical state of the machine. The frequency analysis of vibration signals can be effectively used for the monitoring of the fault origination and development in rotating machinery. The proposed technique uses gearbox modal vibration data to identify and monitor developing faults in the buggy vehicle.
1. Introduction
The development of complex machinery is often faced with multivariate optimization problems when the solution of one problem generates the origination or worsening of another problem. According to C. Cempel, every technical device in the given moment is in certain definite state. The most generally technical state of object, machine, vehicle can be describe as a set of the all parameters values that defining the given object in given moment of time . The analysis and extrapolation of these time sequences can provide valuable information about the condition of the machine [1]. The development appropriate technical diagnostics methods makes possible to qualify the current technical state of studied object, machine and vehicle.
The necessity of the technical state estimation is conditioned the possibility of making decisions connected with object exploitation and according safety procedures. The present development of automation, intelligent sensors and computer technology creates new possibilities for the realization of diagnostic systems and monitoring algorithms [2-7].
2. The response signal in modal coordinates
The goal the proposed fault identification technique is to correlate emitted vibration signals with the machine exploitation parameters. Moreover, the most valuable information about current machine technical state could be obtain during machine natural loads without disturbing this process of operation. Two different diagnostic models could be developed: models based on the functional or on the structural characteristics of the system.
In general, structural models are more valuable, because they enable to show relations between current elements of the construction and model specific properties of the machine. The diagnostics procedure for structural model requires the identification of the model parameters and monitoring of the changes of these parameters during the exploitation of the machine. This relationship between individual parameters and construction elements are the basis for estimation of current dynamic state of the investigated machine. Periodical monitoring of this relationship can be used to detect, locate and evaluate the stage of damages to given mechanical unit.
Modal analysis models utilization (experimental or operational modal analysis) is often employed to build the structural model of machine engines. Operational modal analysis (modal analysis based on operational data) is used when the structure is not exited artificially – natural operating loads are allowed to excite the structure. The proposed technique is also based on operational modal analysis – data for real object working process in chosen measure points is recorded in relation to the chosen reference points [3].
Preparation process for the diagnostics investigations in these methods comprises the measurement at the reference points in defined frequency ranges. The advantage of this method in the identification of objects dynamic profiles at the state of natural conditions and loads that are characteristic for these objects in the process of exploitation.
Modal poles and natural frequencies are identified during these measurements what allows to estimate the mode shapes of the structure. However, the values of the exciting forces are kept unknown. Moreover, a single machine is not isolated in real world applications – usually lots of different machines and machine components interact in a noisy environment. The best solution would be to isolate the machine under investigation – unfortunately such action is unacceptable. Disturbances caused by other machine components could cause the formation of additional poles on the stabilization diagram.
Modal model parameters can be estimated in time and frequency domain. The time domain estimation is based on information from vibration response in the time domain of the measured signal. Alternatively, the estimation of modal model parameters in frequency domain is based on the input and output signal spectrum [3, 4, 5]. The modal model estimation in frequency domain is often a natural choice because there exists a possibility to limit the frequency range in which the changes of vibroacoustics signal could be recognized during the machine exploitation. The most valuable advantages of this method are:
• data averaging can be easily used for the reduction of noise from signal,
• high precision of the measurement results in case when external vibration sources lay outside the investigative range of vibrations,
• high precision of the measured results in case when the high value of damping exist.
The frequency domain disadvantages are:
• the possibility of the existence of local minimums for signals with high noise level,
• the possibilities of troublesome mistakes connected with spectrum leak, existence of incorrect frequencies component in the signal.
The time domain modal model parameters estimation has similar advantages and disadvantages to the frequency domain method. However, the time domain method is better in case, when we have to estimate [6, 7, 8]:
• data contaminated with high level of noise,
• the wide range of frequency.
In this paper the proposed method is based on the calculation of own correlation function of response signals and mutual correlation of response and reference signals. The dynamic equation of the system motion can be expressed by formula [9, 10]:
where: – mass, damping and stiffness matrices; – acceleration, velocity and displacement vectors; – vector of exciting forces.
The next step is the transformation of formula (1) into the principal coordinates [9, 10]:
where: – matrix of modal vectors, the columns of which are eigenvectors corresponding to the given free vibration frequency; – principal (modal) coordinate, is the number of vibration forms included in the model of vibration forms.
Assuming that the damping is small and proportional, substitution of (2) into (1) and multiplying by , de-coupled equation set is obtained in the form [9, 10]:
where: – is the -th free vibration frequency; – is the modal damping coefficient for the – the vibration form, and is the modal mass.
Assuming zero initial conditions for arbitrary excitation, the solution of equation (3) can be expressed in the form of the convolution [9, 10]:
where:
– is the frequency of damped-free vibrations.
Making use of (4), the modal coordinates in generalized coordinates read [9, 10]:
where: is the number of vibration forms taken into account in the solution.
Cross correlation function for two response signals at points and , resulting from the excitation applied at the point in the form of the white noise reads [9, 10]:
where: denotes the expected value operator.
If we know the relation between the cross correlation function, having the form of a sum of exponentially decaying harmonic functions and impulse transition function for direct application to do the modal analysis tests, the correlation function can be transformed into the following form:
where: is the new phase angle and are free constants.
3. The model of diagnostics signal generation
The object of investigation is a buggy vehicle which was constructed at the Bydgoszcz University of Technology and Life Sciences investigative laboratory. During the construction phase the LMS Virtual.Lab platform was used for the construction optimization [11, 12]. Figure 1 presents the buggy vehicle virtual model during the tension and strain analysis. The final prototype of buggy vehicle was built in spring 2012 and it is illustrated in Figure 2.
Fig. 1Model of buggy vehicle designed in LMS Virtual.Lab software during the virtual tests
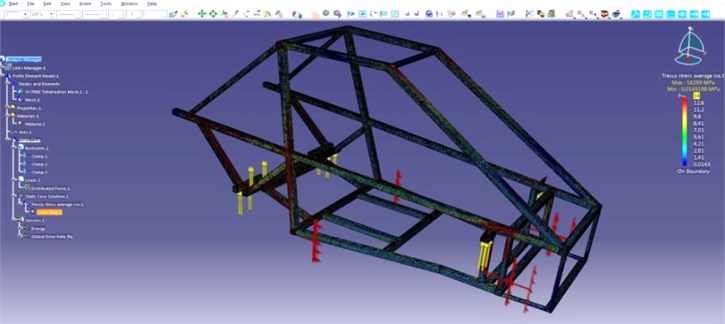
Fig. 2Buggy vehicle during road tests
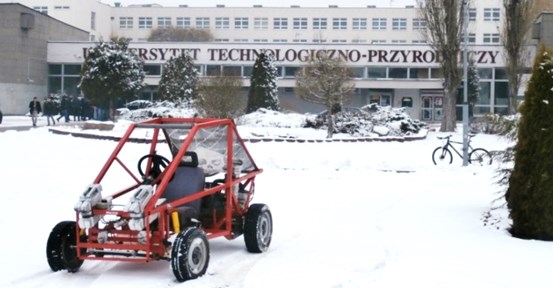
Fig. 3Transmission gearbox diagnostics signal generation model
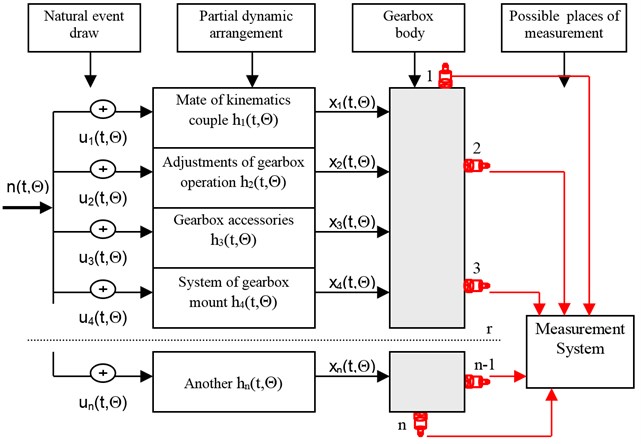
During exploitation of the buggy a few problems appear connected with the vibration level. The transmission gearbox generated a high level of vibration and after few months the transmission mount points were damaged. To resolve these problems the modal analysis methods were used for the vibration analysis. Conducted investigations of gearbox depended on delimitations of vibroacoustics measures for chosen gear sets and accomplishment the assessment of received results influence on transmission gearbox state by operational modal analysis methods. The proposed model of transmission gearbox diagnostic signal generation diagnostics model is shown in Figure 3.
The received signals in the any point of gearbox body are the sum of the responses at all elementary events and outputs in individual partial dynamic arrangements with the pulse function of input . These influences are summed up in the gearbox body, and are measured at the chosen points by selected vibration transducers [2, 7].
4. Transmission gearbox modal test
The LMS Test.Lab software with Modal Analysis Lite module was used for the estimation of modal model poles and the analysis of mode shapes for multi degree arrangements with Time MDOF method. To detect the developing problem of transmission gearbox authors proposed the following measurement algorithm, shown on Figure 4.
Fig. 4The proposed measurement setup
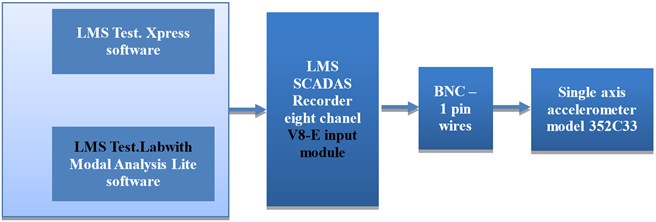
The modal test could be divided into three phases. The first phase of the modal test is the construction of the measurement set-up (system calibration, the attachment of force and response transducers). The second step of the modal test is the measurement of frequency response data – measured in the time domain signal and transformed into the frequency domain functions. The last step of the test is the estimation of the modal parameters based on measured frequency functions. The stabilization diagram with natural frequencies and damping factors, the modal participation factors and estimated mode shapes is reconstructed in the process of the analysis. The dynamic signal LMS Scadas III recorder was used for gearbox signal acquisition. Measurements were realized with gearbox speed 930 1/min on various shifts. Single axis ceramic shear ICP accelerometers model 352C33, 100 mV/g, 0.5 Hz to 10 kHz were used for measurements during experimental investigations. The V8-E is an LMS SCADAS Mobile input module supporting full voltage and ICP signal conditioning and signal processing for eight channels was employed. The V8-E offers the unique combination of ultra-low power consumption, high performance 204.8 kHz 24-bits analog to digital conversion and a spurious free dynamic range of 150 dB [13]. 90 seconds time intervals were recorded with the frequency range 128 Hz. Figure 5 presents transmission gearbox model with the signal acquisition points.
The Time MDOF module with non-linear Least Square Frequency Domain (LSFD) method and Balanced Realization (BR) was used for modal parameters estimation [14]. LSFD is multiple degree of freedom method that applies multiple inputs model and generates global estimates for the stabilization diagram (system poles), modal participation factors and mode shapes. In first step of Time MDOF method we should define the frequency range within the modal test. The geometrical model creation in “Geometry” module enables the visualization of natural frequencies. Figure 6 illustrates the “Geometry” module results produced during experimental investigations.
Fig. 5Transmission gearbox model with the signal acquisition points
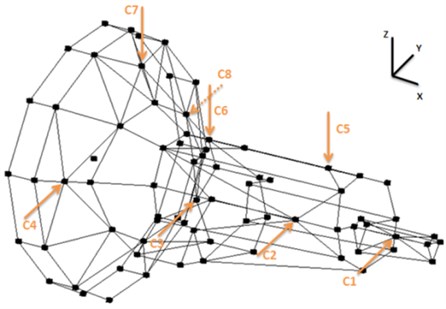
Fig. 6Data selection with “Geometry” module during experimental investigations
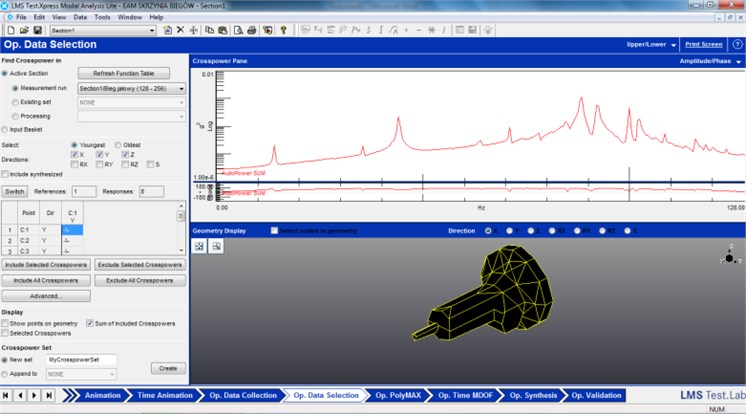
Fig. 7Time MDOF stabilization diagram
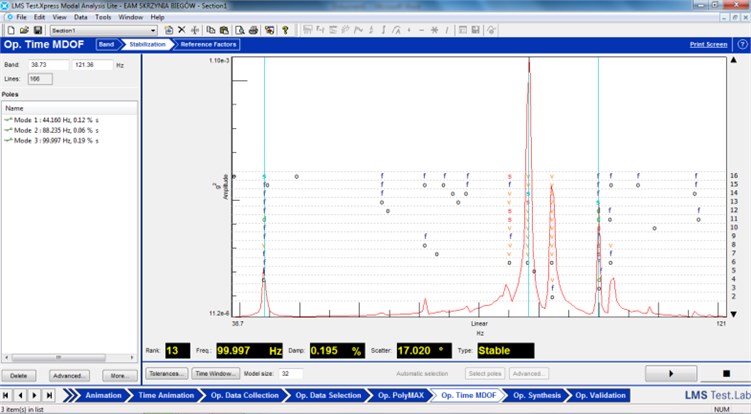
In second step of Time MDOF the Balanced Realization method was used. This is one of the “subspace” techniques which identify natural frequency, damping and mode shapes. A subset of the response functions can be selected as references. These are used in the computation of the cross power functions from the original time domain data. This method is useful for the identification of the most dominant modes occurring under operational conditions [14]. Figure 7 presents sample of Time MDOF stabilization diagram for the investigated transmission gearbox.
Analyzing individual simulated cases on the investigative transmission during investigation produces a set of stabilization diagrams with marked stable poles. The stable poles mark frequency, modal damping and the mode shapes vector. The results of modal tests were introduced in Table 1.
The last step of Time MDOF modal parameters estimation was the mode shapes estimation with LSFD method; sample results for idle run mode shapes are shown in Figure 8. LMS Synthesis module with Auto-MAC criteria estimation was used for the validation. Errors of the estimation for all recognized mode shapes of the abject are shown in Figure 9. As final results we obtain the dynamic state description of real technical object with estimation of predominant properties of natural frequency and mode shapes.
Table 1Results of the transmission gearbox modal tests
Natural frequency [Hz] | Modal damping factor [%] | Modal model order | |
Idle run | 44.160 | 0.12 | 16 |
88.235 | 0.06 | 14 | |
99.997 | 0.19 | 13 | |
First gear | 44.080 | 0.20 | 8 |
70.976 | 0.13 | 14 | |
88.504 | 0.13 | 12 | |
99.986 | 0.03 | 16 | |
Second gear | 44.444 | 0.15 | 12 |
88.890 | 0.22 | 10 | |
Third gear | 43.844 | 0.28 | 7 |
70.433 | 0.25 | 12 | |
124.216 | 0.46 | 9 | |
Fourth gear | 42.627 | 0.17 | 8 |
81.967 | 1.01 | 8 | |
87.734 | 3.04 | 10 |
Fig. 8Transmission gearbox sample mode shapes for frequencies: a) 44.16 Hz, b) 88.23 Hz, c) 99.98 Hz
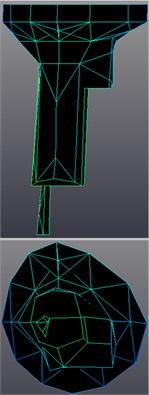
a)
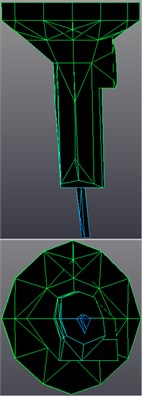
b)
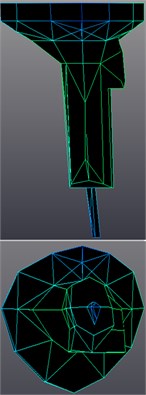
c)
Fig. 9LMS Synthesis module performs Auto-MAC criteria estimation
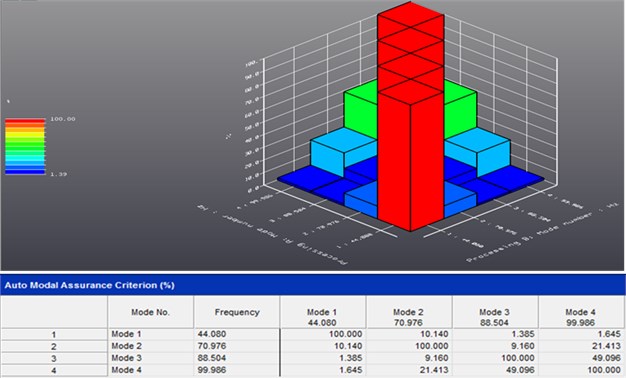
The stabilization process ran with tolerance of individual modal parameters: 1 % for frequency, 5 % for modal damping and 2 % for mode shapes vector.
5. Conclusions
Conducted investigations of gearbox depend on vibroacoustics measures for chosen gear sets and accomplish the assessment of the influence on transmission gearbox state by operational modal analysis methods. As a result we received the stabilization diagrams with natural frequencies with damping factors, the modal participation factors and estimated the mode shapes. Analyzing results of investigations for idle run, the first identified natural frequency (44,160 Hz) describes the movement of shaft unbalances. That is very well visible on the animation of modal model in the geometry model analysis as determined deformations of model. The second figure of natural frequency (88,235 Hz) is caused by the differential mass impact on the gearbox casing and also the unbalances shaft movement – that influences on whole gearbox stiffness. Third figure of natural frequency (99,997 Hz) results from the fastening and the supports of the gearbox.
Presented techniques allow quick identification of problems in the transmission gearbox. It employs gearbox body mode shapes identification and visualization. The advantage of this method is based on the fact that the studied object can be investigated during normal process of exploitation, the investigations don't generate additional costs and the results are produced based on real signals that are generated through the exploitation process of studied object.
This paper is a part of investigative project WND-POIG.01.03.01-00-212/09.
References
-
Cempel C. Fundamentals of vibroacoustic condition monitoring. Handbook of condition monitoring, 1a Ed., Londres, Inglaterra: Chapman and Hall, 1998, p. 325-333.
-
Kałaczyński T., Łukasiewicz M., Żółtowski B. The study of dynamic state industrial machines. 11th International Technical Systems Degradation Conference, Warszawa, 2012.
-
Heylen W., Lammens S., Sas P. Modal Analysis Theory and Testing. Katholieke Universiteit Leuven, Heverlee, 2007.
-
Łukasiewicz M. Investigation of the operational modal analysis applicability in combustion engine diagnostics. Journal of Polisch CIMAC, Vol. 3, Issue 2, 2008.
-
Parloo E., Verboven P., Guillaume P., Van Overmeire M. Sensitivity-based operational mode shape normalization. Mechanical Systems and Signal Processing, Vol. 16, Issue 5, 2002, p. 757-767.
-
Stöbener U., Gaul L. Active vibration control of a car body based on experimentally evaluated modal parameters. Mechanical Systems and Signal Processing, Vol. 15, Issue 1, 2001, p. 173-188.
-
Łukasiewicz M. Vibration measure as information on machine technical condition. Studies & Procedings of Polish Association for Knowledge Management 35, Bydgoszcz, 2010.
-
Peeters B., Van der Auweraer H., Guillaume P., Leuridan. The PolyMAX frequency-domain method: a new standard for modal parameter estimation? Journal Shock and Vibration, Vol. 11, Issues 3-4, 2004, p. 395-409.
-
Uhl, T., Lisowski, W. Operational modal analysis and its application. AGH, Kraków, 1999, (in Polish).
-
Uhl T., Kurowski P. Vioma – User’s guide. AGH, Kraków, 2002.
-
LMS International Virtual.Lab, Rev. 11. 2012.
-
Van Der Auweraer H., Van Langenhove T., Brughmans M., Bosmans I., Masri N., Donders S. Application of mesh morphing technology in the concept phase of vehicle development. International Journal of Vehicle Design, Vol. 43, Issue 1-4, 2007, p. 281-305.
-
The LMS SCADAS III recorder manual. LMS International, 2010.
-
The LMS Test.Lab Operational Modal Analysis Lite manual. LMS International, 2010.
About this article
