Abstract
Chaotic vibrations in elastic mechanical systems are not stationary. In the considered case a transient induced vibration is discussed. Here the energy is concentrated in different varying frequency ranges. This contribution considers an experimental investigation of jumping phenomena in this system under chaotic vibrations, driven by cart under harmonic excitation. Using this system, the data of jumping phenomenon during the chaotic vibration are collected and analyzed. Here, time-frequency energy method can effectively show the characteristics of energy in time domain and perform the component analysis in specific frequency range. Applying a comparative study of jumping phenomenon discussing different equilibria, frequency range recognition, and energy characterization, the jumping phenomenon of the pendulum signal induced by chaotic vibration is characterized. A state transition model is established. Further, an additive impulsive control on the elastic system is considered to validate the model.
1. Introduction
Time and frequency domain analysis are two signal processing methods widely used for vibration analysis. Although there are many advantages of the analysis in time and frequency domain, there are aspects that may be lacking. In time domain analysis, the cluttering of nonstationary signals may not be efficiently distinguished, while in frequency domain analysis, the characteristics in certain frequency domains are neglected [1]. In time-frequency energy method, using adjustments of the length of the window, the characteristics of energy in time domain can be effectively shown. Components of specific frequency range can be shown, so that transient effects are pointed out more clearly. As a popular example of a nonlinear system, an inverted flexible pendulum subjected to harmonic excitation is experimentally analyzed. The chaotic vibration of this elastic mechanical system is transient, so the energy is concentrated in different frequency range which vary.
In this paper, the analysis of jumping behavior of an inverted flexible pendulum with tip mass is investigated. Flexible pendulum system is a popular and most common example of flexible link system in robotics. The challenge here is that the number of variables to control in such system is more than that of the control input. In this paper, the authors experimentally explored and analyze the behavior of jumping event during chaotic vibration of the inverted flexible pendulum system subjected to harmonic excitation. Data of chaotic jumping are collected during the experimental work under correct working parameters.
To define the different state of chaotic jumping, the experimental data will be analyzed in order to characterize the behavior of jumping between multiple equilibria by energy/power content in a specific frequency range, and states transition of the chaotic jumping. The experimental results of chaotic oscillations observed are presented in time behavior representation as well as 3D spectrogram and discussed in detail, concentrating on how signal energy/power changes in different frequency ranges during pendulum’s chaotic vibration, and how these take place upon transition between states of equilibria. The research question is related to suitable characterization of the jumping phenomena, during the transition between different states of equilibria.
1.1. Control of nonlinear mechanical systems
Control of the inverted pendulum system remains as a challenging task as it is highly unstable, highly non-linear, and nonminimum phase system [2]. The system is widely applied experimentally as an example of a nonlinear mechanical system to demonstrate chaotic behavior upon harmonic excitation. Recent studies on chaos in inverted flexible pendulum with tip mass were demonstrated by Gorade et al. [3] introduced a new mechanical approach for modeling the system of an elastic inverted pendulum on a cart with significant tip mass having multiple dynamic equilibria, with the mathematical model is framed using Euler-Lagrange analysis. Donaire et al. in [4] performed the control of underactuated nonlinear mechanical systems using energy shaping procedure without solving the partial differential equations (PDEs). In this energy shaping procedure, the stabilization of the systems by shaping the energy function and preserving the system structure’s kinetic energy is applied. The application of energy shaping control on an inverted flexible pendulum fixed to a cart is further studied by Gandhi et al. [5] in 2016. This paper considers an ultra-flexible inverted pendulum fixed on a cart and a new nonlinear energy shaping controller to keep the pendulum at the upward position. The design is based on a model, obtained via constrained Lagrange formulation, which previously has been validated.
1.2. Time-frequency energy analysis
Experimental chaotic time series data from chaotic systems was analyzed using the orthogonal wavelet transform [6]. The wavelet analysis gives useful information about the system through the energy concentration at specific wavelet levels. In other areas, time-frequency-energy analysis on non-stationary signals are applied in [7]. A new algorithm for efficient and precise time-frequency-energy (TFE) analysis of signals, named intrinsic time-scale decomposition (ITD) was introduced. This method overcomes the limitations of classical methods. (e.g. Fourier transform or wavelet transform based). In [8], an algorithm for the detection of single and multiple tracks in spectrograms are developed. A new potential energy formulation has been introduced to utilize the structural and intensity information to increase detection rates. Signal processing using time-frequency energy method are presented in [1] for ground vibration induced by metro. Through frequency band recognition and energy characterization, the vibration signal induced by non-metro aspects was effectively separated.
1.3. Parseval’s theorem of signal energy
In signal processing, signal is often characterized by the term signal energy or signal power. The description of a signal can be represented in two different ways, time domain and Fourier (frequency) representation. The energy and power of a signal expressed in time domain are equal when the same signal is described in the frequency domain. According to Parseval’s theorem, the equations that relates signal energy, in both representation can be calculated through the integral as:
Assuming and are the fields of impulse in time and frequency domain respectively, with is the Fourier transformation of . Therefore in Eq. (1), Parseval’s theorem states that signal energy calculated in time domain is equal to signal energy calculated in frequency domain. In Eq. (2), Parseval’s theorem is stated in the form of energy conservation where power-time is in unit of Watt and energy-spectrum is in unit of Watt/Hz2:
In this contribution, the Parseval’s theorem is applied in the energy calculation by evaluating the energy carried by impulses both in the time and frequency domain.
2. Experimental procedure
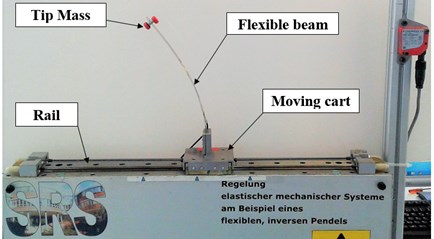
The experimental setup, shown in Fig. 1(a), is designed to observe the chaotic vibration of the flexible beam on a moving cart. The oscillating cart is driven by a motor and controlled motion is given to it, realizing the required sinusoidal excitation to the fixed end of the flexible beam with tip mass. A displacement sensor is mounted on the system frame parallel to the flexible beam for measuring the displacement during the chaotic vibration, while a strain gauge is mounted on one side of the beam to accurately capture the strain at the base of the flexible beam.
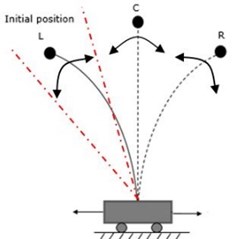
The initial deformation of the flexible beam with tip mass exists with a stable equilibrium position on one side, the left equilibrium. In Fig. 1(b), all of the equilibrium regions observed from jumping phenomena of the flexible beam during chaotic vibration caused by the cart oscillation are denoted as L (left), C (center), and R (right). Some simple and easily verified sufficient experimental conditions and parameters were tested for such chaotic vibration control application in our earlier study [9].
Fig. 1Experimental setup; a) inverted flexible pendulum system; b) equilibrium regions for jumping phenomena
a)
b)
3. Analysis for nonlinear vibration of the inverted flexible pendulum system
3.1. Analysis of time-frequency energy
In the time-frequency transformed illustration of the energy (Fig. 2), the left figure represents the power spectral density function by Fourier transform while the bottom figure shows the time history of flexible beam jumping event in chaotic vibration. The time history is obtained from jumping event and the frequency domain analysis curve of the amplitude represents the energy of the whole vibration signal. The blue to red bar on the right represents the relatively low and large energy concentration of the time-frequency energy distribution. The time-frequency energy represents the effect of time axis and frequency axis along with the quantity of energy by different colors, as in the figure. The energy is observed mainly distributed in the domain by its lower and higher position.
Therefore, this analysis represents three-dimensional aspects of the signal of the chaotic vibration; the time behavior, the frequency ranges, and the energy distribution. To characterize the behavior of each jumping behavior, time-frequency energy analysis on the energy distribution between jumping states is performed.
3.2. State transition model
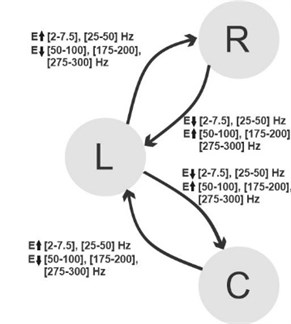
Techniques of signal processing and time-frequency energy analysis are applied to the experimental data from jumping events of the flexible beam. From the characterization of the data, the energy distribution behavior between jumping states can be modeled as a state model, shown in Fig. 3. The systems are also characterized by the range of frequencies to which they respond.
This model shows the behavioral change described by relations between energy changes in specific frequency bands, analyzed from the jumping events of the flexible beam during chaotic vibration. In Fig. 3 L, R, and C denote the left, right, and center equilibrium of jumping behavior, respectively. Based on the state model, the state transition appears between L-R-L and L-C-L equilibrium. According to this experimentally-obtained model [10], a suitable impulse event control of the system is newly introduced. Impulses in frequency-specific energy based on this state model are designed and injected into the system to actuate the state transition and control the jumping event. For further details, please refer to [10, 11].
Fig. 2Illustration of time-frequency energy vs. time history and Fourier spectrum
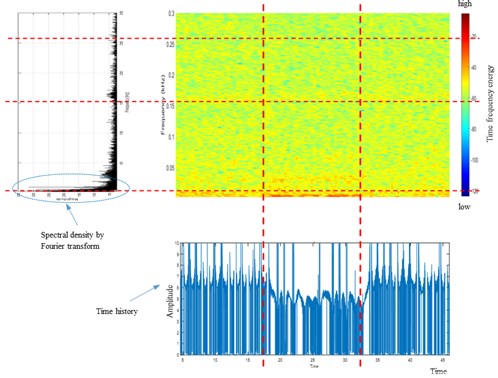
Fig. 3State model established of energy changes in frequency bands
3.3. Analysis of system’s equilibrium shift caused by additive impulses
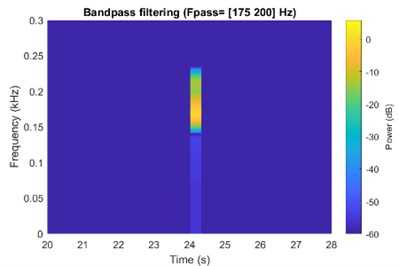
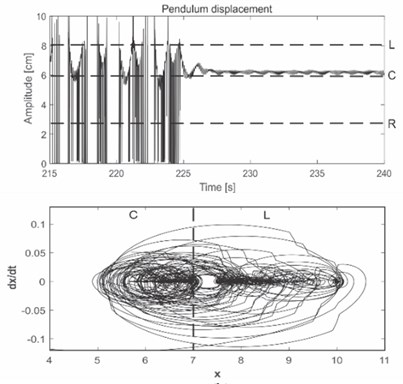
In Fig. 4(a), a spectrogram of suitably designed impulses, filtered in specific frequency band before being added into the system is shown. This specific frequency band of impulses is based on the state model in Fig. 3, in order to induce the desired jumping behavior. In Fig. 4(b), the result shows that additive impulses designed and injected able to produce equilibrium shift and therefore control the chaotic system behavior. The time response and phase portrait of equilibrium shift from left (L) to center (C) equilibrium are displayed.
From the phase portrait, the beam vibrates to and from passing through two equilibria (left and center) in the steady state. Therefore, the equilibrium region about which vibration occurs depends on the designed impulse and the frequency at which the impulse is injected. It can be stated that the control impulses act as perturbation in terms of the energy distribution between the frequency ranges the system vibrates with, followed by related jumping between the equilibria.
4. Experimental validation of state transition model
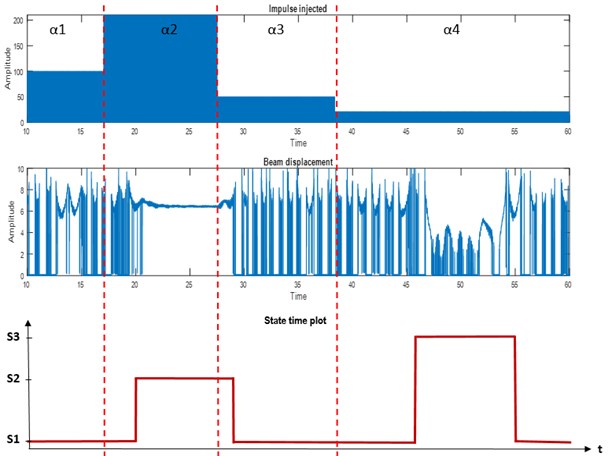
Experimental validation is carried out where impulses injected are filtered at high frequency band [50, 75] Hz. The impulses as input signal with specific parameters (amplitude, width, period) are designed, generates specific energy content before being injected as perturbation to the system. In Fig. 5 the amplitude () of impulses injected, the flexible beam time behavior (displacement), and the state time plot are plotted as a function of time.
Amplitude of impulses are given as 100 mm, 210 mm, 50 mm, and 20 mm, representing the desired level of energy content in each impulse. S1, S2, and S3 denote the left (L), center (C), and right (R) equilibrium respectively. As the energy content in impulses is changed by varying the amplitudes from to , the equilibrium shifted from position S1-S2-S1-S3-S1, which represents L-C-L-R-L equilibrium. The actual displacement of the flexible beam can be seen from the beam displacement time series plot. Tested in one full cycle, the additive impulses show the chaotic behavior in terms of equilibrium shift that validate the state model proposed.
Fig. 4a) Spectrogram of filtered impulse signal into specific frequency; b) time response and phase portrait for left (L) to center (C) equilibrium shift
a)
b)
Fig. 5Impulse behavior effecting the state transition
5. Conclusions
In this work the experimental modeling and validation of chaotic vibration behavior of an inverted flexible pendulum system is presented. From the analysis of time-frequency energy using STFT-spectrogram distribution, signals can be characterized. In this contribution, the time-frequency energy is calculated, modeled, followed by designing new impulses as an additive impulsive control.
From the analysis, a state model is established as an experimental modeling procedure, describing the equilibrium changes in relations with energy changes in specific frequency band. Based on this model, a suitable impulse event control of the system developed and introduced. Impulses with specific energy content and frequency band are designed. These controlled impulses act as perturbation in terms of the energy distribution between the ’modes’/frequency ranges the system vibrates with, which will leads to a new distribution in energy, followed by related jumping and equilibrium shift in the system.
References
-
Li G. Z., Ren X., Zhang B., et al. Analysis of time-frequency energy for environmental vibration induced by metro. Proceedings of the 6th International Conference on Advances in Experimental Structural Engineering, United States, 2015.
-
Muskinja N., Tovornik B. Swinging up and stabilization of a real inverted pendulum. IEEE Transactions on Industrial Electronics, Vol. 53, 2006, p. 2004-2016.
-
Gorade S. K., Kurode S. R., Gandhi P. S. Modeling of inverted elastic pendulum on cart with tip mass (IEPCTM) system having multiple dynamic equilibria. International Conference on Industrial Instrumentation and Control, 2015, p. 852-856.
-
Donaire A., Mehra R., Ortega R., et al. Shaping the energy of mechanical systems without solving partial differential equations. IEEE Transactions on Automatic Control, Vol. 61, 2016, p. 1051-1056.
-
Gandhi S. P., Borja P., Ortega O. Energy shaping control of an inverted flexible pendulum fixed to a cart. Control Engineering Practice, Vol. 56, 2016, p. 27-36.
-
Murguia J. S., Campos Canton E. Wavelet analysis of chaotic time series. Mexican Physic Review, Vol. 52, 2006, p. 155-162.
-
Frei M. G., Osorio I. Intrinsic time-scale decomposition: time-frequency-energy analysis and real-time filtering of non-stationary signals. Proceedings of the Royal Society, Vol. 463, 2007, p. 321-342.
-
Lampert T. A., O’keefe S. E. M. On the detection of tracks in spectrogram images. Journal of Pattern Recognition, Vol. 46, 2013, p. 1396-1408.
-
Kahar H., Madadi E., Sӧffker D. Experimental investigation on the dynamic behavior of chaotic jumping in inverted flexible pendulum under harmonic excitation. 30th Conference on Mechanical Vibration and Noise, Quebec, Canada, 2018.
-
Kahar H., Sӧffker D. Analysis of the nonlinear chaotic behavior of an inverted flexible pendulum system affected by impulses. Proceedings in Applied Mathematics and Mechanics, February 2019.
-
Kahar H., Sӧffker D. Experimental study on an elastic mechanical system showing chaotic dynamical behavior. Eccomas Multibody Dynamics Conference, Duisburg, Germany, 2019, (in press).
About this article

