Abstract
This paper presents a method of mistuning identification of a random mistuned bladed parameter, to predict the forced vibration characteristics of random mistuned blade disk of aeroengine compressor, based on the prestress mode synthesis method, substructure finite element reduction model was adopted, the identification method combines Weibull distribution with Monte Carlo simulation to identify the random mistuned blade parameters. The vibration characteristics of mistuned bladed disks under different engine orders of excitation were calculated, and the vibration characteristics of mistuned bladed disk systems under different mistuning standard deviations were discussed. Vibration localization characteristics of mistuned bladed disk system were analysed by using localization factor. The correctness of the identification method was verified by calculating the vibration amplitude of mistuned bladed disk system under different mistuning standard deviations.
Highlights
- A method of mistuning identification of a random mistuned bladed parameter based on Weibull distribution and Monte Carlo simulation is proposed.
- The vibration characteristics of mistuned bladed disks under different engine orders of excitation are studied.
- The vibration characteristics of mistuned bladed disks under different mistuning standard deviations are discussed.
- Vibration localization characteristics of mistuned bladed disk system are analysed by localization factor.
1. Introduction
In theory, the blade disk system should be a circular symmetrical structure, but due to processing, installation, wear and in order to suppress flutter, the mass, stiffness and natural frequency of each blade are different, that is, mistuning. Mistuning will cause the vibration energy of the blade disk system to concentrate on a few blades, resulting in serious vibration localized, leading to fatigue failure, thereby affecting the service life of the compressor blade disk system. Therefore, it is very important to study the vibration response of the blade disk system caused by blade mistuning. For mistuned blade disk system, the correct identification of mistuned parameters is the key to the dynamic analysis of the mistuned blade disk system. The blade mistuning can be divided into mass mistuning, damping mistuning and stiffness mistuning according to the mistuning parameters, and random mistuning and deterministic mistuning according to the mistuning form. Random mistuning is based on a specific distribution function, using different mean and standard deviation of mistuning to deal with the mistuning of blade parameters. Correct identification of mistuning parameters is the key to the simulation of the blade disk system. Since SNM and FMM do not decompose the substructures, the key to the identification of mistuning parameters is to select a reasonable modal set. The corresponding identification methods are SNM identification method [1] and FMM identification method [2].
Mignolet [3] in order to accurately predict the statistical characteristics of the forced response of mistuned bladed disks, three different methods are proposed to solve the problem of insufficient data, and the three methods are validated on the lumped parameter model. Pichot [4] presented a method for identifying the mistuning of blade disk based on the system mode and the measurement of natural frequency. This method establishes the finite element model of blade disk, and presents a computational reduced-order modelling technology based on component-mode substitution method. Laxalde [5] proposed a model updating method based on the reduced-order model established by modal synthesis method. The method takes the measured modal data as input, and the modal data are extracted from the forced response measurement of the whole blade disk. In the process of mistuning identification, the measured data are regularized to reduce the impact of the final measurement error. Madden [6, 7] proposed an inverse reduced-order model suitable for solving the inverse problem of mistuning identification and a technique suitable for identifying high-order modal families. This improves the overall accuracy and robustness of mistuning identification. Wang [8] aiming at the problem of mistuning identification of integral blade disk, a method based on the classical modal method was proposed, which combines the analytical modal of the tuned blade disk system with the measurement modal of mistuned structure. Judge [9] proposed two methods for identifying single blade mistuning by measuring the response of the blisks, which is especially suitable for the blisks whose single blade cannot be tested separately. Lu [10] analysed the frequency response of a piezoelectric smart beam rotating in a plane by the Hamilton's principle.
Nyssen [11, 12] studied the experimental modal analysis of the theoretical blade disk using basic excitation to identify the mistuning of each blade. In this method, the optical measurement is used to obtain the precise geometric structure of the structure, and the geometric mistuning can be correlated to each blade. Weber [13] proposed a method to determine modal characteristics by experiments and optimizes random mistuning pattern to match these characteristics. Jamia [14] proposed a blade mistuning index (WEBMI), which was obtained by the wavelet packet transform of blade tuning and mistuning response. The proposed mistuning index was proved on the lumped parameter model. The experimental results show that the proposed method can identify fine mistuning.
In this paper, a mistuned parameter identification method based on Weibull distribution and Monte Carlo simulation is proposed. By calculating the parameters identified by this method, only a small number of samples can be used to obtain results consistent with a large number of samples, which greatly reduces the calculation time.
Based on the reduced order model of the Prestressed Component Mode Synthesis Method in Ref. [15], this study mainly focuses on forced response characteristics of the random mistuned blade which are not involved in Ref. [15]. This paper based on the Prestressed Component Mode Synthesis Method,the finite element reduction model of mistuned blade disk system was adopted, the mistuning parameters were identified by the combination of Weibull distribution and Monte Carlo simulation technology, the vibration response of the mistuned bladed disk system were studied. The vibration response of mistuned bladed disk system under different mistuned standard deviations was discussed. The localization factor was defined and the vibration localization characteristics of mistuned bladed disk system were analysed by the localization factor. The identification method was verified by calculating the vibration amplitude under the different mistuning standard deviation.
2. Identification method of random mistuned blade parameters
For actual engineering blade disk system, mistuning destroys the cyclic symmetry and results in different stiffness and frequency of each blade. If the lumped mass model was used to study the localization characteristics of random mistuning blade disk vibration, which cannot accurately reflect the vibration characteristics of actual engineering blade disk system.
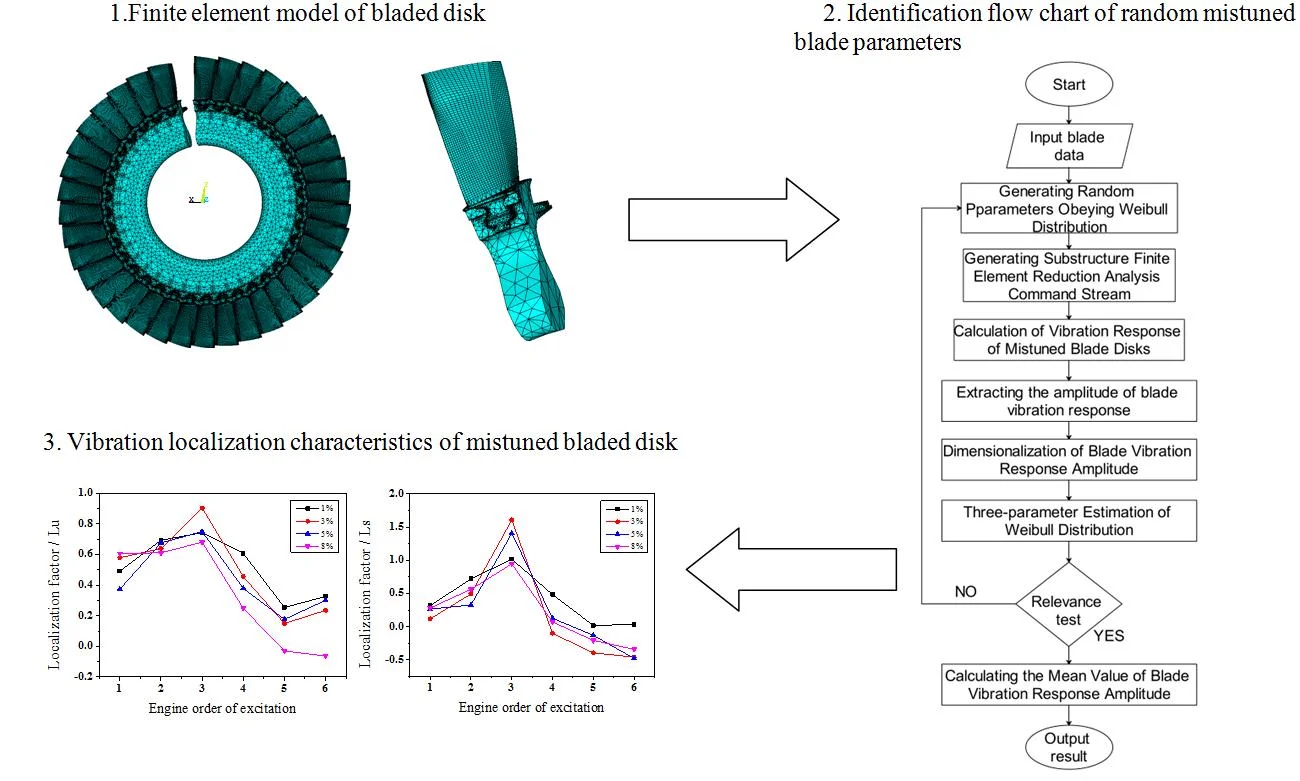
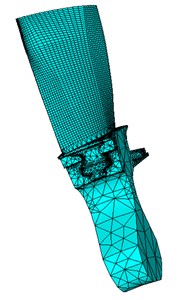
In order to overcome the problem of a large number of nodes and elements in integral blade disk, a finite element reduction model is established by using the prestressing mode synthesis method described in reference [15], refer to reference [15] for the prestressing modal synthesis method, which is not described in detail here. Fig. 1(a) is a model of integral blade disk after cutting a sector to show the cross section of the substructure sector, and Fig. 1(b) is a substructure model. The basic sector of the substructure is divided into 52163 elements, and the number of nodes is 79174. The material properties of the model are listed in Table 1.
If the integral blade disk model was used, but because of the large number of elements and nodes of the integral blade disk finite element model, it is difficult to calculate. Even if the blade disk system substructure finite element reduction model shown in Fig. 1 is used to reduce the degree of freedom of the model, the sample size will be too large, which will lead to a long calculation time. It is also difficult to obtain the statistical characteristics of the random vibration of the mistuned blade disk system.
Fig. 1Finite element model of bladed disk with one sector cut out
a) Bladed disk
b) Substructure model
Table 1Blisk material properties
Balde material property | Property value | Disk material property | Property value |
Mass density | 4400 kg⋅m−3 | Mass density | 4700 kg⋅m−3 |
Modulus of Elasticity | 113 GPa | Modulus of Elasticity | 150 GPa |
Poisson’s ratio | 0.3 | Poisson’s ratio | 0.3 |
Since the maximum value of the structural vibration response of a random mistuned bladed disk system is studied, the maximum value of the structural vibration response of the bladed disk obeys the Weibull distribution from the theory of extreme value statistics. In the literature [16, 17], the Weibull distribution is used to analyze the random vibration characteristics of mistuned bladed disk system. The results show that a large number of random mistuned data can be simulated by using a small number of random mistuned data satisfying Weibull distribution, and the results are consistent with a large number of data. In this paper, the random mistuning problem is studied by combining the Weibull distribution with Monte Carlo simulation.
The distribution function of the three-parameter Weibull distribution is:
where, , and are the position parameter, the scale parameter and the shape parameter are respectively, , , , is random variables, and here is the maximum dimensionless amplitude of the mistuned blade.
The probability density function of the Weibull distribution is:
In order to make the sample obey the Weibull distribution, it is necessary to determine the estimated values of three-parameter , and . Making the three-parameter Weibull distribution as close as possible to the distribution determined by sample data.
The probability density function of Weibull distribution of Eq. (2) is logarithmic on both sides:
The value of the formula is obtained from Monte Carlo simulation data, where the value is the dimensionless of vibration amplitude, and the position parameter is the maximum value of . As can be seen from the reference [18], the position parameter value can be approximated by the following equation for mistuned blade disk vibration:
For Eq. (3), make Weibull transformation, and are given by:
When , , when , .
The data obtained by Monte Carlo simulation are arranged from small to large and can be obtained by using the median rank formula [19]:
For ; ;…; calculated times, if there is a linear relationship between and , the data calculated above satisfies the requirement:
where and are regression coefficients, independent of each other and subject to distribution, the expression becomes:
Eq. (7) can be written as:
i.e.
The Eq. (9) is called empirical regression equation.
In order to obtain estimates and of and , is given by:
represents all computed data and:
sum of squares of deviations. The least square method is to determine and so that the square of the deviation and are minimized, is given by .
According to the extremum principle of multivariate functions, and must satisfy the equations:
Upper equation can be rearranged as follows:
Divide the two sides of the first equation by and rewrite it as follows:
where:
Substituting Eq. (12) into the Second Equation in Eq. (11), and rewrite it as follows:
i.e.
The data and obtained by Monte Carlo simulation are substituted into Eq. (12) and Eq. (14), and the estimates and of and are obtained. Finally, the scale parameter and shape parameter are obtained by Eq. (3).
Whether the calculated data have good linearity should be tested, that is, the fitting degree test of a regression equation. Generally, the size of the correlation coefficient is used to describe the degree of correlation between two variables, and its mathematical expression is as follows:
The closer the absolute value of is to 1, the better the regression line fits the calculated data points. When 1, the two variables were positively correlated, when –1, the two variables were negatively correlated; when at that time, it was meaningless to calculate the scattering of data points along both sides of the regression line, that is, the regression line. Therefore, after finding the linear equation by regression method, the value of correlation coefficient must be calculated, then the significant value of can be found in the test table of correlation coefficient according to the number of calculation groups, and then the degree of fitting can be judged.
For the statistical characteristics of vibration response of random mistuned bladed disk system, this paper adopts the method of combining Weibull distribution with Monte Carlo simulation. The Monte Carlo method is a very important numerical calculation method guided by probability and statistics theory. It refers to the use of random numbers to solve many computational problems.
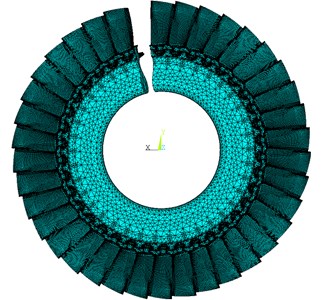
Fig. 2Identification flow chart of random mistuned blade parameters
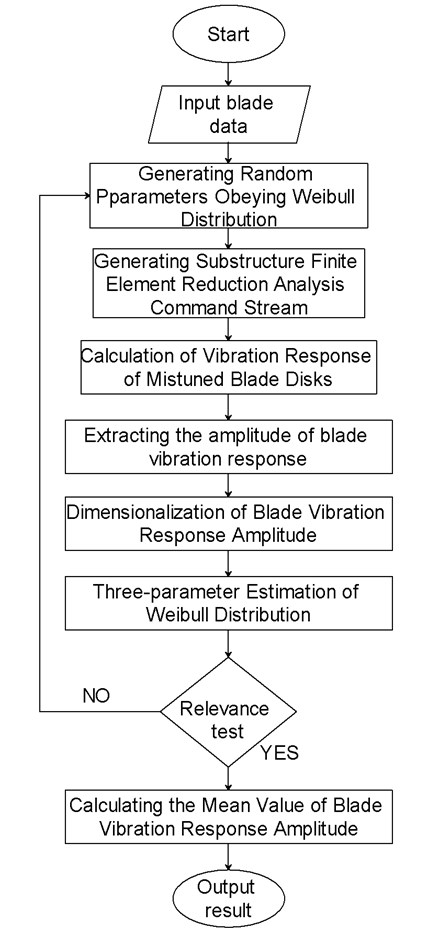
Fig. 2 is an identification flow chart of random mistuned blade parameters, the analysis steps of this method are as follows:
(1) According to Weibull distribution, a group of mistuning values of elastic modulus of blades is generated randomly.
(2) The mistuning of the elastic modulus of the blade is written into the command stream file of the finite
element analysis, and the finite element calculation are carried out.
(3) The amplitude of blade vibration response is extracted through the analysis results of finite element method.
(4) Dimensionalization of blade vibration response amplitude, and the three-parameter estimation and correlation test of Weibull distribution are carried out.
(5) Repeat steps (1)-(4) to obtain the amplitude of the vibration response of the random mistuned bladed disk system.
(6) Statistical analysis of the obtained amplitude is carried out to obtain the statistical law that satisfies the Weibull distribution.
The mistuning parameters of the blade are analysed by introducing random mistuning of blade stiffness when the mistuning standard deviation is 1 %, 3 %, 5 % and 8 %. The maximum amplitude of blade vibration under each mistuning standard deviation is calculated by combining the Weibull distribution with Monte Carlo simulation technology.
3. Forced vibration response of mistuned blade disk system
When the frequency of the excitation force is equal to the dynamic frequency of the compressor blade disk system and the order of the excitation force is equal to the nodal diameter, the resonance will occur. Because the actual force situation of the blade disk system is more complex, the aerodynamic excitation is usually simplified to a single point excitation acting on the blade tip node in the dynamic analysis.
The dynamic equation of blade disk vibration is as follows:
where, [] is the mass matrix, [] is the damping matrix, [] is the stiffness matrix, [] is the excitation force vector, and the excitation force component acting on the th blade is:
where, , , , are the magnitude, frequency, number of blades and phase angle of the excitation force on the th blade are respectively, is given as:
where, is engine orders of excitation.
The real and imaginary values applied in finite element analysis can be obtained by Eq. (19) and Eq. (20).
Real part value:
Imaginary part value:
where, 8; is the number of blades, 1, 2, …, . In this study, the damping ratio is selected according to the actual working conditions of the blade disk, . According to Eq. (18), the magnitude of the phase angle between adjacent blades is determined by the order of excitation.
The Stator blade number and rotor blade number are and respectively. Then the excitation phase difference is:
and the mode phase difference can be expressed as:
When the order of excitation is equal to the number of nodal diameter, the blade disk system resonates, i.e.:
where, 0, 1, 2, 3….
The above equation can be rewritten as:
When the number of stator blades is larger than that of rotor blades, the following relationship is satisfied for the order of excitation:
so:
The condition described in Eq. (23) is satisfied and resonance can be induced. When the standard deviation of elastic modulus mistuning is 1 %, 3 %, 5 % and 8 %, respectively, the random mistuning of the blade is introduced to analyse the influence of integer order excitation on the blade disk system. The maximum excitation amplitude of blade mistuning system is 8, and the frequency range of excitation frequency tuning system is 0.96-1.16 near the maximum dimensionless resonance frequency of 1.062. Table 2 and Fig. 3 are a set of random sampling blade mistuning values. The calculation results using the random mistuning values shown in Fig. 4.
From Fig. 4, it can be seen that the frequency response curves of each blade in the blade disk system under different excitation orders were obtained when the blade is mistuned. Under the condition of blade mistuning, the vibration response of each blade in the blade disk system shows great difference. The maximum resonance peak value of mistuning system is much higher than the minimum one. All these indicate that the vibration response of each blade is very different in mistuned blade disk system, and there is obvious localization of vibration response.
When the standard deviation of mistuning is 3 %, the frequency response curves of each blade in the blade disk system under different excitation orders are obtained. It can be clearly seen from the figure that under the condition of blade mistuning, the vibration responses of each blade in the blade disk system show great differences. The maximum resonance peak of the mistuning system appears at the engine orders of excitation of 1 and the maximum value is 1.9067.
Table 2Mistuning value of each blade (Pa)
Blade number | The standard deviation is 1 % | The standard deviation is 3 % | The standard deviation is 5 % | The standard deviation is 8 % |
1 | –2.96×10⁸ | 3.27×10⁹ | –1.11×10⁹ | –3.16×10⁸ |
2 | 5.03×10⁸ | 4.22×10⁸ | –1.23×10⁹ | –7.25×10⁹ |
3 | 4.45×10⁸ | 4.89×10⁹ | –1.72×10⁹ | 9.25×10⁹ |
4 | –1.42×10⁹ | –6.68×10⁹ | 1.31×10⁸ | –1.21×10⁹ |
5 | –1.08×10⁹ | –6.73×10⁸ | 2.91×10⁸ | –6.49×10⁹ |
6 | –8.41×10⁸ | –4.11×10⁹ | 4.69×10⁹ | 1.23×10¹⁰ |
7 | –5.76×10⁸ | 9.90×10⁹ | 8.67×10⁹ | –2.04×10⁹ |
8 | –3.64×10⁸ | 2.81×10⁹ | 2.65×10⁹ | –5.35×10⁹ |
9 | 1.42×10⁷ | 4.70×10⁹ | –1.19×10⁹ | –2.67×10⁹ |
10 | –3.44×10⁹ | –3.60×10⁹ | 3.55×10⁹ | –7.70×10⁹ |
11 | –5.19×10⁸ | –1.60×10⁹ | 1.04×10⁹ | –1.02×10¹⁰ |
12 | 1.41×10⁹ | –9.28×10⁸ | –5.84×10⁹ | 2.29×10¹⁰ |
13 | –1.21×10⁹ | 3.74×10⁹ | 5.39×10⁹ | 1.50×10¹⁰ |
14 | 1.06×10⁹ | –9.46×10⁸ | 1.74×10⁹ | 2.79×10⁹ |
15 | 3.98×10⁸ | 2.39×10⁹ | 7.67×10⁸ | –1.14×10¹⁰ |
16 | –3.29×10⁷ | –6.99×10⁹ | 2.92×10⁹ | –7.86×10⁹ |
17 | 2.07×10⁸ | –1.20×10⁹ | 1.48×10⁹ | –1.60×10⁹ |
18 | –1.78×10⁹ | –2.80×10⁹ | –5.34×10⁹ | 7.19×10⁹ |
19 | –9.60×10⁷ | –5.37×10⁹ | –9.21×10⁸ | –1.21×10¹⁰ |
20 | 1.82×10⁹ | 1.73×10⁹ | –8.29×10⁸ | –2.12×10¹⁰ |
21 | 1.12×10⁸ | 9.60×10⁸ | –3.02×10⁹ | –1.32×10¹⁰ |
22 | 4.70×10⁷ | 1.14×10⁸ | 9.55×10⁹ | 3.03×10⁹ |
23 | –8.33×10⁸ | –4.54×10⁹ | –4.97×10⁹ | 3.55×10⁹ |
24 | –3.50×10⁷ | 3.84×10⁹ | –2.75×10⁹ | 4.10×10⁹ |
25 | 2.64×10⁸ | 1.19×10⁹ | –4.04×10⁹ | –1.18×10⁹ |
26 | 4.84×10⁸ | –1.02×10⁹ | –6.66×10⁹ | 1.67×10⁹ |
27 | –4.23×10⁸ | 7.79×10⁷ | –1.09×10⁹ | –4.32×10⁹ |
28 | –2.68×10⁸ | –8.92×10⁸ | –1.56×10⁹ | 7.83×10⁹ |
29 | 2.30×10⁹ | –5.96×10⁹ | 8.68×10⁹ | –1.24×10¹⁰ |
30 | –2.56×10⁹ | –9.73×10⁸ | –1.41×10⁹ | 4.13×10⁹ |
31 | 2.53×10⁹ | –2.83×10⁹ | –6.04×10⁹ | –7.71×10⁹ |
32 | 3.83×10⁸ | –3.33×10⁹ | 9.10×10⁹ | –3.04×10⁹ |
33 | 1.14×10⁹ | –3.94×10⁹ | 7.01×10⁹ | 5.02×10⁹ |
34 | –1.89×10⁹ | –1.82×10⁹ | –1.30×10⁹ | 9.43×10⁹ |
35 | –6.70×10⁸ | –6.82×10⁹ | –8.55×10⁹ | –1.01×10¹⁰ |
36 | –3.16×10⁸ | 3.28×10⁹ | –2.52×10⁹ | 1.14×10¹⁰ |
37 | 4.80×10⁸ | 1.77×10⁹ | –8.85×10⁸ | 5.99×10⁹ |
38 | –1.90×10⁹ | –6.82×10⁷ | 1.57×10⁹ | –6.16×10⁸ |
From Fig. 4, it can be seen that the frequency response curves of each blade in the blade disk system under different excitation orders were obtained when the mistuning standard deviation is increased to 5 %. It can be seen from the figure that with the increase of the standard deviation of mistuning, the resonance band of the blade-disk system widens to 0.05, and there are many peaks. Under the condition of mistuning, the vibration response of each blade in the blade-disk system shows great difference.
When the mistuning standard deviation increases to 8 %, the frequency response curves of each blade in the blade disk system under different excitation orders are obtained. It can be clearly seen from the figure that with the increase of mistuning standard deviation, the resonance band of the blade disk system widens further. The maximum bandwidth reaches 0.1. The bandwidth is twice that of the standard deviation of 5 %. There are many peaks. Under the condition of blade mistuning, the vibration response of each blade in the blade disk system shows great difference.
Fig. 3Mistuning value of each blade
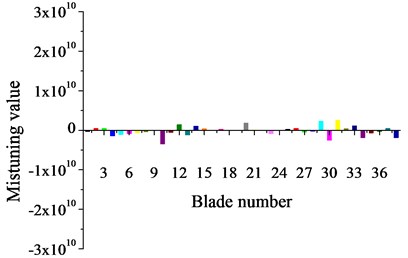
a) The standard deviation is 1 %
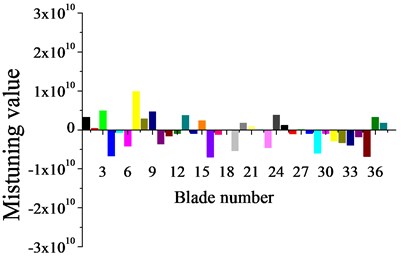
b) The standard deviation is 3 %
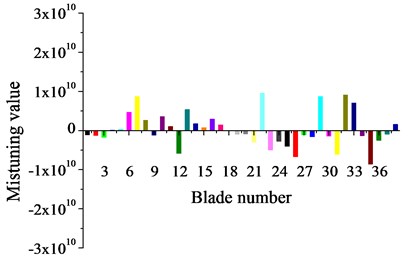
c) The standard deviation is 5 %
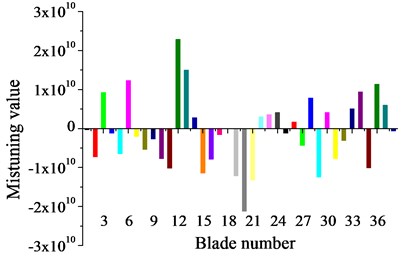
d) The standard deviation is 8 %
Fig. 4Amplitude-frequency characteristics of mistuned bladed disk system
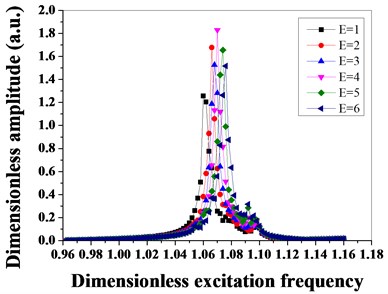
a) The standard deviation is 1 %
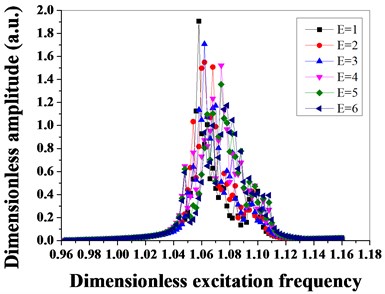
b) The standard deviation is 3 %
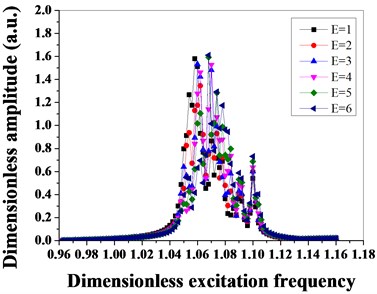
c) The standard deviation is 5 %
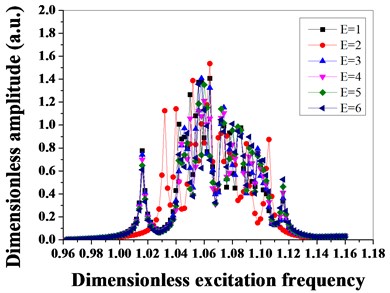
d) The standard deviation is 8 %
In order to evaluate the effect of different mistuning standard deviations on the localization of the structural vibration of the mistuned bladed disk system under different excitation orders, the maximum displacement and strain energy of the structure of the tuned and mistuned bladed disk system under different excitation orders are extracted respectively, and calculated by the following formula of vibration localization factors.
Displacement localization factor:
where, is the maximum amplitude of mistuned bladed disk system for engine orders of excitation is , is the maximum amplitude of the tuned bladed disk system for engine orders of excitation is .
Strain energy localization factor:
where, is the maximum strain energy of the mistuned bladed disk system for engine orders of excitation is , is the maximum strain energy of the tuned bladed disk system for engine orders of excitation is .
Fig. 5Vibration localization characteristics of mistuned bladed disk system
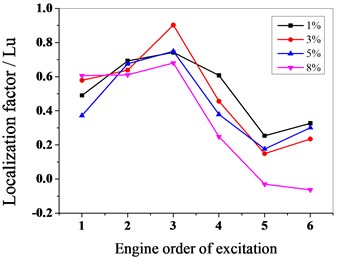
a) Displacement localization factor
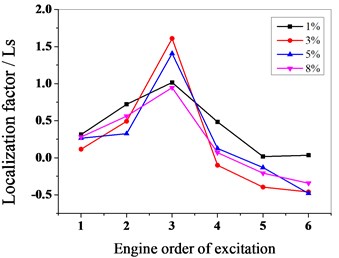
b) Strain energy localization factor
Fig. 6Amplitude for different mistuning standard deviation
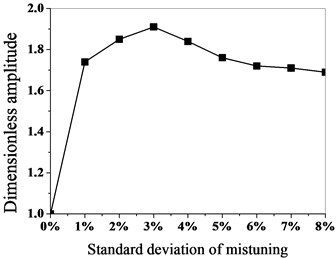
The Weibull distribution and mote Carlo simulation methods proposed in this paper are used for data sampling calculation, and the statistical results as shown in Fig. 5 and Fig. 6 are obtained by analysing the sampling data. As can be seen from Fig. 5, with the increase of excitation order, the displacement localization factor increases first, and then decreases, reaching its maximum at engine orders of excitation 3, with a higher degree of localization, and then decreases with the increase of excitation order. With the increase of excitation order, the strain energy localization factor increases first and then decreases when the mistuning standard deviation is 1 % and 5 %, reaching the maximum at engine orders of excitation 3, and then decreases with the increase of excitation order.
Fig. 6 shows the variation trend of the maximum dimensionless amplitude of mistuned bladed disk system with the standard deviation of mistuning, which is similar to the conclusions obtained from the analysis in reference [20], thus verifying the accuracy of the identification method.
4. Conclusions
A method for mistuning identification of mistuned bladed disk has been presented, which is combined Weibull distribution with Monte Carlo Simulation. Based on the Prestressed Component Mode Synthesis Method, the finite element reduce model of bladed disk system is used to identify the mistuning parameters for random mistuning blades. The forced vibration response characteristics of mistuned bladed disk system under different engine orders of excitation are calculated, and the vibration response of the mistuned bladed disk system under different mistuning standard deviations are discussed. The localization factor is defined and the vibration localization characteristics of mistuned bladed disk system are analysed by the localization factor. The following conclusions are obtained:
1) The mistuning identification method of mistuned bladed disk has been presented, which is combined Weibull distribution with Monte Carlo Simulation. This method can use smaller samples to obtain results consistent with larger samples. Improving computational efficiency greatly.
2) The frequency response curves of each blade in the blade disk system under different excitation orders are obtained when the blade is mistuned. When the condition of blade mistuning, the vibration responses of each blade in the blade disk system show great differences.
3) With the increase of excitation order, the displacement localization factor increases first, and then decreases, reaching its maximum at engine orders of excitation 3, with a higher degree of localization, and then decreases with the increase of excitation order. With the increase of excitation order, the strain energy localization factor increases first and then decreases.
4) The method is validated by comparing simulation results with relevant literature.
References
-
Yang M. T., Griffin J. H. A Normalized modal eigen value approach for resolving modal interaction. Journal of Engineering for Gas Turbines and Power, Vol. 119, Issue 3, 1996, p. 491-499.
-
Feiner D. M., Griffin J. H. Mistuning Identification of bladed disks using a fundamental mistuning model: part 1-theory. Journal of Turbomachinery, Vol. 126, Issue 1, 2004, p. 150-158.
-
Mignolet M. P., Rivas-Guerra A. J., Delor J. P. Identification of mistuning characteristics of bladed disks from free response data – part I. Journal of Engineering for Gas Turbines and Power, Vol. 123, Issue 2, 2001, p. 395.
-
Pichot F., Laxalde D., Sinou J. J., Thouverez F., Lombard J. P. Mistuning identification for industrial blisks based on the best achievable eigenvector. Computers and Structures, Vol. 84, Issues 29-30, 2006, p. 2033-2049.
-
Laxalde D., Thouverez F., Sinou J. J., Baumhauer S., Lombard J. P., et al. Mistuning identification and model updating of an industrial blisk. ASME Turbo Expo: Power for Land, Sea, and Air, 2006.
-
Madden A. C., Castanier M. P., Epureanu B. I. Reduced-order model construction procedure for robust mistuning identification of blisks. AIAA Journal, Vol. 46, Issue 11, 2008, p. 2890-2898.
-
Madden A. C., Castanier M. P., Epureanu B. I. Mistuning identification of blisks at higher frequencies. AIAA Journal, Vol. 49, Issue 6, 2011, p. 1299-1302.
-
Wang S., Wang J. J., Li Q. H. Mistuning identification of integrally bladed disk based on the modal reduced technique. Journal of Aerospace Power, Vol. 24, Issue 3, 2009, p. 662-669.
-
Judge J. A., Pierre C., Ceccio S. L. Experimental mistuning identification in bladed disks using a component-mode-based reduced-order model. AIAA Journal, Vol. 47, Issue 5, 2009, p. 1277-1287.
-
Lu En, Li Wei, Yang Xuefeng, Wang Yuqiao, Liu Yufei Dynamic modeling and analysis of a rotating piezoelectric smart beam. International Journal of Structural Stability and Dynamics, Vol. 18, Issue 1, 2018, https://doi.org/10.1142/S0219455418500037.
-
Nyssen F., Golinval J. C. Identification of mistuning and model updating of an academic blisk based on geometry and vibration measurements. Mechanical Systems and Signal Processing, Vol. 68, Issue 69, 2016, p. 252-264.
-
Nyssen F., Epureanu B., Golinval J. C. Experimental modal identification of mistuning in an academic two-stage drum. Mechanical Systems and Signal Processing, Vol. 88, 2017, p. 428-444.
-
Weber R., Kühhorn A. Mistuning identification approach with focus on high-speed centrifugal compressors. Journal of Engineering for Gas Turbines and Power, Vol. 141, Issue 3, 2018, p. 1-10.
-
Jamia N., Rajendran P., El-Borgi S., Friswell M. I. Mistuning identification in a bladed disk using wavelet packet transform. Acta Mechanica, Vol. 229, Issue 3, 2018, p. 1275-1295.
-
Zhang H. Y., Yuan H. Q., Yang W. J., Zhao T. Y. Study on localization influences of frequency veering on vibration of mistuned bladed disk. Journal of Mechanical Science and Technology, Vol. 31, Issue 11, 2017, p. 5173-5184.
-
Castanier M. P., Pierre C. Modeling and analysis of mistuned bladed disk vibration: status and emerging directions. Journal of Propulsion and Power, Vol. 22, Issue 2, 2006, p. 354-396.
-
Lan H. Q., Zang C. P. Effect of blade stagger angle on forced response of bladed disk assemblies. Journal of Aerospace Power, Vol. 27, Issue 11, 2012, p. 2547-2552.
-
Whitehead D. S. Effect of mistuning on the vibration of turbo-machine blades induced by wakes. Journal of Mechanical Engineering Science, Vol. 8, Issue 1, 1996, p. 15-21.
-
Nelson W. Applied Life Data Analysis. Wiley-Interscience, 2004.
-
Yao J. Y., Wang J. J., Li Q. H. Dynamic characteristics assessment of mistuned bladed disk using nodal diameter spectrum of mode shapes. Journal of Propulsion Technology, Vol. 32, Issue 5, 2011, p. 645-653.
About this article

This research is supported by project of the National Natural Science Foundation of China (No. 51775093), China Postdoctoral Science Foundation (2019M651147), Natural Science Foundation of Liaoning Province (cn) (No. 20170540782) and Basic scientific research projects in Colleges and Universities of Liaoning Province (cn) (No. LG201713).
