Abstract
The paper deals with seismic-type surface and building vibrations randomly occurring as a result of rockbursts in mining regions (random events as with earthquakes). The focus is on the problem of ground vibrations transmission to building foundation – it is one of very important phenomenon associated with soil-structure interaction effect. One of the ways of estimation of possible differences between simultaneously developing free-field vibrations next to a building and building foundation vibrations, i.e. using a ratio of response spectra (), is applied to this study. Analysis concerns the ratio of dimensionless and dimensional acceleration response spectra ( and ) – denoted as () and (), respectively. Horizontal vibrations parallel to the transverse () and longitudinal () axis of the representative (typical) two-storey, masonry office building are discussed. Calculations are based on the results of in situ surface vibration measurements performed in the seismically active Upper Silesian Coalfield (USC) mining area in Poland (long-term, full-scale monitoring). Evaluation of the dependence of the curves of ratio of response spectra on some parameters corresponding to mine-induced vibrations (i.e. epicentral distance, mining shock energy, peak value of free-field vibrations) is executed. From the obtained results, it can be definitely concluded that the influence of the most important mining tremor parameters (i.e. epicentral distance, mining shock energy, peak value of free-field vibrations) on the ratio of response spectra calculated in the successive ranges of these parameters, is clearly observed.
1. Introduction
Surface vibrations affecting buildings could be majorly caused by natural earthquakes. However, earthquakes are not the one only source of ground and building vibrations. So-called paraseismic (corresponding to human activity), various vibrations may also occur [1-6]. Mine-induced tremors are the most intensive of the paraseismic events. Their random occurrence (as with earthquakes) could be dangerous for buildings.
Additionally, the difficulties in the analysis of mining rockbursts increase because of the soil-structure interaction (SSI) effect, analogous to this SSI phenomenon corresponding to earthquakes [7-9]. The differences, often significant, in the vibrations registering at the same time on the free-field near a building and on the foundation level in the building can be visible among other observations in the case of SSI.
One can estimate the possible differences between simultaneously developing free-field vibrations next to a building and building foundation vibrations using a ratio of response spectra (). This way is commonly used in the case of earthquakes [10-12]. In this study we propose to applicate to the other, but also seismic-type shocks, namely that is, mine-induced tremors.
The fundamental goal of the study is the evaluation of the dependence of the curves of ratio of response spectra () on some parameters corresponding to mine-induced vibrations, i.e. epicentral distance (), level of mining shock energy (), peak value of free-field vibrations ().
Analysis concerns the ratio of dimensionless () and dimensional () acceleration response spectra-denoted as () and (), respectively. Horizontal vibrations parallel to the transverse () and longitudinal () axis of the representative (typical) two-storey, masonry office building is discussed. Calculations are based on the results of in situ surface vibration measurements performed using seismological stations in the seismically active Upper Silesian Coalfield (USC) mining area in Poland (long-term, full-scale monitoring).
2. Data from measurements in USC region
The results of in situ surface vibration measurements performed in the seismically active Upper Silesian Coalfield (USC) mining area in Poland (long-term, full-scale monitoring) were the basis of this study. The focus is on horizontal vibrations parallel to the transverse () and longitudinal () axis of the representative (typical) two-storey, masonry office building. Dimensions of the building are: 12.5 m ( direction), 23.8 m ( direction), 7.3 m (height). Building structure is composed of bearing walls in transverse-longitudinal arrangement, without basement, concrete strip foundations (depth 1.4 m). The sub-soil is formed of soil layer, medium and fine sand, partially yellow dust. Locations of epicentre of mine-induced tremors in relation to the building position are put in simply in Fig. 1.
Fig. 1Locations of epicentre of mine-induced tremors in relation to the building position
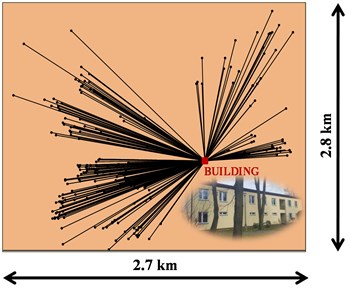
Measurement sensors (‘armed partition’ accelerometers, monitoring) registering the components of vibration accelerations, are located on the ground next to the building and in the building, at the foundation level [13]. Pairs ground-foundation of simultaneously recorded horizontal components of vibrations parallel to the transverse () and longitudinal () axis of the considered building, were analysed. Mine-induced rockbursts with energy () not smaller than from the range of 1.0×10⁵[J]-4.0×10⁹[J] were taken into analysis. The second factor taken into account during the acceptance of the results of measurements for the analysis, has related to peak ground acceleration () of horizontal vibrations. Only the registered records of accelerations with larger than 5 cm/s2 were analysed. Rockburst epicentral distances () are from the range 230-2045 m.
Number of pairs of ground and building foundation vibrations simultaneously recorded in the considered ranges of epicentral distances (), energy levels () and peak ground accelerations (), is given in Table 1. The level of magnitude in the cases of mining tremor energies with values of 105[J], 106[J], 107[J], 109[J], are denoted as E5, E6, E7, and E9, respectively. These data are listed separately in both vibration directions and , parallel to the transverse and longitudinal axis of building. Analogously, the corresponding total number of recorded pairs of vibrations in and jointly (together, without distinction), is also shown in Table 1.
Table 1Number of pairs of ground and building foundation vibrations recorded in the considered ranges of epicentral distances (re), energy levels (En) and peak ground accelerations (agmax)
Direction | Successive ranges of: | Sum | |||||||||
[m] | [J] (level of magnitude) | [m/s2] | |||||||||
To 700 | 701-1500 | 1501-2500 | E5, E6 | E7 | E9 | To 0.300 | 0.301-0.600 | 0.601-0.900 | Over 0.900 | ||
44 | 187 | 11 | 230 | 11 | 1 | 187 | 30 | 16 | 9 | 242 | |
44 | 187 | 11 | 230 | 11 | 1 | 180 | 46 | 6 | 10 | 242 | |
, | 88 | 374 | 22 | 460 | 22 | 2 | 367 | 76 | 22 | 19 | 484 |
3. Ratio of response spectra as a function of rockburst parameters
Differences between the ground and building foundation response spectra (and of course, in fact, at the same time, the differences in the free-field and foundation vibrations) have been estimated using the so-called ratio of response spectra () calculated from Eq. (1) as the followed:
where the response spectrum from building foundation vibrations is denoted as , whereas is the response spectrum from simultaneously registered ground vibrations. Non-dimensional () and dimensional () acceleration response spectra were taken into account. The fraction of critical damping 3 % was taken for the response spectra calculations, according to the results of the previous investigations of buildings [14]. Variants of calculations according to Eq. (1), are shown in Table 2.
Table 2Variants of RRS calculations
In Eq. (1) | Non-dimensional response spectra () | Dimensional response spectra () | ||||
() | () | () | () | () | () | () |
were calculated for each of the corresponding pair of response spectra (ground-building foundation). Subsequently, each individual was placed into separate groups (sets). The sets of were created on the basis of the rockburst parameters: epicentral distance (), rockburst energy (), and peak ground acceleration (). Next, the averaged curves of were prepared in the sets corresponding to the considered ranges of mining tremor parameters (cf. Table 1), separately in the case of direction, direction, and directions together.
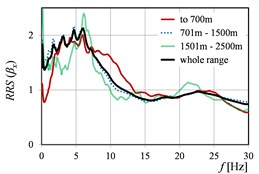
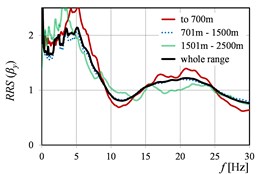
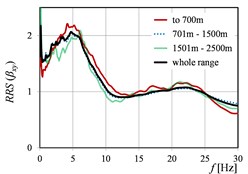
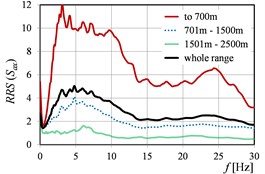
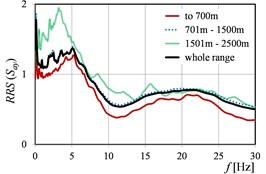
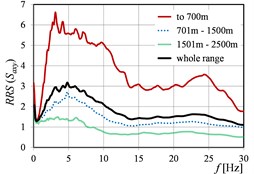
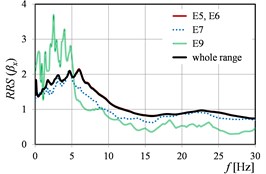
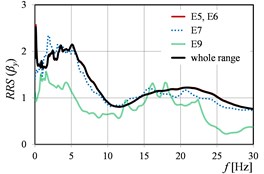
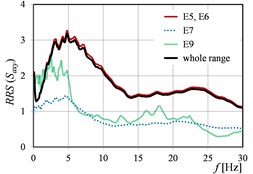
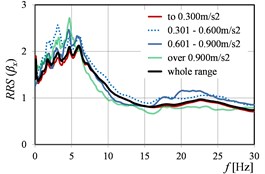
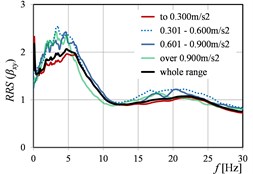
Fig. 2 and Fig. 3 show as the function of mining tremor epicentral distances in the case of dimensionless spectra (Fig. 2) and dimensional spectra (Fig. 3). Analogous curves of , but corresponding to rockburst energy (), and peak ground acceleration (), are presented in Fig. 4, Fig. 5 and Fig. 6, Fig. 7, respectively. Because of the fact that the sources (mine-induced tremors) of the most of measured vibrations originate from the rockbursts with energy level E5 and E6 (cf. Table 1), the averaged in this range of energies, affect in the biggest degree on the averaged in the whole range of energies. The analogous observation concerns the curves calculated in the range of epicentral distances 701-1500 m.
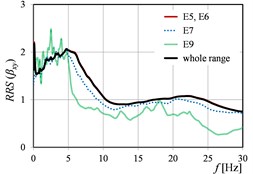
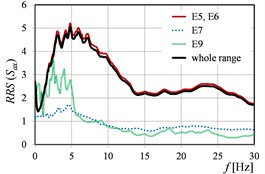
The vibration direction (parallel to the or axis of the building) may have a clear influence on the numerical quantity of the in the analysed ranges of mining parameters. Moreover, even different (opposite) ‘trends’ could be visible in and directions. () and () in the function of the ranges of mining tremor energy (Fig. 4), as well as () and () in the function of the ranges of epicentral distance (Fig. 3), are the examples of this observation. It is worth mention that the analysis in the two directions ( and ) concerns the same ground site (two axes in the same office building). Therefore, the differences in the transmission of the response spectra from free-field to building foundation in and directions, could be resulted from the different stiffness of the two-storey building in each of the direction.
Fig. 2RRSβ as the function of mining tremor epicentral distances in directions: a) x, b) y, c) x and y
a)
b)
c)
Fig. 3RRSSa as the function of mining tremor epicentral distances in directions: a) x, b) y, c) x and y
a)
b)
c)
Fig. 4RRSβ as the function of mining tremor energy levels in directions: a) x, b) y, c) x and y
a)
b)
c)
Fig. 5RRSSa as the function of mining tremor energy levels in directions: a) x, b) y, c) x and y
a)
b)
c)
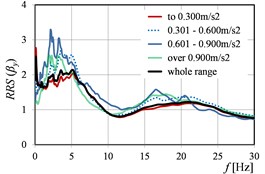
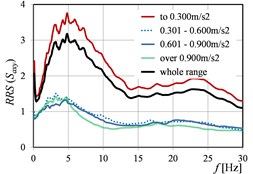
Also, the clear shift of the peak values of () is visible in the successive ranges, practically in the case of each parameter, cf. Fig. 3, Fig. 5, and Fig. 7.
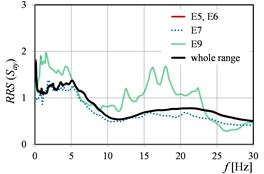
Generally, it can be stated that all the three considered parameters (, , ) affect significantly on the values of (). For (), the differences in the values obtained in the successive ranges of these parameters, are a little smaller than in the case of (), but still essential from the practical point of view.
Naturally, in the all cases of determined on the basis of experimental data, the values calculated in the range of low frequencies (to about 10-12 Hz), are the biggest. This is only confirmed the well-known phenomenon that building works as a low-pass filter.
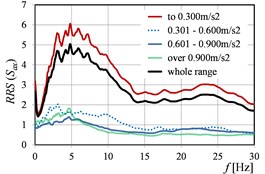
Fig. 6RRS(β) as the function of peak ground acceleration values in directions: a) x, b) y, c) x and y
a)
b)
c)
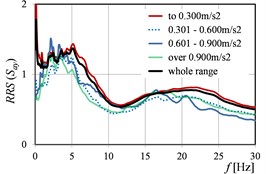
Fig. 7RRS(Sa) as the function of peak ground acceleration values in directions: a) x, b) y, c) x and y
a)
b)
c)
4. Conclusions
From the obtained results, it can be definitely concluded that the influence of the most important mining tremor parameters (i.e. epicentral distance, mining shock energy, peak value of free-field vibrations) on the ratio of response spectra calculated separately in the successive ranges of these parameters, is clearly observed. This conclusion concerning the strong dependence of the nature of the transmission of response spectra from mine-induced ground vibrations to building foundation vibrations on these parameters, is very important in practice.
References
-
Singh P. K., Roy M. P. Damage to surface structures due to blast vibration. International Journal of Rock Mechanics and Mining Sciences, Vol. 47, 2010, p. 949-961.
-
Sanayei M., Maurya P., Moore J. A. Measurement of building foundation and ground-borne vibrations due to surface trains and subways. Engineering Structures, Vol. 53, 2013, p. 102-111.
-
Ji Ch, Gao F., Li X., Yu Y., Cheng L. Numerical analysis of vibration-isolating effect of vibration-isolating slot under buried pipe subjected to millisecond blasting. Vibroengineering Procedia, Vol. 21, 2018, p. 32-37.
-
Hao H., Ang T. C., Shen J. Building vibration to traffic-induced ground motion. Building and Environment, Vol. 36, 2001, p. 321-336.
-
Maciag E., Kuzniar K., Tatara T. Response spectra of the ground motion and building foundation vibrations excited by rockbursts in the LGC region. Earthquake Spectra, Vol. 32, Issue 3, 2016, p. 1769-1791.
-
Zembaty Z. Rockburst induced ground motion – a comparative study. Soil Dynamics and Earthquake Engineering, Vol. 24, 2004, p. 11-23.
-
Fu J., Liang J., Todorovska M. I., Trifunac M. D. Soil-structure system frequency and damping: Estimation from eigenvalues and results for a 2D model in layered half-space. Earthquake Engineering and Structural Dynamics, Vol. 47, 2018, p. 2055-2075.
-
Güllü H., Karabekmez M. Effect of near-fault and far-fault earthquakes on a historical masonry mosque through 3D dynamic soil-structure interaction. Engineering Structures, Vol. 152, 2017, p. 465-492.
-
Kim S., Stewart J. P. Kinematic soil-structure interaction from strong motion recordings. Journal of Geotechnical and Geoenvironmental Engineering, Vol. 129, 2003, p. 323-335.
-
FEMA 440, Improvement of Nonlinear Static Seismic Analysis Procedures, ATC-55 Project, 2005.
-
NIST GCR 12-917-21, Soil-Structure Interaction for Building Structures. NEHRP Consultants Joint Venture (a partnership of the Applied Technology Council and the Consortium of Universities for Research in Earthquake Engineering), 2012.
-
Mylonakis G., Nikolaou S., Gazetas G. Footings under seismic loading: Analysis and design issues with emphasis on bridge foundations. Soil Dynamics and Earthquake Engineering, Vol. 48, Issue 26, 2006, p. 824-853.
-
Kuzniar K., Stec K., Tatara T. Comparison of approximate assessments of the harmfulness of mining shocks using ground and building foundation vibrations. Journal of Measurements in Engineering, Vol. 6, Issue 4, 2018, p. 218-225.
-
Ciesielski R., Kuzniar K., Maciag E., Tatara T. Damping of vibration in precast buildings with bearing concrete walls. Archives of Civil Engineering, Vol. 41, Issue 3, 1995, p. 329-341.
About this article

