Abstract
The paper deals with the stability of earth dams subjected to seismic and paraseismic excitations occurring in the close distance to the dam. The Newmark’s stability approach, classified as a simplified dynamic method, has been extended for two directional dynamic loading case and the evolution of the friction coefficient. The paper is focused on the experimental verification of the proposed method for harmonic and cyclic excitations generated by a simple oscillating device as well as by one-directional shaking table. Main assumptions of the proposed method have been proved and the effect of the vertical acceleration on the stability of the dam has been demonstrated. In the experiments conducted under cyclic loading, the impact of the vertical acceleration on the permanent displacement of the block was equal to 57 %. However, in general, the exact magnitude of this impact depends on many factors, such as the vertical to horizontal peak ground acceleration ratio or frequency range of the vertical component of the earthquake.
Highlights
- Simple slope model firstly proposed by Newmark is considered
- The Newmark’s method has been extended
- The variation of the resistance force during the dynamic load has been proved
- The behavior of block during the one- and two directional cyclic loading has been examined
- The influence of the friction coefficient evolution on the relative block motion has been proved
- Very good agreement between experimental and numerical results has been obtained
1. Introduction
The paper is focused on the evaluation of stability of earth dams subjected to seismic and paraseismic excitations. Commonly, the horizontal component of dynamic load is considered in engineering practice. However, in particular conditions, e.g. in a close distance (dozens of kilometres) to the epicentre of the earthquake, the magnitudes of peak vertical and horizontal components of accelerations may reach similar values. Therefore, the hypothesis has been made that the vertical accelerations’ parameters of earthquakes can also influence the risk of destabilization of the earth structures.
General guidelines and review of methods commonly used for stability assessment of an earth dam subjected to dynamic loading coming from natural earthquakes or induced by mining tremors can be found in [1-4]. In the presented paper, the Newmark’s stability approach, classified as a simplified dynamic method, has been considered as the most appropriate method for examining the assumed hypothesis.
The permanent displacement approach, proposed by Newmark in 1965, is still widely used due to its simplicity and intuitive measure of slope stability [5]. However, the main assumptions and, in consequence, its constraints in applicability should be considered. The Newmark’s block stability method is based on concept of so-called limit equilibrium method, thus, it follows its main hypothesis: rigidity of the soil body, existence of a slip surface, the limit state occurrence along the slip surface, and uniform displacements along the slip surface. Furthermore, resisting forces of a potentially unstable wedge satisfy Coulomb’s law and the shear strength results from static gravity loading only. Newmark has also assumed real-time histories of the acceleration as dynamic loading model and the stability criterion expressed in terms of permanent displacement of the soil cumulated during an earthquake. The above assumptions allow developing a very simple procedure for calculating the permanent displacement.
The above-mentioned assumption, regarding the shear strength, is not appropriate in the condition of vertical accelerations of significant values. Thus, the shear strength variability in time has been introduced to a numerical model of slope stability assessment [6-8]. The evolution of friction coefficient (indicating the distinction between static and kinetic friction coefficient) have also been included in the proposed model. A new method of determination of permanent displacement, firstly proposed in [9], has been used. Thus, the presented paper aims at proving not only the correctness of the assumed hypothesis but also the validity of the assumptions and the accurateness of the applied solution method.
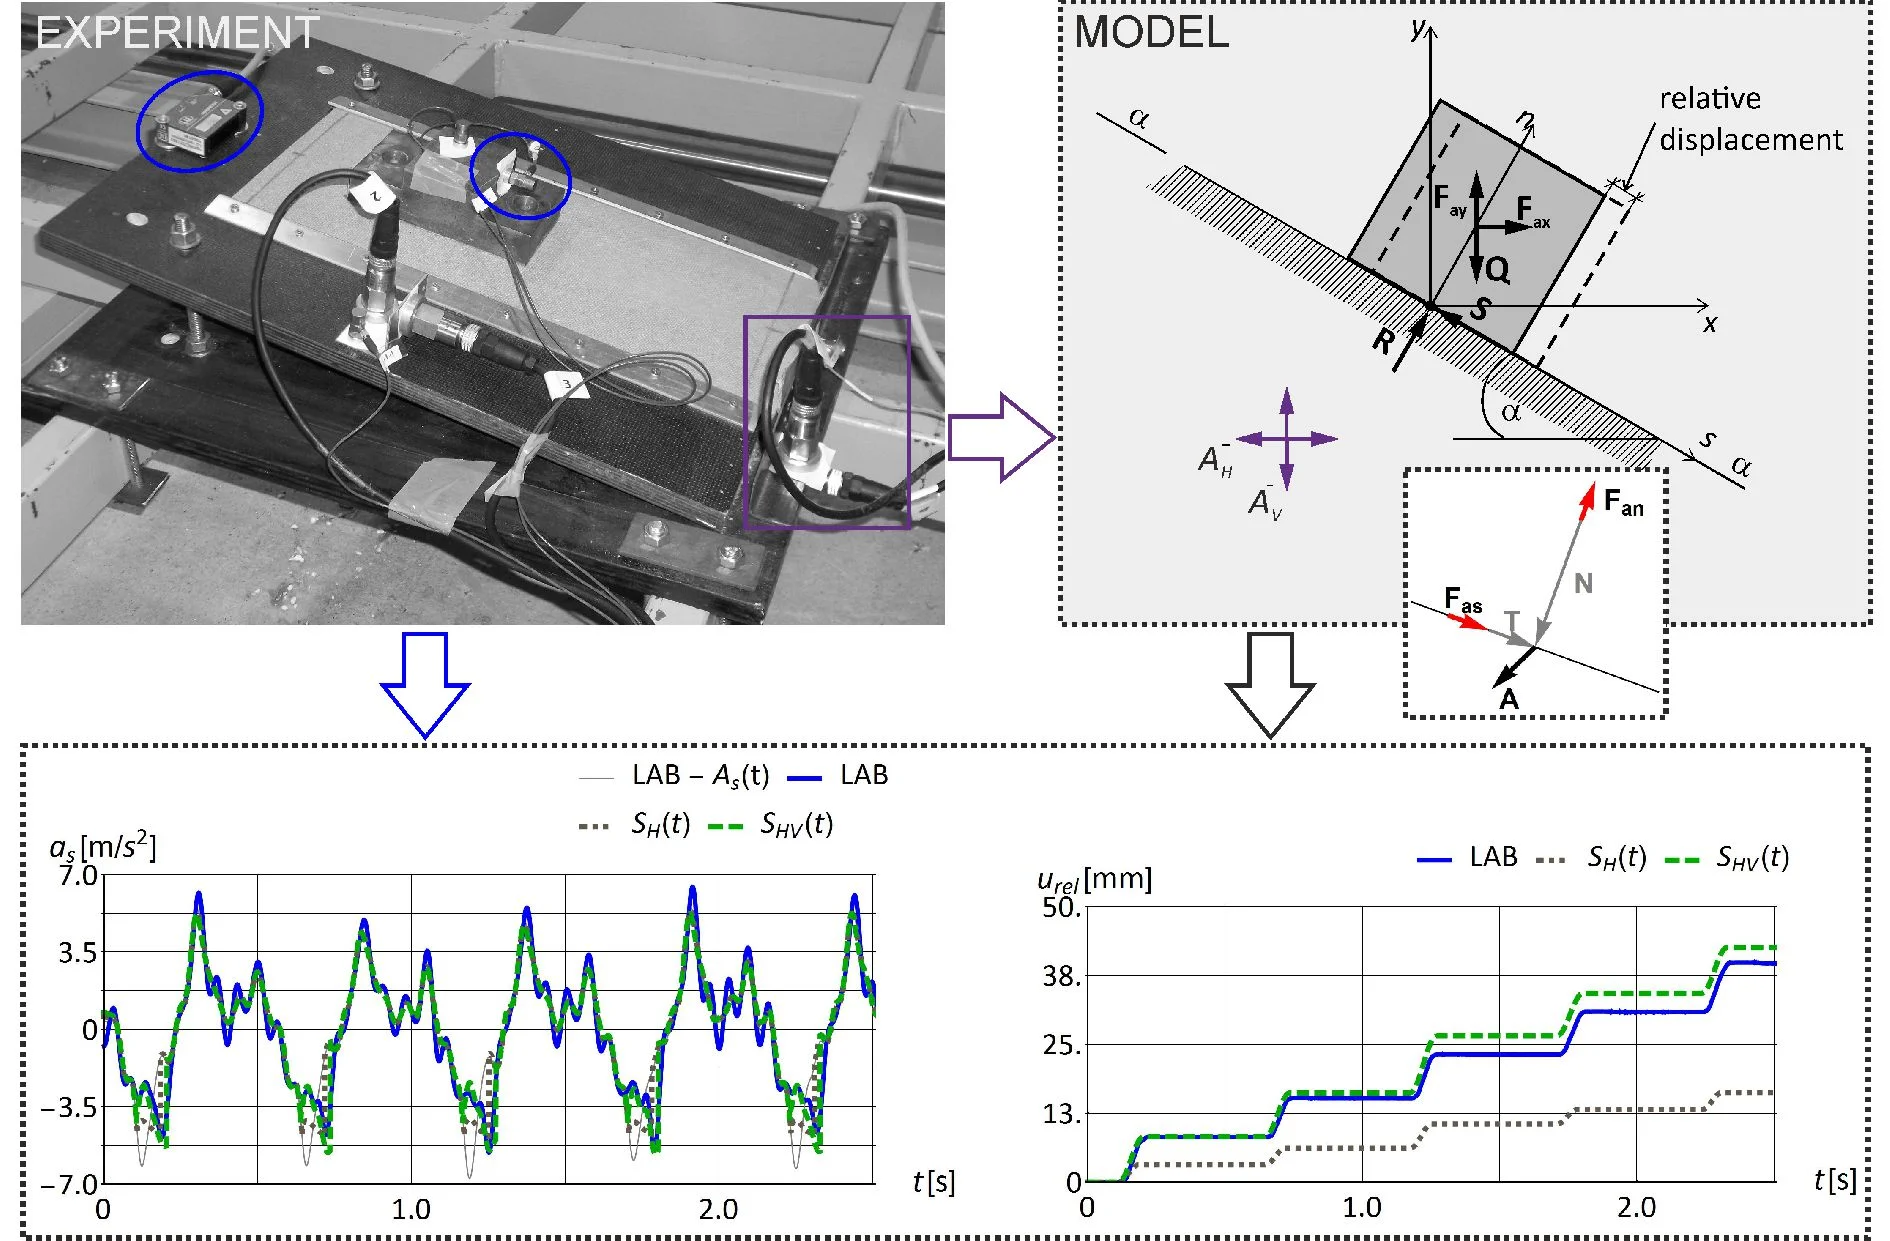
Two laboratory stands have been designed and constructed for the above-mentioned purposes. A simple oscillating device and a professional one-directional shaking table have been used. Two-directional cyclic and mono-harmonic one-directional load have been simulated during the presented testes. The original measurement system applied has revealed the origin of the relative displacement and friction behaviour during relative motion.
The arrangement of the presented paper is as follows. Firstly, the extended Newmark’s method is briefly presented. Secondly, the experimental stands are described. Thirdly, numerical and experimental results are compared, followed by the main conclusions.
2. The main assumption of extended Newmark’s method
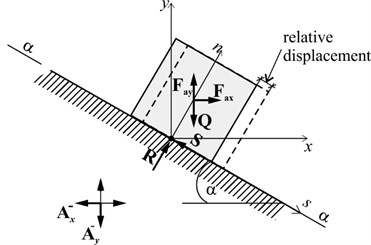
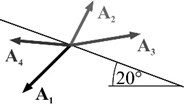
After Newmark, a simple dynamic system consisting of a rigid block resting on a rigid inclined base is analysed, Fig. 1. The horizontal and vertical acceleration time-histories are assumed to be the driving force affecting the analysed system. Such selection is consistent with the monitoring system of seismic events. According to the second Newton’s law, the dynamic loading causes the inertia forces and of the block with opposite direction to the excitation vectors. The magnitudes of these forces are calculated as the product of the block weight and the block acceleration in the horizontal and vertical direction, respectively.
Fig. 1Scheme of a simple dynamic system loaded by horizontal and vertical accelerations
a)
b)
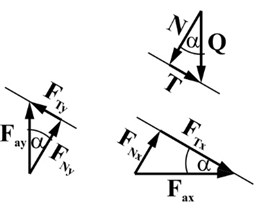
The force equilibrium equations are constructed in the local coordinate system, with axes normal and tangent to the slip surface. The inclination is denoted by angle . The driving dynamic loads are expressed as:
It is assumed that the magnitude of the normal component of driving dynamic loads does not exceed the value which can cause the separation of the system analysed, thus, the inertial force of the block in the normal direction results directly from the acceleration of the base, . The inertia force of the block in the tangent direction is determined based on the limit equilibrium equation.
The gravity force is decomposed into two components acting in the normal and tangent directions with magnitudes equal to and , respectively. The static and dynamic active forces cause the reaction of the base represented by normal and tangent component, Eq. (3), (4). In contrary to the Newmark’s approach, both reaction forces are time-dependent, because the resultant magnitude of these forces results from static and dynamic conditions. The static part includes the influence of the normal component of gravity force , whereas, the dynamic part includes the influence of normal inertia components and . Moreover, the Coulomb frictional law, characterized by a friction coefficient , is assumed for the shear resistance force. In the proposed model static and kinetic friction coefficients have been distinguished to model the friction properties at rest and after the relative motion initiation:
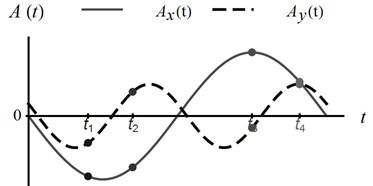
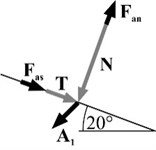
The examples of harmonic acceleration time-histories and the directions of the resultant acceleration vectors with respect to the slip surface are shown in Fig. 2. It is illustrated that the dynamic loading can both decrease and increase the resistance force. Among the four exemplary moments during harmonic excitations, the most unfavourable condition occurs in , because the inertia forces contribute to the development of an additional sliding force and reduction of the normal force by .
Fig. 2a) Horizontal Axt and vertical Ayt harmonic excitations time-histories, b) base acceleration vectors A in selected moments t (1/4), c) static (T, N) and dynamic (Fas, Fan) forces acting on the block at time t1 in the local coordinate system
a)
b)
c)
Four equations that describe the shear resistance force with respect to the direction of the driving excitations have been derived. After using appropriate trigonometric identity and signs of excitations, two conditions of the initialization of the relative motion of the block on inclined base have been formulated. For the assumed coordinate system, the positive value of relative displacement of the block is consistent with the direction of the axis (downward) and occurs when the magnitude of excitation is lower than:
The relative movement of the block upward the slope occurs when excitation magnitude exceeds:
Second-order differential equation formulated above has been substituted by a system of two first-order differential equations (velocity and displacement derivatives). Finite difference method with the time step of 0.001 s [6] has been used to solve that system of equations.
Detailed considerations and analyses of specific load cases can be found in [7, 8].
3. Description of experimental stands and materials
Verification of the assumed hypothesis has been the main goal of the experimental investigations. However, reliable verification is also associated with the verification of the assumptions of the proposed numerical model of a rigid block motion on an inclined plane. The list of specific postulates and queries investigated:
• The normal component of the platform’s acceleration is entirely transferred to the block;
• The effect of the horizontal and vertical acceleration components normal to the slip plane on resistance force;
• The effect of friction coefficient evolution on the magnitude of permanent displacement.
3.1. Slope model
A platform has been designed and constructed as a model of inclined slip plane. The top part of the platform has an adjustable inclination in the range from 0° to 30°. The base of the platform has been rigidly attached to the device generating dynamic loading. The sliding element was made of steel with rectangular base dimensions of 8×16 cm and weight of 3.815 kg. Three different types of material covering the block and platform have been used to model a different type of friction behaviour. The platform has been equipped with a mount for fixing the measurement device and materials with variable frictional properties.
3.2. Measurement devices and analysis of records
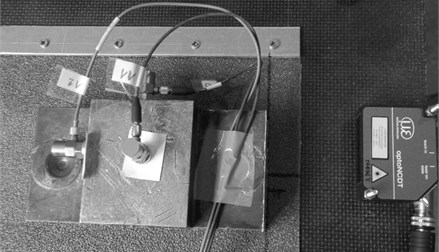
Voltage signal processing and data acquisition have been provided by the ALITEC VIMEA VE 16BCA measurement system and VIMEA SVDA v.1.1 software. The maximum voltage measurement error of the system is ±0.1 V±0.5 %. Data has been registered at a frequency of 1024 Hz. The displacement of the block and the platform have been measured with the Micro-Epsilon OptoNCDT 1302 laser displacement sensor with a measuring range of 200 mm. The frequency of recorded noise of the sensor is 0,1 Hz with mean amplitude of 47 μm. Acceleration measurements have been conducted using piezoelectric acceleration VibraSense-VS sensors, type 101.01-9, and type 352C33 accelerometers produced by PCB Piezotronics. Both sensors have the same voltage measurement range (±5 V), which means that the VS sensors with a measurement range of ±10 g are more accurate than PCB sensors with a range of ±50 g. The mean value of measured amplitudes of noises is equal to 0.008 m/s2 for VS sensors and 0.037 m/s2 for PCB accelerometers. The mean dominant frequency of recorded noises is 0.12 Hz for VS sensors and 0.05 Hz for PCB. During the auxiliary tests, it has been shown that the difference between readings from two types of accelerometers is of about 0.25 m/s2. This information is important for the proper analysis of data collected. Both types of sensors are characterized by a flat amplitude characteristics in the frequency range used in the experiment. PCB accelerators, weighing only 5.8 g and flexible wiring have ensured no impact on the block’s movement, Fig. 3.
Fig. 3PCB accelerometers and laser displacement sensor for measuring the dynamic motion of the block
Experimental data have been processed in Mathematica using self-developed codes. The magnitudes of the data processing parameters have resulted from the characteristics of the sensors and the measuring system. Parameters have been determined based on analysis of the results of various tests, e.g. noise recordings. The recorded acceleration signals have been processed by band-pass Butterworth filter of the eighth order. The cut-off frequencies have been set based on the assumption that the essential frequencies would be below 20 Hz; dominant noise frequencies recorded by the acceleration sensors; the qualitative analysis of the tangent acceleration waveforms. In most of the analysed cases, the lower cut-off frequency has been equal to 0.1 Hz. The applied limit values are in accordance with the values used in the literature for the processing of registered accelerograms [10, 11].
3.3. Dynamic loading generators
The oscillating device with manual control of the horizontal displacement motion has been used, Fig. 4. Characteristic parameters of the movement generated by that device have been determined in preliminary measurements. The maximum horizontal displacement range of the platform is 12.9 to 29.7 mm and the fundamental frequency of that movement is in the range of 1.3 to 2.8 Hz. The horizontal acceleration amplitudes range is 1.62 to 18.31 m/s2. Five settings of horizontal displacement amplitude of the platform (denoted , = 1,…,5) and six settings of the frequency of motion (denoted , = 1,…,5) have been applied in further experiments, Fig. 5. The accelerometers installed in the vertical direction have revealed significant vertical accelerations which are correlated with the horizontal one. The vertical acceleration amplitude is in the range of 0.3 to 7.06 m/s2 and its frequency is twice the horizontal direction. The mean ratio of / for all analyzed device settings is in the range of 21.9 % to 38.0 %. The maximum amplitude of transverse acceleration is lower than the amplitude of the recorded noise, thus, it does not influence the block motion.
Fig. 4System of the sensors for testing the range of the platform movement mounted to the oscillating device
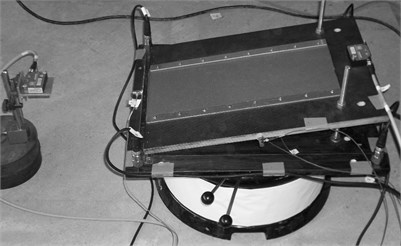
Fig. 5Manual settings of the oscillating device
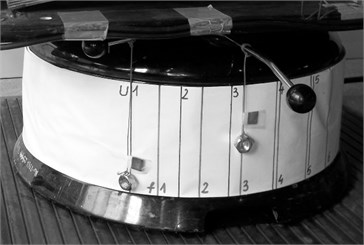
Fig. 6The platform equipped with sensors in test of relative movement of the block subjected to the horizontal excitation
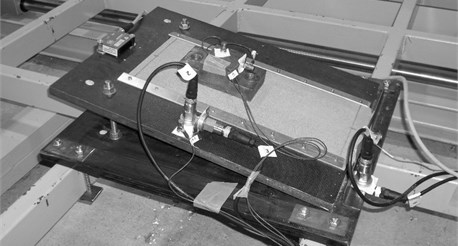
In the second stage of the experimental study, a professional one-directional shaking table (see [12, 13] for details concerning its parameters) located at the Gdańsk University of Technology has been used, Fig. 6. The table is equipped with the electric Parker ET125 dynamic actuator. The actuator is controlled by PC function generator PCSGU250 by Velleman. Control parameters are: frequency or time series of velocity scaled to 1 and velocity scaling factor . Maximum simulated peak horizontal acceleration was equal to 10 m/s2. The frequencies of mono-harmonic acceleration simulated during the experiments were in rage from 1.3 to 2.5 Hz.
3.4. Strength properties of the sliding plane
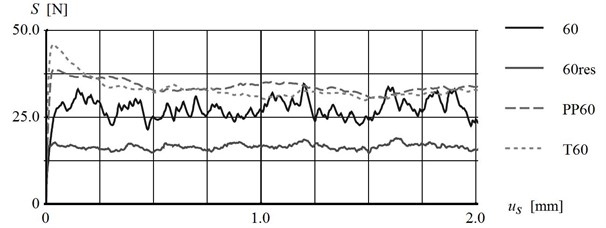
Three materials have been used to model various friction properties between the platform and the block: corund paper with three grain sizes: 40, 60 and 100, fiberboard (PP) and cardboard (T). It was assumed that fiberboard – corund paper contact can model the behaviour of cohesive soils or highly compacted non-cohesive soils, the strength of which drops to the residual value after reaching the limit state. On the other hand, corund paper-corund paper interface can model the behaviour of loose soil. Experimental results presented in Fig. 7, show the relation between friction force and the block displacement determined for different combinations of contacting materials which have been used to calculate the static and kinetic friction coefficients. The static friction coefficient is determined based on the maximum shear force before the block movement, however, the kinetic friction coefficient is calculated based on the mean magnitude of forces registered during the relative motion of the block (0.25 mm to 2.0 mm). The accurate identification of frictional properties of interfaces is essential for the reliable comparison of numerical results with experimental data. For instance, the mean static friction coefficient equals 0.84±7.1 % and kinetic friction coefficient equals 0.9±5.2 %. These values have been determined for the contact type 60 based on seven independent tests.
It is obvious that shearing causes the degradation of the materials used. In order to provide reproducible experimental conditions, the contact materials were exchanged between subsequent experiments. However, due to time constraints, some tests analysed have been carried out for residual frictional properties (e.g. 60res) or after number of tests performed (e.g. 60N20).
Fig. 7Friction force evolution against displacement of the block in friction coefficient tests
4. Results
4.1. Basic experiments
The results presented in this section have been obtained for platform inclination of 9.93° and interface type 60 subjected to two-directional dynamic loading generated for device settings U3f3. The platform dynamic loading has been characterized by platform displacement amplitude equal to 24.1 mm and frequency of 1.97 Hz. The recorded horizontal and vertical acceleration amplitudes have been equal to 7.27 m/s2 and 2.28 m/s2, respectively. The first five cycles of dynamic loading and block behaviour during the load have been analyzed. The beginning and the end of the cycle have been determined based on the horizontal displacement of the platform.
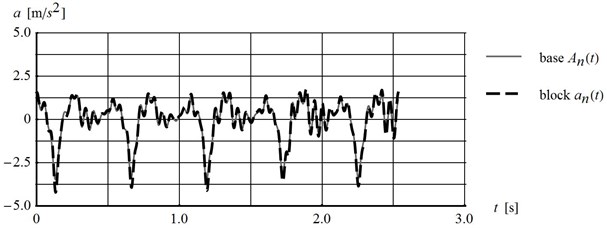
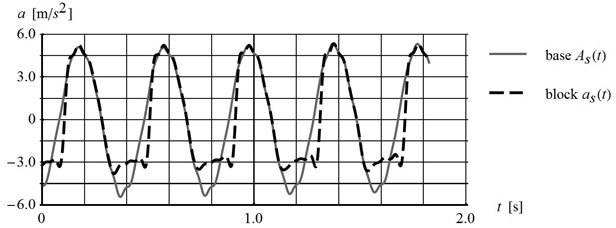
First of all, the hypothesis regarding the equality of the block and platform accelerations components normal to the slip plane has been proved. Comparison of the normal component of acceleration time histories of platform and block is entirely transferred to the block which proves the validity of the assumption, Fig. 8(a).
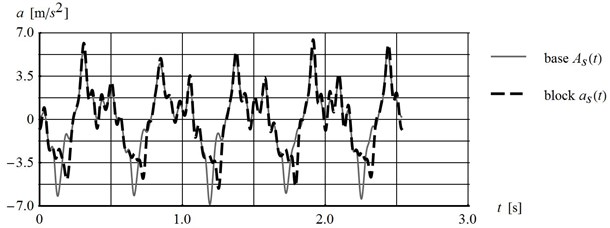
Comparison of the tangent component of acceleration time histories of platform and block gives the evidence that there is a limit in transferring the tangential acceleration of the platform to a block which is related to friction properties of the interface, Fig. 8(b).
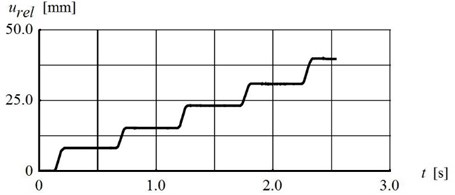
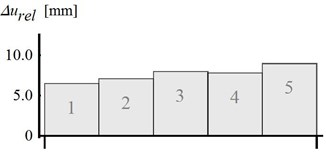
When the acceleration of the platform exceeds the critical value, the relative motion of the block begins. The relative displacements are cumulated until the relative velocity of the block is equal to 0. The relative displacement time-history of the block and its subsequent increments are shown in Fig. 9. Due to the randomness of the motion and frictional properties of the contact, three parameters describing the relative displacement have been analyzed: the increment of the relative displacement in every cycle , the mean value of relative displacement in one cycle and the relative displacement cumulated after five cycles . In the test analyzed, the mean value of relative displacement in the cycle was equal to 7.66±12 % and the relative displacement cumulated after five cycles was equal to 38.3 mm.
Fig. 8Comparison of the platform and the block: a) normal Ant and ant, b) tangent Ast and ast acceleration component recorded during dynamic loading U3f3, platform inclination 9.93° for the interface type 60
a)
b)
Fig. 9a) Time-history, b) subsequent increment of the block relative displacement (parameters given in Fig. 8)
a)
b)
4.2. The effect of the frictional coefficient on the dynamic behaviour of the block
The frictional properties of the contact are of key importance to the block behaviour during dynamic loading. Thus, the tests aimed also at determining the influence of the friction coefficient on permanent block displacement, which is understood as the change of the coefficient of friction before and after initiation of the relative motion. The presented results have been obtained for platform inclined by 10.1° subjected to cyclic horizontal dynamic loading with frequency of 2.5 Hz and amplitude of 8.87 m/s2 and 5.66 m/s2, respectively. Laboratory tests of the types of contact applied: PP60 and 60N20 have shown that, in the first case, there is a clear decrease in resistance forces after the initiation of movement, while in the second one, there is a fluctuation around a value slightly lower than the maximum value (compare Fig. 7). The static friction coefficient of contacts determined in laboratory tests is equal to 1.24 and 0.61. The kinetic friction coefficient of contacts applied is 1.02 and 0.55, respectively. A convincing illustration of the influence of the friction coefficient evolution on the behaviour of the dynamic system is given in Fig. 10.
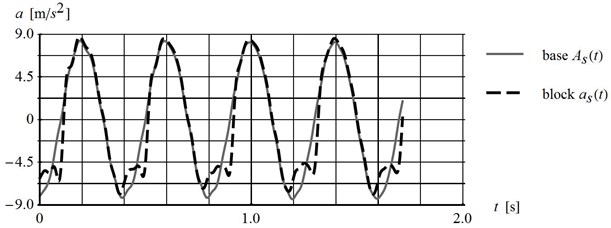
The comparison of the tangent component of the platform and block acceleration time-history for two types of contact have shown different behaviour of the block subjected to horizontal dynamic loading. Acceleration of the block clearly decreases for PP60 contact, whereas it decreases only slightly for 60N20 contact.
Fig. 10Comparison of platform and block tangent acceleration time history for platform inclined by 10.1°, subjected to horizontal harmonic loading with 2.5 Hz and interface type: a) PP60, b) 60N20
a)
b)
One-directional shaking table and simple harmonic motion have given the opportunity to investigate the effect of horizontal acceleration component normal to slip surface plane on the dynamic behaviour of the block. The above-presented results confirm that influence. Firstly, in both cases, the relative movement has been initiated for the absolute value of tangent base acceleration lower then Newmark’s yield acceleration equal to 10.3 m/s2 and4.2 m/s2, respectively. Secondly, normal components of horizontal acceleration have affected the block acceleration, clearly noticeable in the final phase of the relative motion when the horizontal acceleration of the platform changes the direction (see Fig. 10).
4.3. Effect of the vertical acceleration component normal to slip plane on the dynamic behaviour of the block
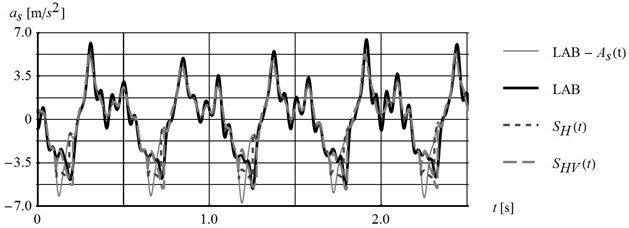
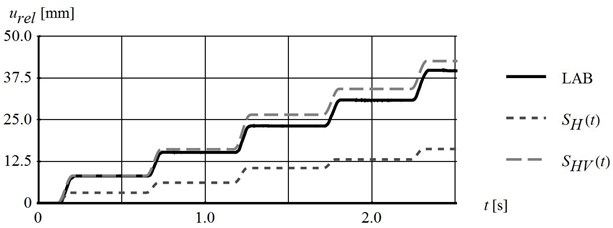
Demonstration of the effect of vertical acceleration on the block behaviour has been the main purpose of the experiments conducted. The comparison of the experimental data and numerical results has been considered as the most convenient way to present the above-mentioned impact. The developed numerical model allows testing of all of the aspects separately. Here, the horizontal impact , and both horizontal and vertical accelerations , impact on shear strength are compared. The results presented here have been recorded for platform inclined by 9.93° subjected to cyclic two-directional loading generated by device settings U3f3 (the same as presented in Section 4.1) and the contact type 60. The static friction coefficient adopted in calculation is equal to 0.78 and kinetic friction coefficient is 0.9. It is the lower estimate of static friction coefficient determined in laboratory tests. The qualitative comparison of the recorded and calculated tangent component of block accelerations have confirmed the impact of vertical excitation on the critical acceleration magnitude and dynamic behaviour of the block during relative motion, Fig. 11(a). The recorded platform acceleration along the slip plane direction is also shown on the graph for better visualization of the moment of relative motion initiation. The comparison of relative displacement time-history recorded during the experiment (LAB) and calculated based on recorded accelerations have shown good agreement for the case of horizontal and vertical acceleration impact on shear strength, Fig. 11(b).
The value of permanent displacement of the block cumulated after five cycles assuming only horizontal excitation impact on shear strength, calculated by Newmark’s extended method, is 16.3 mm and is 57.4 % lower than the values measured in the laboratory.
Fig. 11Comparison of: a) block tangent acceleration time-histories, b) of block relative displacement time-histories recorded (LAB) and calculated for the shear strength influenced by horizontal and both horizontal and vertical platform excitations (parameters given in Fig. 8)
a)
b)
5. Conclusions
The assumed hypothesis that the vertical excitation can influence the risk of destabilization of the earth structures has been proved by experimental tests. Moreover, the negative impact of the vertical acceleration has been clearly illustrated and proved by numerical results carried out by extended Newmark’ method. Numerical results have been positively verified for mono-harmonic one-directional motion and cyclic two-directional motion.
In experiments conducted under cyclic loading, the impact of the vertical acceleration on the permanent displacement of the block has reached 57 %. However, in general, the exact magnitude of this impact depends on many factors, such as the vertical to horizontal peak ground acceleration ratio or frequency range of vertical component of the earthquake. Nevertheless, in case of significant vertical dynamic loading, the extended Newmark’s method should be used.
A significant influence of the evolution of the friction coefficient on the block behaviour during dynamic loading has been found during laboratory tests. Good agreement of the numerical results obtained by extended Newmark’s method, that distinguishes the static and kinetic friction coefficient with experimental results have been shown.
The extended Newmark’s method increases the accuracy of the description of dynamic response of the dam but still include some constraints, e.g. rigidity of the soil model. Further research, with use of time-domain nonlinear finite element method, is planned to be conducted so as to reveal the accuracy of the model.
References
-
Jibson R. W. Methods for assessing the stability of slopes during earthquakes – a retrospective. Engineering Geology, Vol. 122, 2011, p. 43-50.
-
Sica S., Santucci de Magistris F., Vinale F. Seismic behavior of geotechnical structures. Annals of Geophysics, Vol. 45, Issue 6, 2002, p. 799-815.
-
Design of Structures for Earthquake Resistance. Eurocode 8, 2005.
-
ICOLD Selecting Seismic Parameters for Large Dams. Guidelines (Revision of Bulletin 72). Bulletin 148, 2010.
-
Nemark N. M. Effects of earthquakes on dams and embankments. Geotechnique, Vol. 15, Issue 2, 1965, p. 139-160.
-
Sawicki A., Chybicki W., Kulczykowski M. Influence of vertical ground motion on seismic-induced displacements of gravity structures. Computers and Geotechnics, Vol. 34, 2007, p. 485-497.
-
Korzec A. Effect of the Vertical Seismic Accelerations on the Stability of Earth Dams. Ph.D. Thesis, Institute of Hydro-Engineering, Polish Academy of Sciences, 2016.
-
Korzec A. Effect of the vertical seismic accelerations on the stability of earth dams. Archives of Hydro-Engineering and Environmental Mechanics, Vol. 63, Issues 2-3, 2016, p. 101-120.
-
Sawicki A., Chybicki W. Horizontal motion of a rigid block resting on accelerating subsoil. Archives of Hydro-Engineering and Environmental Mechanics, Vol. 52, Issue 2, 2005, p. 147-160.
-
Darragh B., Silva W., Gregor N. Strong motion record processing for the PEER center. Invited Workshop on Archiving and Web Dissemination of Geotechnical Data, 2004.
-
Massa M., Pacor F., Luzi L., Bindi D., Milana G., Sabetta F., Gorini A., Marcucci S. The Italian accelerometric archive (ITACA): processing of strong-motion data. Bulletin of Earthquake Engineering, Vol. 8, 2010, p. 1175-1187.
-
Falborski T., Jankowski R. Experimental study on effectiveness of a prototype seismic isolation system made of polymeric bearings. Applied Sciences, Vol. 7, Issue 8, 2017, p. 808.
-
Falborski T., Jankowski R. Advanced hysteretic model of a prototype seismic isolation system made of polymeric bearings. Applied Sciences, Vol. 8, Issue 3, 2018, p. 400.
About this article

