Abstract
The technique of determining the pavement layers strength are given. The results of a field (on the road) testing of asphalt concrete Highway pavement using georadar vibration-acoustic set of equipment are presented. The hardware complex is proved and developed for the automobile roads express-control. Functioning of hardware complex and technique for pavement layer durability definition are described. The ways of the further perfection for the georadar vibrating-acoustic technology are considered.
1. Introduction
One of the main and most important features of road traffic safety is the road quality. To control the quality of highways today, the technology of measuring cracks on asphalt surface, based on the definition of photometric data [1-3], has become widespread. In this technology laser crack control methods are widely used as the most accurate [4, 5]. To automate the process of photometric and laser measurements, methods are used and devices are improved for the accumulation and automatic processing of results [6-9]. The functionality limitation of this technology is to obtain the quality characteristics of the road on the surface only.
A wider development for quality control of roads was obtained by GPR methods and control devices, which allow to determine not only cracks on the surface, but also the geometric dimensions of both the general structure and the individual layers of road surfaces [10-13]. Among GPR methods, multifunctional georadar development has become widespread, allowing, along with the surface quality of highways, to determine the thickness of their coatings, the dielectric constant of both layers of pavements and subsurface soils [14-17]. Among such developments, GPR methods and devices for determining the dielectric coefficients and the layered structure of the lunar soil should be highlighted, which also can be used to determine the quality of highways [18, 19]. The main limitation of GPR technology is that the equipment provides for the measurement of only the geometrical parameters of the pavement layers and the presence of heterogeneities in the layers.
To determine the quality of roads, is also used a technology to determine the surface roughness of roads, based on the simultaneous method of collecting data from a GPS navigator and measuring accelerometer when scanning a road from a moving vehicle [20, 21]. The disadvantage of this technology is the applicability only to the surface of the road.
Acoustic and ultrasonic measurement methods are used to determine the strength of road pavements, since the acoustic waves propagation speed in road pavement layers is related to their strength characteristics [22-24]. The main limitation in the application of the acoustic method measurement is the impossibility of road internal layers strength determining.
Analyzing all the methods and devices used to determine the quality of roads, we note that there is no fast and affordable express control measuring method of the pavement layers strength characteristics, while simultaneously recording the presence of voids, water inclusions, heterogeneous, internal damage, etc.
Based on the above, this article aims to show a methodical and technical solution that combines the advantages of georadar and acoustic methods of highways quality control. The basis of the work was carried out theoretical and experimental studies of a new method proposed by the authors for measuring vibration parameters in pavement layers by registering radar signals reflected from borders and road environment inhomogeneities by the GPR receiving path. Field tests of the developed experimental equipment prototype were carried out, which confirmed that the synchronous detection of received radar signals relative to the probing reference impulses allows, in a non-contact way, to measure vibration propagating in the multilayer structure of the road. A distinctive feature of the proposed technique and the developed equipment is the possibility of choosing the depth of received radar signals modulated by vibration-acoustic oscillations propagating in the pavement layers being studied, which makes it possible to measure the strength characteristics of the pavement layers.
2. Physical essence of the georadar vibration-acoustic method
The physical essence of the proposed vibration-acoustic georadar technology for determining the strength of road layers is based on combined application of georadar and acoustic methods, and the combination includes the advantages of georadar and the dignity of vibration-acoustic methods. This allows a non-contact determining the strength characteristics of each layer of the road.
The physical essence of the developed georadar vibration-acoustic method functioning was investigated. The studies show that the electromagnetic wave modulation is caused not only by an instantaneous vibration-acoustic displacement of the pavement layers’ boundaries but also by the medium density fluctuation which, in turn, causes alternating changes in dielectric permeability of pavement material under the influence of vibration-acoustic oscillations. Thus, the physical essence responds to two processes: contributing the boundary medium perturbations and contributing the modulation of its density, and, therefore, the dielectric permeability [22].
3. Theoretical frameworks of the georadar vibration-acoustic method for pavement strength control
The main parameter characterizing the strength of building materials of the pavement clothes is an elasticity modulus or Young’s modulus [5]. Therefore, the initial formulas for the developed algorithm of georadar vibration-acoustic method for pavement strength control are:
where: – vibration-acoustic wave velocity, – material density.
To confirm the validity of the Eq. (1), a preliminary comparative analysis of the measurement of acoustic velocity and material density with the results of a laboratory analysis of elasticity modulus was carried out. It was found that the Eq. (1) characterizes in direct dependence the strength of material that is part of the pavement structure.
To determine the elasticity modulus using the georadar vibration-acoustic set of equipment in each pavement layer, it is necessary to measure the acoustic wave velocity . This requires determination each layer thicknesses , , , …, and measurement acoustic wave propagation time in each layer. With that in mind, the basic sequence of implementation the algorithm is as follows: time marks , , , …, corresponding to the PL boundaries are measured by radar equipment and compiled. According to the received marks, the PL thicknesses , , , …, are determined:
The thickness values in Eq. (2) are expressed in centimeters, the time values – in nanoseconds, and is the dielectric permittivity value of the corresponding layer.
Then, acoustic wave propagation time in each th controllable layer is determined in the mode of analysis the amplitude variation in the radar signal reflected from each pavement layer:
In Eqs. (3), (4) the values , , , …, are the acoustic wave velocity in the first, second or th layer:
On this evidence, in accordance with Eq. (1) the elasticity modulus is calculated in each pavement layer.
The advantage of the proposed method is that the vibration-acoustic layer fluctuations are periodic with numerous repetition of oscillation periods after arousing impulse influence, for example, from passing vehicles. Proceeding from this, it is useful to accumulate signals by measuring and recording vibrational spectrum of pavement layers by means of applying the Fourier periodic signal transform function. Therefore, on the basis of Eq. (4) and taking into account the fact that the resonance frequency of each layer is inversely proportional to the double vibration-acoustic signal propagation time by simple transformations one can obtain:
Finally, the formulas for determining the pavement layers’ strength on the basis of Eqs. (5) and (1) becomes:
Confirmation of the periodicity of PL vibration-acoustic oscillations during their periodic pulsed excitation can be obtained from the results of generated computer simulation which is given below.
4. Generated computer simulation of vibration-acoustic oscillations of the pavement layers at their impulsive excitation
In order to optimize development of the equipment for studying the process of acoustic signals propagation in a layered pavement medium, the COMSOL finite element analysis software package was applied [25]. The geometric model of the roadway platform consists of three layers: two layers of asphalt and a crushed-stone base. The indicative reference physical and mechanical specifications of the layers are presented in the Table 1.
Table 1The indicative reference physical and mechanical specifications
Layer type | Layer thickness [m] | Density [kg/m3] | Elasticity modulus [MPa] | Poisson’s ratio | Acoustic velocity [m/s] |
Dense asphalt | 0,1 | 2400 | 4500 | 0,25 | 1369 |
Porous asphalt | 0,2 | 2000 | 1600 | 0,25 | 895 |
Crushed gravel | 5,7 | 1800 | 450 | 0,25 | 500 |
The source of the vibration-acoustic pulse is located at the origin point on the surface of dense asphalt with a radius of 0.05 meters. The simulation result is an analysis of the transient process in a layered medium for 7×10⁻³ sec. The excitation source of the acoustic impulse imparts an acceleration of 2354 m per on the surface area 25 cm2 of the roadway platform at the initial time. The graph of the amplitude and duration of the vibration-acoustic excitation pulse of a layered medium is shown in Fig. 1.
Fig. 1Excitation pulse
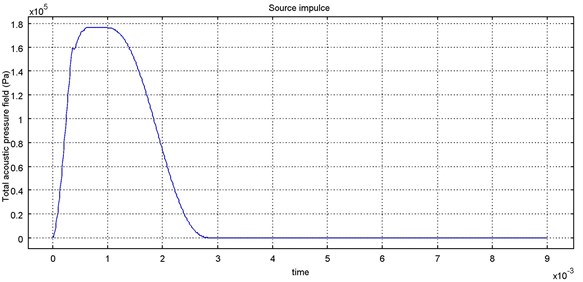
Fig. 2Transient process in a layer of dense asphalt at the control points at 1, 2, 3, 4 and 6 meters from the excitation source
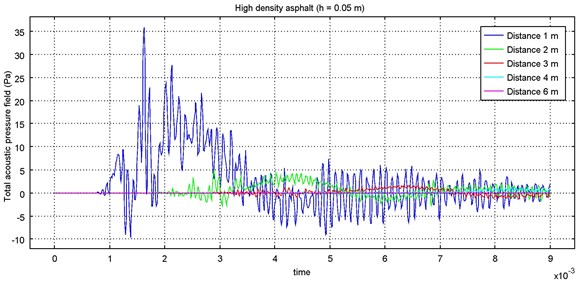
Fig. 3Transient process in a layer of porous asphalt at the control points at 1, 2, 3, 4 and 6 meters from the excitation source
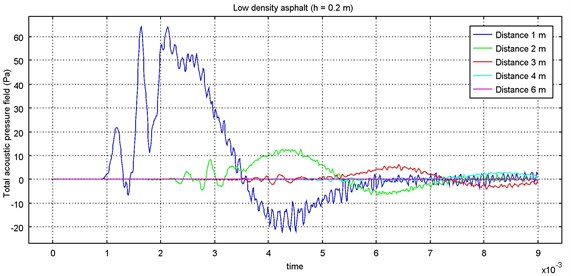
Figs. 2 and 3 shows the graphs of the transient processes of propagation the acoustic pressure at the control points inside the layers of the modeled medium.
The analysis of the obtained modeling data shows that each specific layer of the medium highlights from the broadband excitation pulse the oscillations with a frequency that corresponds to the geometric and physical specifications of the layer and, among other, the components of vibration-acoustic oscillations associated with the strength characteristics of the layers are indicated.
On the basis of computer modeling for specific pavement structures, the functional scheme of the developed hardware system is optimized with the allocation of resonant vibration-acoustic oscillations in accordance with Eqs. (5) and (6) which allows to obtain reliable results of determining the PL strength.
5. Hardware implementation of the georadar vibration-acoustic set of equipment
The hardware complex is represented by an antenna and a measuring unit. The Fig. 4 shows the structural block-diagram of the prototype hardware. Antenna unit 1 comprises a horn sending antenna 1A and a horn receiving antenna 1B. Both antennas are identical, their function follows from their name, and the design provides high energy efficiency, a narrow directivity diagram and a low level of phase dispersion required for receiving broadband impulse microwave signals.
Fig. 4Structural block-diagram of the georadar vibration-acoustic set of equipment
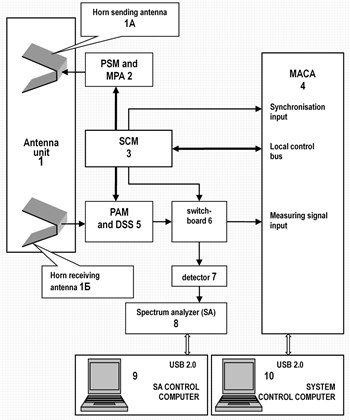
The measuring unit contains the correspondingly connected pulse shaping module and microwave power amplifier (PSM and MPA) 2, the synchronization and control module (SCM) 3 of the measuring unit, the module of the analog-to-digital converter of the high-frequency signals (MACA) 4, the programmable amplifier module and the device for sampling and storage of microwave signals (PAM and DSS) 5. In addition, the measurement unit includes an RF-signal switch-board 6, a RMS RF-signal detector 7, a spectrum analyzer of the detected RF-signals 8 (SA), a spectrum analyzer control computer 9, a hardware complex control computer 10.
The pulse shaping module and microwave power amplifier have the functions:
• Formation of the probe pulse delay relative to the sync signal front of the DSS module 5. The delay value is calculated in the hardware complex control computer 10 at executing the applied software procedures and as a control code for the programmable devices of the module is sent and stored in the SCM module 3:
• Formation of a probe pulse in the form of an envelope of one frequency period –1.3 GHz;
• The probe pulse amplification to the power level required to perform georadar measurements of pavement layers.
SCM module 3 contains a timing SHF-generator with a PLL to synchronize the operation of the equipment devices and a frequency divider with a pre-set dividing factor to set the duration of the time interval for recording the reflected signal from the probe signal layers. In this case, the SCM module 3 receives, stores and translates the control codes and mode selection signals from the computer 10 to the control inputs of the programmable microwave devices of the PSM and MPA module 2 and the PAM and DSS module 5.
The purpose of the module is:
• Receive and storage of codes for setting the gain level of the input microwave signal from the horn receiving antenna 1B for the programmable amplifier of the module 5;
• Synchronization of the capture moment of input RF/microwave-signals for the MACA module 4 and the DSS module 5, respectively;
• Reception, storage and translation of installation codes for controlling the moment of probe pulse emission in PSM and MPA module 2.
MACA module 4 has a USB 2.0 interface for communication with the hardware complex control computer 10, a local communication bus with the SCM module 3, a synchronisation input for sampling the measurement signal and provides:
• AD-conversion of signals from the horn receiving antenna 1B which became possible due to the reception and capture of microwave sounding signals reflected from the pavement layers in the DSS module 5;
• Measurement data sets transfer via the USB 2.0 interface to the hardware complex control computer 10 for processing by the algorithms of the installed application software (IAS) and subsequent visualization in the GUI;
• Control signals and installation codes transmission by the local bus to the SCM module 3 for programmable devices in the hardware configuration at executing the software commands and procedures.
The MACA module 4 as well as the spectrum analyzer 8 are based on a digital oscilloscope-attachment with an external USB 2.0 interface. In this case, the first digital oscilloscope has an additional option – a local control bus, and the second one is programmed for operation in the spectrum analyzer mode.
The switch-board 6 depending on the selected operating mode and the control signal from the SCM module 3 translates the output signal of the DSS module 5 either to the signal input of the MACA module 4 or to the input of the spectrum analyzer 8. In this case, the hardware complex operates as a georadar (signal from the DSS module 5 goes to the MACA module 4 with the subsequent data processing in the hardware complex control computer 10) or as a strength characteristics calculator (the signal from the DSS module 5 is sequentially processed by the detector 7 and the spectrum analyzer 8 under the control of the spectrum analyzer control computer 9).
The main task of the measuring unit is to adapt the relatively large (–1 ns) time of signal digitization in the ADC measuring block to the required ultra-small (–50 ps) sampling time of the measured RF-signal. This problem is successfully solved with the usage of the above-noted circuit of the storage sampling amplifier (SSA) and the synchronization methods of the measuring and RF-blocks.
In operating principle, the structural block-diagram of a georadar vibration-acoustic set of equipment is a high-speed radio-location measuring device – a georadar with high-resolution to the time of discretization the radar signals reflected from the pavement layers. The basis of the method is georadar vibration-acoustic measurements. Radiolocation measuring method is very sensitive and perceives not only the geometric dimensions of the structural layers but also the vibration-acoustic oscillations of their structure. Therefore, the basis of the developed technique is a radar or georadar method optimized for pavement layers. The usage of vibration-acoustic oscillations with the application of their detection by radar signals is essentially intended in accordance with the above Eqs. (5) and (6) for the precise determination the elastic (strength) characteristics of the inner pavement layers related to the reliability and road safety.
6. Sequence of operation of the georadar vibration-acoustic set of equipment
The algorithms for the equipment operation were carried out in the following sequence. In real-time sequentially at each measurement point with a frequency of 40×106 samples per second, a radio-location signal trace was recorded. These traces were accumulated in the controlling computer memory in the form of a radargram that were also displayed in the software view window. Then the software processed the results.
In accordance with adjustment the levels of radar signals reflected from the layers’ boundaries, the time marks , , , …, corresponding to the specified boundaries of the pavement layers were formed programmatically at the radargram scale. Under the received marks in accordance with the operating procedure and with the order of computational algorithms realization [refer to the above-mentioned Eqs. (2) and (3)], the pavement layers’ thicknesses , , , …, were determined. The thickness of each layer was further refined by the method of automatic search of “observation points”, each of which characterizes the total propagation time of the electromagnetic signal along the path “emitted antenna – layer boundary – receiving antenna”. For an “observation point” corresponding to the exact coincidence the time of propagation of the reflected electromagnetic signal from the boundary between the pavement layers, an increase in the level of the reflected radiolocation signal was recorded, resulting in accurately determination the pavement layer thickness with corrected for the dielectric and magnetic permeability of road pavement materials. After the selected points determination, the georadar equipment was automatically or by an external control signal transferred to the mode of analyzing changes in the amplitude of the signal at each selected point. Time-based detection (or the signal changes timing) corresponds to the acoustic wave propagation times in each monitored layer. The algorithms for the precise determination of propagation times were supported, as mentioned above, by the functions of forward and inverse Fourier signal transform. Due to the continuous averaging of the measured values in the frequency spectrum domain, it was possible to obtain more reliable and refined results of measurements of signal propagation times in the pavement layers in accordance with the formulas [refer to direct and inverse transitions from Eq. (3) to Eq. (5)]. Based on the results of frequency and time measurements for each selected point, the acoustic wave propagation velocity in the first, second, third and th layers were programmed. In accordance with the algorithms given above in Eqs. (2)-(6), the current strength values of the pavement layers were calculated and determined.
7. Test procedure
During tests in laboratory conditions the road sample was represented by a 75 cm×85 cm asphalt slab and in actual conditions the area under investigation was selected on the Henan Province roads [highways in the Xin-Xian City region (PRC)] from the conditions of ensuring the maximum possible level of tests safety.
In accordance with the procedure described above, which is involved in the implementation of measurement algorithms according to Eqs. (2)-(6), in the hardware, in order to increase the reliability and efficiency of measurements, as mentioned above, a more efficient method of representing signals in the frequency form by implementing the function of direct Fourier transform of signals was applied. This method, due to continuous averaging of the extracted signals in narrow bands of the frequency spectrum, provided to obtain more reliable and refined measurement results in specific frequency values, in terms of equal time signals distribution in the pavement layers in accordance with the Eq. (3). To do this, the investigated sample of the slab or road surface was resonated with a short shock pulse and a digital oscilloscope was triggered by the pulse of synchronization. The oscilloscope recorded resonant vibration-acoustic oscillations of the road structure by means of the Fourier transform function. The resonance frequency and thickness were used to determine the velocity of vibration-acoustic oscillations propagation in the asphalt-concrete slab in accordance with Eq. (5). Further, in accordance with Eq. (6), the elasticity modulus was determined.
In order to independently determine the elasticity modulus of the asphalt-concrete slab, a comparative laboratory analysis method was used by determining the elasticity modulus with respect to the ultrasound propagation velocity in the slab followed by a module refinement for the slab material density.
During tests in full-scale conditions each layer thickness was determined by the method of scanning the “observation points”, each of which characterizes the total propagation time of the electromagnetic signal along the path “emitted antenna – layer boundary – receiving antenna”. For the “observation point” corresponding to the exact coincidence of the time of propagation of the reflected electromagnetic signal from the boundary between the pavement layers, a sharp increase in the level of the reflected radar signal was observed. This made it possible to accurately determine the pavement layers’ thickness corrected for the dielectric penetrability of the road pavement material. The density of this or that layer was defined as a tabulated quantity in accordance with the sound propagation velocity in the layer (see the above-mentioned Table 1).
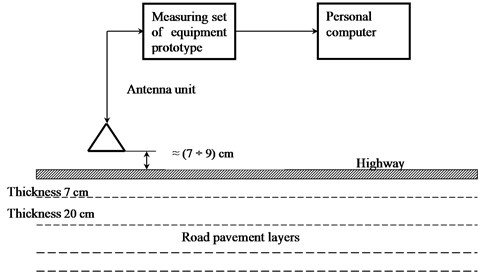
Fig. 5 shows a schematic diagram of the research carried out on the road using the developed hardware complex prototype of a georadar vibration-acoustic set of equipment.
Fig. 5Block-diagram of full-scale tests for pavement material strength with a georadar vibration-acoustic set of equipment
8. Experimental results of pavement strength express-analysis
The characteristics shown in Figs. 6-11 are obtained by shaping the spectrum from the rms power detector signals of the RF signals with a successive selection of “observation points” corresponding to measurements from the upper boundary to the lower layer of pavements. Thus, the measuring complex can be considered as a virtual “vibration sensor” placed at any selected point in the pavement layers. The location of the “observation point” in depth is set using the software of the system control computer, and the signal processing of the virtual “vibration sensor” is set using the software of the spectrum analyzer (SA) control computer.
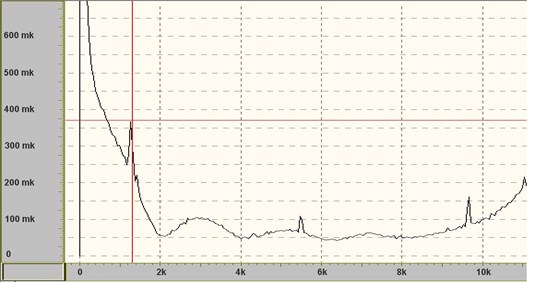
Fig. 6 shows a complex spectrogram of all self-induced vibrations of pavement of Henan’s road [highways in the Xin-Xian City region (PRC)]. The spectrogram was obtained by extracting and detecting a radar signal corresponding to the total time of propagation of the direct and reflected signal from the pavement layers’ boundaries. The given spectrogram is a frequency spectrum of amplitude oscillations and characterizes the basis for operating of the developed georadar vibrational-acoustic set of equipment prototype. The lowest spectrum component has a resonant frequency in the range of 1.36 kHz corresponding to the main resonant frequency of the pavement as a whole. To increase the measurements accuracy, the spectrum formation onset was carried out by a vibration-acoustic impulse of external excitation caused by a passing car or shock mechanism, at the first negative drop, which allowed obtaining accurate data about the resonances of the pavement structures. Such a technique applies to other spectrograms obtained for the boundaries of different pavement layers (see the Figs. 7, 8).
Fig. 6Complex spectrogram of all self-induced vibrations of a particular road pavement sample. The spectrogram was obtained by georadar vibration-acoustic method
As mentioned above, the algorithm of rapid automatic search of “observation points” for finding the maximum of reflected signals provides more accurate determination the pavement layers’ boundaries. This, in turn, in accordance with equations (2), provides a precise definition of the layer thickness between the boundaries and, as a result, contributes to obtain a high accuracy of measurements to determine the pavement layers’ strength. As an example of function the finding of maximum modulation of the radar signal corresponding to one or another layer of the road pavement, the Figs. 9, 10 and 11 show spectrograms of the natural oscillations of the road pavement for various “observation points”. In particular, the Fig. 11 shows the amplitude of oscillations for the “observation point” No.204-245 μV – the maximum. This provided determination the thickness of the upper pavement layer by the equation:
See the Eq. (2). The same method determines the thickness of the middle pavement layer. Based on the obtained spectrograms for the top pavement layer, the natural frequency is 9672 Hz (see the Fig. 7). Based on the results of georadar measurements with a repetition frequency of 40 MHz, the result of the average values of the upper layer thickness was: 7.0 cm. Accordingly, the acoustic wave velocity in this road layer in accordance with (7) is equal to: 1354 m/s.
On the basis of this, the elasticity modulus for the upper layer is respectively equal to: 2380⋅1354⋅1354 = 4363 MPa. For the middle road layer, the natural frequency is: 5670 Hz (see the Fig. 8). Based on the results of georadar measurements, the result of averaged instantaneous (with a frequency of 40 MHz) values of middle layer thickness was: 20 cm. Consequently, for the middle road layer, the acoustic wave velocity in accordance with (7) is equal to: 2268 m/s. The elasticity modulus is respectively equal to: 11265 MPa.
Fig. 7Section of the spectrogram of natural oscillations corresponding to the upper pavement layer of the investigated road structure
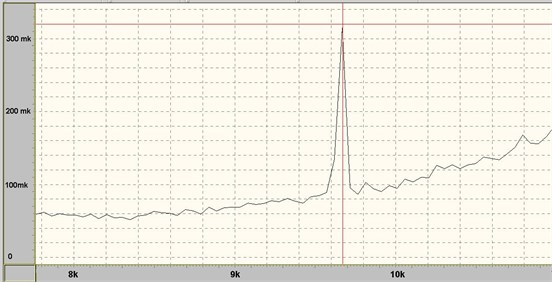
Fig. 8Section of the spectrogram of natural oscillations corresponding to the middle pavement layer of the investigated road structure
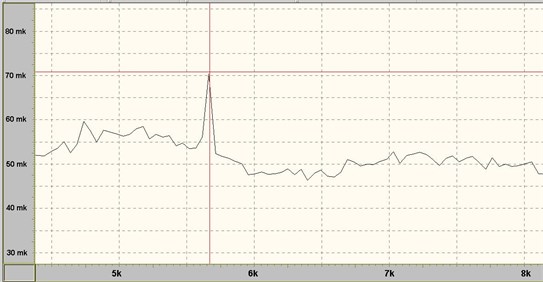
Fig. 9Spectrogram of natural pavement oscillations for the “observation point” No. 212. The amplitude is 38 µV, the frequency ≈ 9.8 kHz
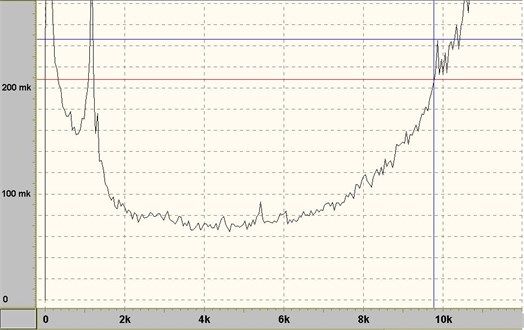
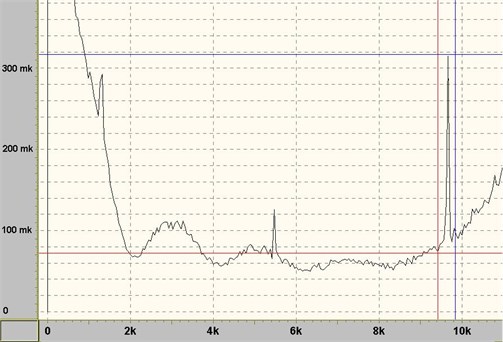
Fig. 10Spectrogram of natural pavement oscillations for the “observation point” No. 208. The amplitude is 69 µV, the frequency ≈ 9.8 kHz
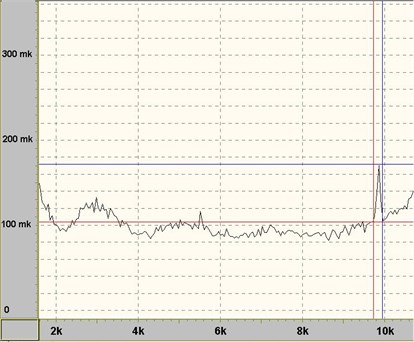
Fig. 11Spectrogram of natural pavement oscillations for the “observation point” No. 204. The amplitude is 245 µV, the frequency ≈ 9.8 kHz
In order to evaluate and compare the obtained results, the elastic moduli of the upper and middle road layers of the investigated road structure were determined in the laboratory conditions. Comparative laboratory tests of the elastic moduli of these layers yielded results that coincide with the obtained instrumental data at a level of ±3.0 %, which for such studies characterizes the high quality of the developed technology.
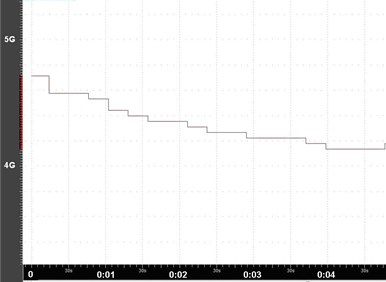
The Fig. 12 shows the graph for determining the strength of one of the layers as an example of the operating of a mobile hardware complex prototype by the automatic measurement of the road pavement strength. The results were obtained by selecting and detecting the difference in the determined propagation times of the reflected electromagnetic signals corresponding to the boundaries between the road pavement layers, applying the Fourier transform method and calculating the strength by algorithms in accordance with the received and valid Eqs. (1)-(6). The given characteristics are the measured, calculated and recorded values of the elasticity modulus in MPa (megapascals) [ordinate axis] which are related to strength. The location values (in fractions of km) are recorded on the horizontal axis [abscissas axis]. The Fig. 12 shows that at the chosen measurement location the elasticity modulus of the controlled layer decreases to 4.15 MPa (40 m abscissas axis). The obtained results are also verified by the tradition laboratory method and confirm both the potential of the proposed method for determining the elastic moduli and the operability of the developed georadar vibration-acoustic set of equipment prototype.
Fig. 12Results of studies over the operation of the mobile hardware complex prototype on automatic measurement of road pavement strength
9. Ways to further improve the georadar vibration-acoustic method for road pavement strength measuring
The experiments have shown that the pavement layers in Henan Province (PRC) contain a small amount of moisture since they have a dielectric constant of 5 to 10 units and, in rare cases, up to 10-15 units. Therefore, to further increase the speed of express-control and increase the accuracy of georadar vibration-acoustic technology, it is advisable to improve the antenna design in order to increase the radar operating frequency from (2-3) GHz [(2-5)·109 Hz] up to (3-6) GHz [(3-6)·109 Hz]. It is also advisable to reduce the standing wave ratio (SWR) of the antennas to 1.5 in order to increase the measurement quality.
The applied block-diagram of the georadar vibration-acoustic complex is optimal, however, in order to provide an express-analysis of the pavement strength with an increased scanning speed, a two-channel scheme using two receiving antennas should be applied. Such a technical solution is preferable. In the further development, a transition to a multichannel measurement mode should be carried out.
For the construction the images of the multilayered pavement structures strength, further improvement of the software is necessary by applying additional mathematical processing of the results of georadar vibration-acoustic measurements
10. Conclusions
A new original method of non-destructive testing of road pavement strength is proposed. The method is based on the simultaneous measurement of radar and acoustic vibrations parameters that are spread in the layers of road pavements. Studies have shown that the applied combination of radar measurements with detection and subsequent spectral processing of vibration-acoustic signals allowed us to obtain new qualitative results of road pavements strength express-analysis. Optimal parameters of hardware implementation and software support of the created hardware complex are determined. The measuring hardware complex can be considered as a virtual “vibration sensor” placed at any selected point in the pavement layers. The location of the “observation point” in depth is set using the software of the system control computer, and the signal processing of the virtual “vibration sensor” is set using the software of the spectrum analyzer (SA) control computer. Experimental results of hardware complex application for the express-analysis of the road pavement strength in Henan Province (PRC) have been obtained. The results of the road pavement strength determination were verified by a comparative analysis with laboratory data. A high coincidence degree is obtained. This confirms both the proposed method promise and the necessity for further improvement of the hardware complex to increase its speed for the purpose of applying for express-control of highways including for widespread application in the provinces of China and elsewhere.
References
-
Sylvie Chambon, Jean Marc Moliard Automatic road pavement assessment with image processing: review and comparison. Departement of MACS, Institut Français des Sciences et Technologies des Transports, de l’Aménagement et des Réseaux (IFSTTAR), 2011 http://downloads.hindawi.com/journals/ijgp/2011/989354.pdf.
-
Proposed Standards for Measurement of Cracking and Rutting. ETG on Quantification of Pavement Cracking and Rutting. US Department of Transportation Federal Highway Administration, 2009.
-
Tien Sy Nguyen, Stéphane Begot, Florent Duculty, Jean Christophe Bardet, Manuel Avila Pavement cracking detection using an anisotropy measurement. International Conference on Computer Graphics and Imaging (CGIM), Innsbruck, Austria, 2010.
-
Brian Mulry, Michael Jordan, David O’brien Automated pavement condition assessment using laser crack measurement system (LCMS) on airfield pavements in Ireland. 9th International Conference on Managing Pavement Assets, 2014.
-
Nichole Andre, Kyle Bowey, Kevin Huynh Integrating laser crack measuring system into the saskatchewan pavement management system. Innovations in Pavement Management, Engineering, and Technologies Session of the 2017 Conference of the Transportation Association of Canada, 2017.
-
Hoang Nhat Duc, Quoc Lam Nguyen, Van Duc Tran Automatic recognition of asphalt pavement cracks using metaheuristic optimized edge detection algorithms and convolution neural network. Automation in Construction, Vol. 94, 2018, p. 203-213.
-
Flintsch Gerardo, Mcghee Kevin K. Quality Management of Pavement Condition Data Collection National Academies of Sciences, Engineering, and Medicine. 2009. Quality Management of Pavement Condition Data Collection. Washington, DC: The National Academies Press, 2009.
-
Petitclerc Benoit, Laurent John, Habel Richard Optimizing 3D surface characeteristics data collection by re-using the data for project level road design. 8th Symposium on Pavement Surface Characteristics: SURF 2018 – Vehicle to Road Connectivity Brisbane, Queensland, 2018.
-
Hoang Nhat-Duc, Nguyen Quoc-Lam, Tranc Van-Duc Automatic recognition of asphalt pavement cracks using metaheuristic optimized edge detection algorithms and convolution neural network. Automation in Construction, Vol. 94, 2018, p. 203-213.
-
Hugenschmidt Johannes Geophysics and Non-Destructive Testing for Transport Infrastructure, with Special Emphasis on Ground Penetrating Radar. PD.D. Thesis, ETH Zurich, 2010.
-
Al-Qadi Imad L., Lahouar Samer Use of GPR for Thickness Measurement and Quality Control of Flexible Pavements. Virginia Tech Transportation Institute, 2004.
-
Simonn J.-M. Evaluation de systemes radar pour controller I’epaisseur des couches de shaussees. Bulletin des laboratories des Ponts et Chaussees, Vol. 238, 2002, p. 51-59.
-
Francisco Fernandes M., Jorge Pais C. Laboratory observation of cracks in road pavements with GPR // Construction and Building Materials, Vol. 154, 2017, p. 1130-1138.
-
US 20120133543 A1. Dual Mode Ground Penetrating Radar (GPR). King Abdulaziz City for Science and Technology, Riyadh, Saudi Arabia, 2010.
-
Pengcheng Shangguan, Imad Al Qadi, Zhen Leng, Robert Schmitt, Ahmed Faheem Innovative approach for asphalt pavement compaction monitoring with ground-penetrating radar. Transportation Research Record: Journal of the Transportation Research Board, 2014, https://doi.org/10.3141/2347-09.
-
US 20110115667 A1. Ultra-wideband Radar Waveform Calibration for Measurements of a Heterogeneous Material. Geophysical Survey Systems, Inc., USA, 2009.
-
US 20140049418 A1. Realization of Time-Domain Ultra Wideband Ground-Penetrating Radar Using High Speed Accumulation and Interpolated Sampling. Geophysical Survey Systems, Inc, USA, 2012.
-
CN 201310210580. Method for Measuring Lunar Soil Dielectric Coefficient by Using Single-Transmitting and Double-Receiving Lunar Surface Ground Penetrating Radar, 2013.
-
CN 106019272A. System and Method Employing Ultra Wide Band Radar Technology for Detecting Lunar Soil Layered Structure, 2016.
-
Vittorio Astarita, Rosolino Vaiana, Iuele Teresa, Caruso Maria Vittoria, Giofrè Vincenzo P., Francesco De Masi Automated sensing system for monitoring of road surface quality by mobile devices. Procedia - Social and Behavioral Sciences, Vol. 111, 2014, p. 242-251.
-
Kaiyue Zang, Jie Shen, Haosheng Huang, Mi Wan, Jiafeng Shi Assessing and mapping of road surface roughness based on GPS and accelerometer sensors on bicycle-mounted smartphones. Sensors, Vol. 18, Issue 3, 2018, p. 914.
-
Buerkle A. M. Modeling and Applications of Acoustic and Electromagnetic Wave Interaction. Ph.D. Thesis, University of Michigan, 2007.
-
Method for Assessing the Strength of Asphalt Concrete Pavement of a Highway. Patent of the Republic of Belarus No. 19008, 2015.
-
Wiggenhauser Herbert Non-Destructive Testing in Civil Engineering. BAM – Federal Institute for Materials Research and Testing, Berlin, Germany, MinDOT, 2010.
-
COMSOL Group, http://www.comsol.com/.
About this article

This study is supported by the Inter-Governmental Cooperation on International Science and Technology Innovation of the Ministry of Science and Technology of China (Grant No. 2016YFE0111000), Transportation Science and Technology Project of Henan Province (Grant No. 2016Z2, 2017J5). The contents of this paper reflect the views of the authors, who are responsible for the facts and the accuracy of the data presented herein.
