Abstract
Steel lattice towers with suspended insulator strings are typically used to carry high-voltage overhead transmission lines. The installation of non-conductive power pylons made of glass fibre reinforced plastics enables a direct cable-pylon connection, as the composite structure acts as an unibody insulator. At the same time, wind-induced vibrations, such as the severe cable vibration phenomenon galloping, will consequently be directly transferred to the slender composite mast structure, potentially leading to extensive damage. The aim of the study is therefore to investigate the galloping behaviour of iced conductor lines with regard to different cable support conditions. Furthermore, additional damping in the composite power pylon structure is assumed to mitigate conductor line galloping and therefore reduce the risk of phase flash-overs between adjacent conductor lines. A numerical galloping simulation is carried out in order to evaluate the effect of a rigid cable-pylon connection with enhanced damping properties on the cable vibration amplitudes. A pylon-cable system, consisting of 3×300 m spans, is investigated. It was found that the support conditions of the conductor lines have a significant influence on the galloping mode, the vibration amplitudes and the orientation of the characteristic galloping ellipse. The addition of damping to the pylon decreases the vibration amplitudes slightly and leads to a re-orientation of the galloping ellipse.
1. Introduction
National electrical grid systems are facing significant transformations: The increasing demand for alternative and renewable energy solutions and, at the same time, the ageing of high-voltage infrastructure are just a few examples, demonstrating the need for renewed and expanding electrical grid systems [1-4]. As a result, a beautification of the 400 kV network has been decided by a national directive 2008 in Denmark [5]. The standard steel lattice towers with its long insulator strings, basically unchanged in visual their appearance for decades and dominating today’s landscape, are planned to be replaced by power pylon structures based on composite materials. The use of non-conductive composite materials, such as glass fibre reinforced plastics (GFRP) or aramid fibre reinforced plastics (AFRP), allows an innovative design and a significantly reduction in size, due to the possibility of integrating the insulators directly on the pylon arm. However, this direct and stiff connection of the conductor lines to the non-conductive composite structure may lead to an increased dynamic interaction.
Wind-induced vibrations and motions, such as the cable vibration phenomenon called galloping, may therefore be directly transferred to the power pylon, potentially leading to structural damage due to excessive vibration amplitudes at resonance [6]. Conductor line galloping is a severe cable vibration phenomenon typically occurring at temperatures below the freezing point and at frequencies between 0.1 Hz and 1 Hz with large amplitudes of up to 0.03 times the span length [7, 8]. The aerodynamic instability is initiated by asymmetric ice aggregations along the conductor, when subjected to moderate or strong cross winds. The galloping motion typically describes a vertically oriented ellipse with a small horizontal component, also known as the galloping ellipse. Depending on the wind conditions, the ice aggregations and the related dynamic characteristics of the conductor lines, a single loop or a few loops of a standing wave may be represented [8] over a time period of up to 24 h. Thus, fatigue damage in the cable, the structure or the clamping may potentially be induced. The design for the severe galloping vibration phenomenon is therefore an important dynamic load case for high voltage power pylons.
Furthermore, the galloping instability is a governing factor in determining the spacing between the conductors. A mitigation in galloping amplitudes may potentially allow a decrease in spacing between adjacent phase conductors due to a reduced risk of phase flash overs. This may consequently lead to a desired downsizing of the composite power pylon, giving it a smaller footprint in its environment. A mitigation of conductor line galloping is assumed to be achieved by the direct cable-tower attachment, compared to the much more flexible standard cable connection with insulator strings [9].
Additional damping in the load carrying pylon structure, potentially obtained by using materials with enhanced damping properties or by the application of damping treatments, may further lead to a mitigation of wind induced galloping vibrations in the cable. Therefore, special regard is given to the dynamic mechanical material behaviour of the non-conductive composite materials, like GFRP and AFRP, used for the power pylon structure. Due to the viscoelastic nature of the polymer resin material, the damping behaviour is up to several magnitudes larger compared to traditional engineering materials such as metals [10]. The damping properties of various polymer resin materials and composite materials have thoroughly been investigated at environmental conditions typical for conductor line galloping [11, 12]. The damping depends highly depends on the fibre direction of the laminate. The lowest damping is obtained in the direction parallel to the fibres, whereas the damping is maximized at fibre angles 30°-45°. Furthermore, the application of additional damping treatments may enhance the overall damping behaviour of the entire structure. The passive constrained layer damping treatment, suitable for high-voltage applications, was experimentally and numerically studied on generic composite mast substructures [13].
Several analytical, numerical and experimental investigations have been carried out on galloping conductor line cables over the last 90 years, when galloping was observed and documented the first time. A fundamental formulation of galloping was proposed by Den Hartog, describing the vertical oscillation mechanism of asymmetrically iced conductor lines [7]. A potential mitigation of cable galloping was studied using external devices, such as spiral wires and circular rings, locally mounted to the cables [14]. Other options to reduce galloping effects are seen in the use of twisted conductors, the reduction of the span length and the adjustment of the cable tension to a certain level, minimizing a potential lateral movement of the conductor line [15, 16].
To the best knowledge of the authors, an investigation on a potential mitigation of conductor line galloping by connecting the cable directly to the non-conductive power pylon has not been conducted yet. The aim of this study is therefore to analyse the effect of different cable support conditions and additional damping of the pylon on the vibration amplitudes of galloping conductor lines. A numerical galloping analysis of a representative 3×300 m cable-pylon system is carried out in order to compare the resulting cable vibration behaviour with respect to the different support conditions and properties.
2. 400 kV network with improved visual design
The required expansion and upgrade of national grid systems, due an ageing infrastructure or the increasing demand for renewable energies, provides the opportunity to install visually improved power pylons compared to standard steel lattice towers, which are basically unchanged in their design for the last 60 years (see Fig. 1).
Fig. 1Visual impact of the composite-based power pylon (computer aided image) [17]
![Visual impact of the composite-based power pylon (computer aided image) [17]](https://static-01.extrica.com/articles/19978/19978-img1.jpg)
The use of the non-conductive composite materials for the design of high-voltage power pylons offers several advantages [18] compared to steel:
1) Visually improved and compact design.
2) Cost competitive due to reduced transportation effort, a monopile foundation and a shorter construction time.
3) Unibody insulator by using non-conductive composite materials like GFRP and AFRP.
4) Enhanced damping properties due to the viscoelastic nature of the polymer.
The composite pylon and the related span properties and dimensions are described in more detail in the following sections.
2.1. Composite power pylon
The composite power pylon is developed in a multi-material design, exploiting the unique properties of each individual material. The pylon consists of a tubular and tapered steel tower, carrying a pair of cantilevered, tapered and hollow composite cylinders at which three pairs of double cable bundles are directly attached, equally distributed at each side (see Fig. 2). The composite cross arms with an inclination of 30° are designed for static and dynamic bending loads in and direction, such as the static self weight of the (iced) conductor line and the dynamic wind or galloping loads [19].
Fig. 2Multi-material design of the power pylon
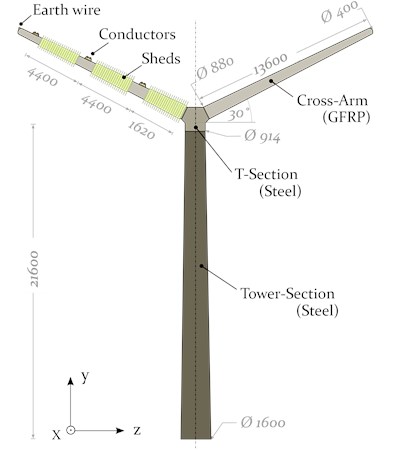
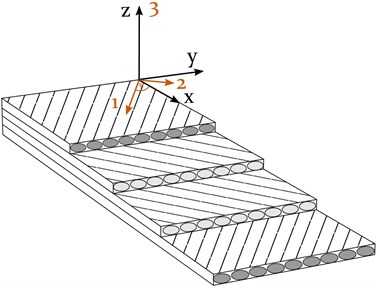
The laminate of the cylindrical composite structure with the stacking sequence , shown in Fig. 3, gradually decreases in thickness from a thick-walled root-end section ( 29 mm) to a thin-walled shell-like zone at the tip of the arm ( 8 mm).
Fig. 3Global coordinate system (COS) and local material COS
The pylon structure is designed for maximum stiffness in order to prevent any resonant vibrations of the structure due to galloping conductor lines at frequencies between 0.1 Hz and 1 Hz [8]. At the same time, enhanced damping properties of the composite cross arms are desired to potentially damp wind induced cable vibrations, which are directly transferred to the pylon due the rigid cable-tower connection.
Furthermore, damping of the composite cross arm is assumed to mitigate conductor line galloping and thereby prevent any structural damage. The dimensions and mechanical properties of the composite power pylon structure are listed in Table 1. The material properties of the representative unidirectional (UD) GFRP lamina are given in the literature [20].
Table 1Dimensions and properties of composite pylon
Parameter | Symbol | Unit | Value |
Height tower | m | 21.6 | |
Wall thickness tower | m | 30.0 | |
Wall thickness cross arm | mm | 8.0-29.0 | |
Length cross arm | m | 13.6 | |
Inclination cross arm | (°) | 30 | |
Lamina orientation (cross arm) | – | (°) | |
Lamina thickness (quadriaxial woven fabric) | mm | 1.0 | |
– | GPa | 34.9 | |
*Smeared lamina properties | GPa | 10.8 | |
*(based on Fig. 3) | GPa | 5.6 | |
– | – | 0.43 |
2.2. Representative span properties and dimensions
The composite power pylon is designed to carry transmission lines with two 400 kV circuits on each side. The initial span length is defined by 300 m, using ACSR conductor lines of the type “Martin” [9]. The physical properties of iced conductor lines with a similar characteristic are given in Table 2. A typical sag configuration of a 300 m span at –17.7 °C (0 °F) was modelled, expecting galloping to happen at temperatures below 0°C [23].
3. Numerical modelling of cable galloping
Galloping vibrations are sensitive to specific parameters, such as wind velocity, cable sag and cable damping. Any change may affect the vibration characteristics of the conductor line significantly [24]. Several numerical sensitivity studies are reported, investigating the influence of such parameters: galloping vibrations are amplified by an increased wind speed and a decreased cable damping and cable sag [25]. However, strong winds are not necessarily a sufficient condition to initiate conductor line galloping. It is possible that even extremely strong winds may not lead to galloping, when the instability criterion is not met [26].
Table 2Mechanical properties and dimensions of iced conductors similar to the properties of an ACSR conductor line type “Martin” [21]
Parameter | Symbol | Unit | Value |
Axial stiffness | 106 N | 20.23 | |
Torsional rigidity | Nm2/rad | 101.0 | |
Diameter bare conductor | 10-3 m | 28.6 | |
Height of the D-shaped ice [22] | 10-3 m | 63.5 | |
Mass per unit length (incl. ice) | kg/m | 2.38 | |
Moment of inertia per unit length | 10-4 kg m | 3.33 |
In this numerical galloping analysis, typical values for the wind velocity, the cable sag and the cable damping were chosen and kept constant throughout the numerical galloping analysis, in order to maintain comparability. The focus of the study is to analyse the effect of different cable support conditions on the vibration behaviour of galloping conductor lines, with regard to the stiffness and damping properties of the supporting structure. It is assumed that a stiff cable-pylon connection in combination with additional damping, introduced for example by a passive constrained layer damping treatment, may lead to mitigation of the galloping vibration amplitudes [27].
A realistic 400 kV three-span system was modelled, containing two cable attachment points (CAP) and one representative conductor line over the whole range of 3×300 m. Two cable connections are investigated: 1) cable attachment to a flexible insulator string and 2) cable attachment directly to a stiff power pylon structure. The latter configuration is shown in Fig. 4.
Fig. 4Representative double 400 kV three-span system of 3×300 m with a representative center-span-cable exposed to aerodynamic forces | Displacements due to galloping are analysed at the center (1/2) of an adjacent cable [A], at the cable attachment point (CAP) of the power pylon [B], at the center (1/2) of the galloping cable [C] and at a quarter (1/4) of the galloping cable [D]
![Representative double 400 kV three-span system of 3×300 m with a representative center-span-cable exposed to aerodynamic forces | Displacements due to galloping are analysed at the center (1/2) of an adjacent cable [A], at the cable attachment point (CAP) of the power pylon [B], at the center (1/2) of the galloping cable [C] and at a quarter (1/4) of the galloping cable [D]](https://static-01.extrica.com/articles/19978/19978-img4.jpg)
The representative conductor line is thereby rigidly connected to the composite cross arm at its outer most position. The remaining cables are represented by point masses and equivalent spring stiffnesses. The numerical galloping analysis, including geometrically nonlinear effects of the cables, was conducted using the commercially available finite element (FE) software Abaqus. A user-subroutine, written in Fortran, was used to subject the representative conductor line to aerodynamic loads only on the intermediate 300 m span, thereby initiating a galloping event. Prior to that, the numerically obtained static equilibrium of the pre-tensioned conductor line, calibrated to a typical sag condition, was verified by the analytical expression, calculating the cable sag:
where , , and are the mass per unit length of the cable, the constant of gravity, the span length and the horizontal cable tension, respectively. Furthermore, a numerical frequency analysis of the single power pylon and the entire three-span system was carried out in order to identify the first natural frequencies. Finally, the galloping analysis of the cable-pylon system was conducted. The numerical analysis is based on the following steps:
1) Static: Pretension of the cable in the global direction (see Fig. 4),
2) Static: Application of gravity to the conductor lines and pylon structures in the global direction,
3) Dynamic: Galloping analysis by applying aerodynamic loads to the representative mid-span section of the conductor line.
Beam elements with a hybrid formulation were used to model the cable and the pylon, specially recommended for slender structures with a high axial stiffness compared to its bending stiffness [28-31]. Each conductor line with its span length of 300 m was thereby discretised into 200 elements. A reduction to 30 elements per span led to comparable results, but to instabilities in the solving process.
3.1. Conductor line model
The schematic cross section of a conductor line with a D-shaped ice accretion, frequently used in numerical galloping studies [33, 34], is represented in Fig. 5. The related properties and dimensions are listed in Table 2. D-shapes with their vertical front facing the wind are found to behave very unstable and are therefore highly prone to galloping [8, 25].
Fig. 5Schematic conduct or line with a D-shaped ice accretion and the resulting aerodynamic loads (FL, FD and M) due to wind loading with the velocity UW [35]
![Schematic conduct or line with a D-shaped ice accretion and the resulting aerodynamic loads (FL, FD and M) due to wind loading with the velocity UW [35]](https://static-01.extrica.com/articles/19978/19978-img5.jpg)
To simplify the D-shaped cross section of the conductor line for the numerical simulation, a circular cross section with equivalent properties is assumed in order to maintain the same axial stiffness , torsional rigidity , moment of inertia and the mass per unit length (see Table 3) [21].
Table 3Equivalent properties of the presented iced conductor lines (see Table 2) used as input parameters for the numerical simulation [21]
Eq. diameter | Eq. density | Eq. E-modulus | Eq. G-modulus |
0.0335 m | 2706.36 kg/m3 | 23.02·109 Pa | 821.2·106 Pa |
Although the level of self-damping in transmission lines is low [36-38], mainly caused by friction between the strands, the damping of additional ice may influence the galloping behaviour and is therefore taken into account in the numerical simulations. Damping ratios in the wide range between 0.4 % and 6 % are typically used to simulate the galloping vibration of iced conductor lines, depending on the type of conductor line and ice accretion [39-42]. An average damping ratio of 3.2 % was employed, applicable to Abaqus using the Rayleigh model. The mass and stiffness proportional Rayleigh damping coefficients and are described as:
with and representing the two adjacent angular frequencies of the cable vibration mode, respectively.
The aerodynamic loads , and , acting on an iced transmission line (see Fig. 5), are defined in Eq. (3) by the aerodynamic coefficients , and , the density of the air , the velocity of the wind and the height of the wind-exposed object:
For conductor lines with a U-shaped ice accretion, the height is equivalent to the diameter of the bare conductor , whereas for D-shaped ice accretions the height is assumed to be the height of the ice front [43] (see Fig. 5).
The wind velocity is a sensitive parameter with a significant impact on the galloping vibration amplitudes [24]. A wind velocity of 8.5 m/s was used for the numerical galloping analysis, representing a typical wind speed in Denmark [44]. The aerodynamic coefficients , and , experimentally determined in wind tunnel tests for the specific D-shape of the iced conductor lines [22], are shown in Fig. 6.
Fig. 6Aerodynamic coefficients for lift CL, drag CD and moment CM as a function of the angle of attack α, specifically determined for an iced conductor line with a characteristic D-shape [22]
![Aerodynamic coefficients for lift CL, drag CD and moment CM as a function of the angle of attack α, specifically determined for an iced conductor line with a characteristic D-shape [22]](https://static-01.extrica.com/articles/19978/19978-img6.jpg)
The aerodynamic coefficients are independent of the wind velocity [45] and only depend on the instantaneous angle of attack , which is constantly changing due to the dynamics of a galloping system. The angle of attack can be approximated by:
where , , and represent the radius of the bare conductor, the initial angle of attack, the torsional angular velocity and the vertical velocity of the conductor line, respectively [46, 47]. The latter two properties and the nodal displacement and the torsional angle, describing the time dependent state of motion of the conductor line, are obtained for each time step by numerical time integration. A user-defined element (UEL) subroutine is therefore introduced into Abaqus [21], generating user elements without mass and stiffness to share the same nodes as the beam elements used for modelling the conductor line (see Fig. 7).
Fig. 7Schematic beam elements and user elements
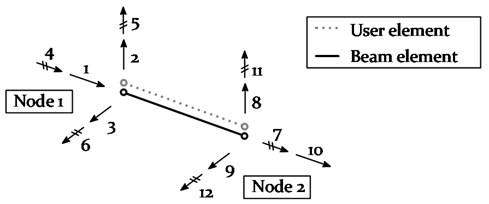
As the bending stiffness of cables is usually low, the bending degrees-of-freedom (DoF) may be released (DOF 5 and 6 at Node 1; DOF 11 and 12 at Node 2). Based on a previously conducted sensitivity analysis, a release was found to only change the static deflection of the cable by 0.8 % [48], simultaneously leading to numerical instabilities. The bending DOFs were therefore not released for the conducted numerical galloping analysis.
The implementation of a user-defined element subroutine enables access on the state-of-motion parameters for each cable element at time and . This allows the calculation and prediction of the angle of attack by (4) and the application of the aerodynamic loads , and by (3) at time and . The Hilber-Hughes-Taylor time integration method is used in Abaqus by default [49]. The user element, introduced by the UEL, is defined to share the same nodes as its equivalent cable element, exhibiting no mass and stiffness. The required input in the Abaqus-specific matrix AMATRX for the UEL, containing the mass matrix , the damping matrix and stiffness matrix , can therefore be set to zero for the user element. The residual load vector , also required as input parameter for the UEL, is defined by:
with –0.05, , , and representing the slight numerical damping and the aerodynamic loads for lift, drag and moment at time and [21]. The predicted aerodynamic loads at time are applied to the two shared nodes of the beam and user element, in order to calculate the nodal “state-of-motion” properties at time .
The initial angle of attack , required in Eq. (4) to calculate the angle of attack , was set to 10°.
3.2. Model of the insulator strings
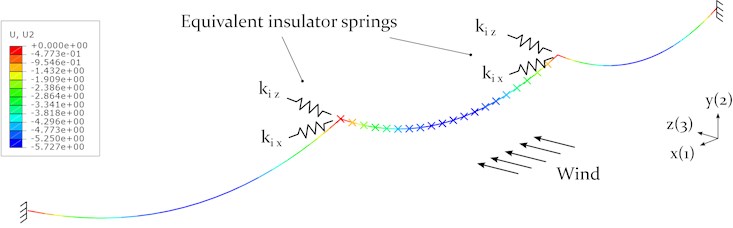
In order to compare the effect of different cable support conditions on the galloping vibration amplitudes, a simplified three-span-system with a standard cable-insulator string connection is modelled. The hanging insulator strings are thereby represented by linear static springs in the - plane [50], determined by:
where and represent the length and the weight of the insulator string, respectively. It is assumed that the insulator string and the load carrying tower structure are entirely stiff. The support conditions used in the numerical galloping simulation are schematically shown in Fig. 8.
Fig. 8Simplified support conditions for standard conductor line connection using hanging insulator strings at static equilibrium (contour plot: deflection U2)
3.3. Model of the power pylon structure
Spatial beam elements were used to model the power pylon with its multi-material-design. The material properties of steel were assigned to the tapered tower section, whereas the composite cross arm is defined by the smeared lamina properties (see Table 1). The tower and the cross arm are divided into several sub-sections to represent the decreasing wall thickness and diameter towards each tip. In order to evaluate potential resonant vibrations due to a galloping event, a frequency analysis of the power pylon was carried out. The conductor lines are thereby represented by point masses and equivalent springs, acting to both sides of each cable attachment point (CAP) in the global direction. As the present sag-to-span ratio is smaller than 1/8, the equivalent spring stiffness of a taut conductor line may be calculated by:
where and represent the horizontal stiffness of a perfectly taut cable and the cable sag, respectively [51]. The horizontal stiffness of a perfectly taut cable is described as:
with and representing the axial stiffness of the conductor line and the angle between the chord line and a horizontal reference [51].
The numerical galloping simulation is based on a preliminary power pylon design [52], considering a variation of wind-ice-loading scenarios [53, 54] and a maximum allowable static deflection in the vertical direction of 200 mm, defined by the architects.
In order to investigate the effect of damping on the cable vibration amplitudes due to galloping, a reasonable damping ratio is therefore assigned to the composite cross arm section of the power pylon model.
The damping properties of GFRP composite materials significantly decrease with decreasing temperature [11] and may not offer sufficient damping at galloping-prone temperatures below the freezing point. However, the application of constrained layer damping treatments, using viscoelastic materials with its peak damping in that temperature range, may considerably increase the damping of the composite structure [27]. A damping ratio of 0.03 is therefore assigned to the composite cross arm section in the numerical galloping analysis. The damping is implemented using the Rayleigh damping coefficients, calculated by Eq. (2), where and represent the two angular frequencies, at which the composite cross arm vibrates during the galloping event.
3.4. Model of the cable-tower system
The numerical galloping analysis was carried out using the three-span model with different cable support conditions. Only one conductor line is fully modelled, subjected to aerodynamic loading in the center span (see section 2.2). The remaining cables are represented by point masses and equivalent horizontal springs in the global direction (see section 3.3). All relevant codes in order to reproduce the numerical galloping analysis, such as the Fortran-code for the UEL, the Python-code for extracting and post-processing the displacement data from Abaqus and the input files for Abaqus, are published and freely available [55].
4. Results numerical simulation
The results of the numerical galloping simulation of the three-span system are presented in this section. The results of the static deflection and the horizontal reaction forces are discussed before presenting the natural frequencies of the system and the power pylon with its equivalent cable springs and point masses. Furthermore, the effect of the cable support condition on the cable vibration amplitudes are investigated by comparing the direct cable attachment with the standard cable-insulator string connection. Finally, the potential mitigation of conductor line galloping by the implementation of additional damping in the composite cross arm is discussed.
4.1. Static deflection of cable-pylon system
The results of the static deflections of a three-span- system are shown in Figs. 8 and 10. The latter figure represents the direct cable-pylon connection approach, containing a set of power pylons and a representative 3×300 m long conductor line with ice accretion, positioned at the outer most CAP on the composite cross arm. The user elements (UEL) are assigned to the conductor line at mid-span, representing the point of attack of the aerodynamic loads. The results of the equilibrium condition of a single, 300 m long cable span are listed in Table 4. The maximum cable sag at the center with 5.727 m corresponds to the analytical solution based on Eq. (1) with 5.730 m. In order to considerably reduce the computational effort for the numerical galloping simulation, the remaining 11 cables of the system are represented by equivalent springs (based on Eq. (8)) and point masses (see Fig. 9). The properties are listed in Table 4.
Fig. 9Boundary conditions for the composite power pylon with cables represented by springs and point masses
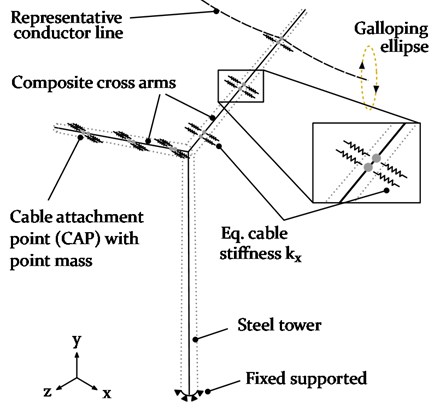
Fig. 10Maximum static deflection of the three-span-system with the representative conductor line subjected to aerodynamic loads (contour plot: deflection U2)
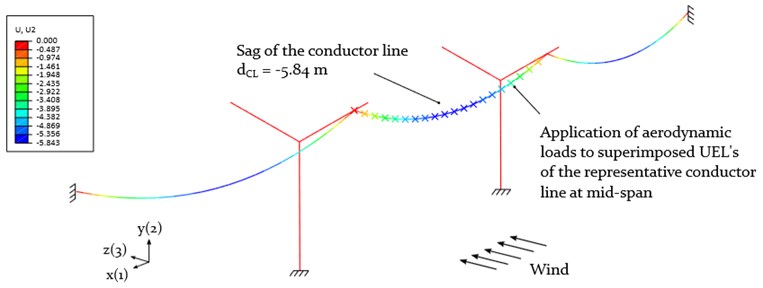
Table 4Static conditions of an iced conductor line with a span length of 300 m, based on the properties shown in Table 2 and 3
Per cable | Per cable attachment point (CAP) | ||||
– | Tension | Sag | Cable inclination | Eq. Stiffness | Eq. Point mass |
Numerical | 45840 N | 5.727 m | 4.01° | 1.3·105 N/m | 714 kg |
4.2. Frequency analysis
The results of the natural frequencies of the individual power pylon and the entire cable-pylon-system are discussed in the following.
4.2.1. Composite power pylon
The mode shapes and the natural frequencies of the individual power pylon with and without equivalent cable masses and stiffness are presented in Fig. 11.
Fig. 11Frequency analysis of the composite power pylon without and with attached cables (represented by Eq. springs kx and point masses mc at each CAP as shown in Fig. 9)
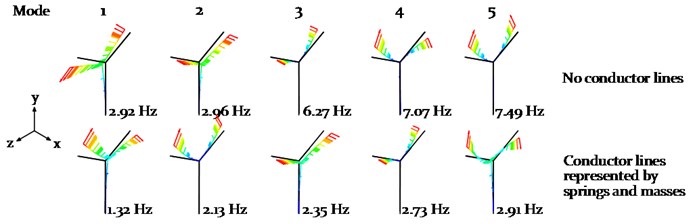
The consideration of 12 taut cables significantly changes the vibration behaviour of the power pylon. The equivalent cable masses lead to a decrease of the first natural frequency by 55 % while maintaining its bending mode shape in the -plane, compared to the power pylon without equivalent cable attachments. However, the resulting first natural frequency of the power pylon 1.32 Hz (bending mode in the -plane) is very close to the galloping induced pylon vibration 1.23 Hz (bending mode in -plane), discussed in more detail in section 4.3.1. An increase in the vertical bending stiffness by locally reinforcing the cross arm and the tower in the -plane may reduce a potential resonance vibration of the pylon due to galloping. The natural frequencies of the higher modes are above 2 Hz and therefore not prone to resonance due to galloping induced vibrations.
4.2.2. Conductor line-pylon system
The natural frequencies of the entire cable-pylon-system are dominated by the conductor lines. The results are listed in Table 5. The mode shape related to the lowest frequencies of the 3×300 m span system corresponds to a single, horizontally oriented loop in the -plane. As conductor line galloping occurs in most of the cases as a vertically oriented single loop, the initial guess of the numerically simulated galloping frequencies was set to the corresponding mode 4-6 with its natural frequencies between 0.286 Hz and 0.312 Hz for the calibration of the Rayleigh damping coefficients (see Section 4.3.1 and Table 6).
Table 5Natural frequencies of three-span system (3×300 m conductor lines, each with a sag s= 5.73 m and a horizontal reaction force Hx= 45.84 kN)
– | Mode | 1-3 | 4-6 | 7-9 | 10-12 | 13-15 | 16-18 | 19-21 |
Natural frequencies of the system [Hz] | min | 0.231 | 0.286 | 0.459 | 0.461 | 0.687 | 0.690 | 0.908 |
max | 0.231 | 0.312 | 0.460 | 0.461 | 0.688 | 0.690 | 0.910 | |
Nr. loops per span (plane) | 1 () | 1 () | 2 () | 2 () | 3 () | 3 () | 3 () | |
4.3. Galloping analysis
In the following the results of the numerical galloping simulation for a three-span conductor line system with different cable boundary conditions are presented. The parameters like wind speed , initial angle of attack , cable sag , damping of the iced conductor line and horizontal tension force remain unchanged throughout the entire analysis (see section 3).
In the first section, the calibration of the Rayleigh coefficients is described, as the damping for the cable and the cross arm is implemented using Rayleigh damping. Three galloping models
• Model 1: Standard cable-insulator string connection,
• Model 2: Direct cable-pylon connection ( 0),
• Model 3: Direct cable-pylon connection ( 0.03),
are studied and discussed in the following sections. Each galloping simulation was carried out over a period of 1500 s, in order to reach a steady state condition. Finally, the vibration amplitudes of the three models with regard to the mid-span are compared and discussed in more detail in the section “Comparison of vibration amplitudes”.
4.3.1. Calibration of Rayleigh coefficients
The calibration of the Rayleigh damping coefficients and for the cable and cross arm was carried out iteratively, based on Eq. (2). The iteration is needed, as the galloping characteristics may change when introducing a change in the damping level.
1) Galloping analysis of a cable, fully constrained at each end; Calibration of the initial Rayleigh coefficients based on an expected single loop (in -plane) at frequencies close to the natural frequencies of the 3×300 m cable-pylon system (see Table 5),
2) Re-calibration of the Rayleigh coefficients based on the resulting galloping frequencies of a cable-pylon-system (shown in Fig. 12 for Model 2), representing a three-span-model (3×300 m) with a galloping cable in the center span (see Fig. 10),
3) Verification step of the galloping analysis, based on Rayleigh coefficients calibrated in step 2), showing galloping frequencies in the same range.
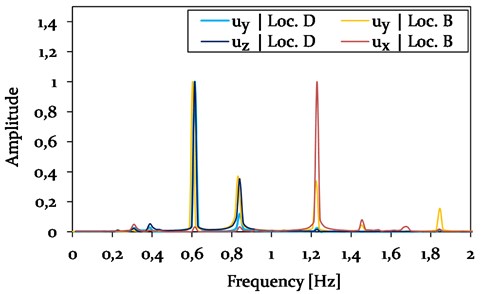
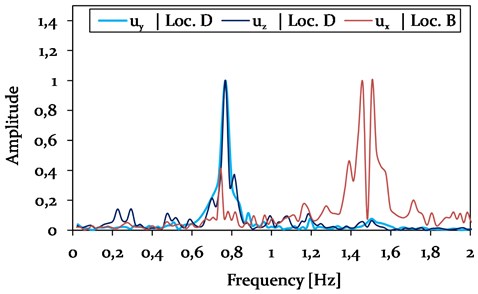
The Rayleigh coefficient for the cable, used in the numerical galloping analysis, are shown in Table 6 and are based on the galloping frequencies presented in Fig. 12.
The galloping frequencies were determined by using a Fast Fourier Transformation (FFT) of the time histories at the CAP (location B) and the galloping conductor lines (location D) at steady state in horizontal and vertical direction (see Fig. 4).
The location D along the galloping conductor line of the reference model was chosen instead of location C, as the iced cable was galloping in a 2-loop constellation with its anti-nodes at 1/4 of the span. As expected, the CAP of the power pylon vibrates in vertical direction with mainly the same frequencies as the galloping conductor line ( 0.61 Hz and 0.84 Hz) and the horizontal vibration of the CAP ( 1.23 Hz). The latter is basically twice the vertical galloping frequency of the cable, as the power pylon is pulled sidewards when the cable vibrates between its maximum and minimum.
Fig. 12Results of the FFT of Model 2, based on the time histories of displacements in vertical uy and horizontal ux, uz directions at location B (CAP) and D (1/4) of the galloping cable span)
The Rayleigh coefficients of the cross arm are determined with 0.152 and 0.005, based on the galloping induced vibrations frequencies of the structure and its damping ratio of 0.03 (see section 3.3).
Table 6Calibration of the Rayleigh coefficients αRcable and βRcable for the galloping cable for Model 2 and 3
Model | Mode (steady st.) | Damping [–] | Galloping freq. [Hz] | Rayleigh coefficients | ||
Cable | Cable | Tower | ||||
Initial (1×300 m) | 1-Loop () | 0.032 | 0.29-0.31 | – | 0.060 | 0.017 |
Iteration 1 (3×300 m) | 2-Loop () | 0.032 | 0.61 | 0.84 | 0.60 | 1.23 | 0.143 | 0.007 |
Iteration 2 (3×300 m) | 2-Loop () | 0.032 | 0.52 | 0.61 | 0.57 | 1.01 | No re-calibration | |
The Rayleigh coefficients for the cable, used in Model 1, were determined as 0.154 and 0.0066, based on the FFT-plot represented in Fig. 13.
Fig. 13Results of the FFT of Model 1, analysing the time histories of displacements in vertical uy and horizontal ux, uz directions at location B (Insulator string connection) and D (1/4 of the galloping cable span)
The slightly increased galloping frequencies of Model 1 compared to Model 2 (see Fig. 12) are due a galloping mode with 3 loops, instead of a 2-loops condition at steady state.
4.3.2. Model 1: Cable-Insulator connection
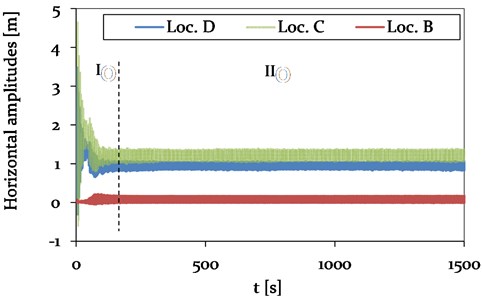
The spring stiffnesses used to represent the hanging insulator strings (see Fig. 8) are defined by 8.61 kN/m and 8.36 kN/m [9]. Time histories of the vertical and horizontal cable vibration amplitudes due to galloping are shown in Figs. 14 and 15 for different locations along the three-span system.
Fig. 14Model 1-Time history plot of vertical displacements at location A (Center, adjacent span), location B (CAP, insulator string), C (Center, mid span) and D (1/4, mid span) (see Fig. 4), representing different vibration conditions (phase I-II)
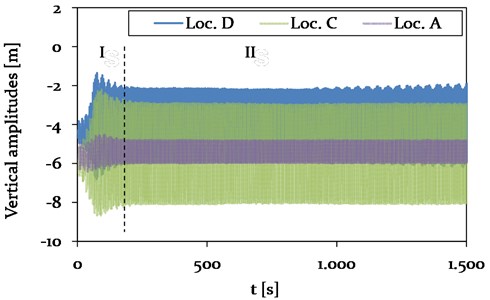
Fig. 15Model 1 - Time history plot of horizontal displacements at location A (Center, adjacent span), location B (CAP, insulator string), C (Center, mid span) and D (1/4, mid span) (see Fig. 4), representing different vibration conditions (phase I-II)
After a period of about 200 s, denoted as phase I, the galloping instability reaches steady state (phase II), in which a 3-loop galloping mode is identified (see Fig. 16).
The observation is in agreement with the determined galloping frequencies, presented in Fig. 16. The natural frequencies of the system, corresponding to a vertical 3-loop mode in the -plane, are with 0.69 Hz close to the galloping frequencies of the cable with 0.76 Hz (see Table 5).
The vertical amplitudes at the center and at the quarter point of the galloping mid-span (Loc. C and D) are determined as 4.9 m and 3.6 m in phase II, respectively. It is clearly observed that the adjacent span (Loc. A) is excited by the galloping conductor lines at mid-span to vibrate in the vertical direction, leading to amplitudes of about 1.1 m. The pronounced coupling is due to the cable connection by the hanging insulator strings, which are free to move in the -plane and only restricted by the stiffness from the adjacent cables.
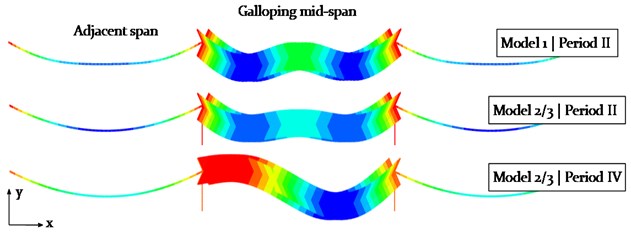
Fig. 16Comparison of the scaled galloping modes of Model 1 at steady state (phase II) and Model 2 and 3 with a 3-loop (phase II) and a 2-loop galloping mode (phase IV)
The horizontal amplitudes in the mid-span at steady state (phase II) are with maximum 0.4 m much smaller compared to the vertical amplitudes. However, an excitation of the adjacent spans to vibrate in the -direction is also observed. The trace of the galloping conductor line in -plane at the center of the mid-span (Loc. C) is presented in Fig. 17, showing the chaotic build-up phase (phase I) and the clearly visible galloping ellipse during steady state (phase II).
Fig. 17Model 1 – Galloping ellipse traced at Loc. C (center, mid-span) during 3-loop galloping
4.3.3. Model 2: Cable-pylon-connection (no cross-arm damping)
The galloping behaviour of the conductor line, rigidly attached to the composite cross arm, is much more unsteady compared to Model 1, demonstrated by the vertical and horizontal time history plots in Fig. 18 and 19.
After the initial build-up phase with a chaotic vibration behaviour of the cable, a 3-loop condition is observed (phase II) over a range of about 500 s. The vertical amplitudes at the center of the mid-span are with 2.7 m about 30 % higher compared to the location D at one-quarter of the mid-span. The steady state (phase IV) is reached after about 1050 s, representing a 2-loop galloping mode with a maximum vertical amplitude of 7.6 m at location D. The vertical and horizontal amplitude almost vanishes at the center of the mid-span, demonstrating a well-balanced 2-loop condition (see Fig. 16).
The vibration response of the cable consists of a dominating part at the frequency 0.6 Hz and a minor portion at 0.81 Hz (see Fig. 12).
The unsteady vibration behaviour of the cable in vertical (-axis) and horizontal (-axis) direction is assumed to be due to the direct power pylon connection with its high bending stiffness, resulting in a limited displacement at the CAP in the -plane. This leads to a delayed and irregular excitation of the adjacent spans, which consequently effects the vibration behaviour of the galloping cable at mid-span.
Fig. 18Model 2 – Time history plot of vertical displacements at location A (Center, adjacent span), location B (CAP, pylon), C (Center, mid span) and D (1/4, mid span) (see Fig. 4), representing different vibration conditions (phase I-IV)
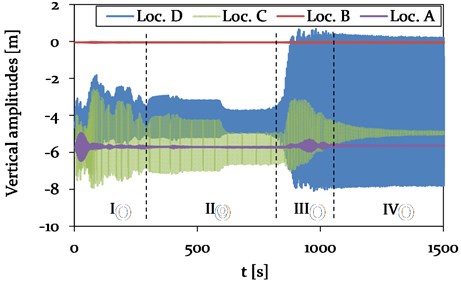
The observed vibration amplitudes of the adjacent spans (see Loc. A in Fig. 18 and 19) exhibit the same magnitude compared to Model 1, but only in the transient phases I and III and just over a short period of 150 s. In phase I and III of Model 2, the observed and steady vibration amplitudes in vertical direction with maximum 0.1 m, which corresponds to only 9 % of the vertical amplitudes in Model 1 with its standard insulator string connection (compare with at Loc. A in Fig. 14).
Fig. 19Model 2 – Time history plot of horizontal displacements at location B (CAP, pylon), C (Center, mid span) and D (1/4, mid span) (see Fig. 4), representing different vibration conditions (phase I-IV)
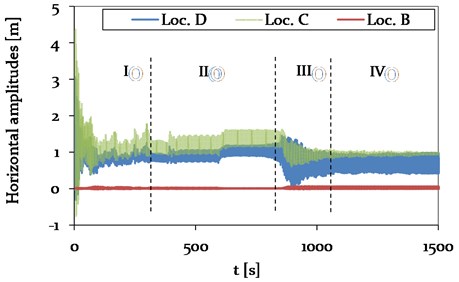
Fig. 20Model 2 – Galloping ellipse traced at Loc. D (1/4, mid-span) during 2-loop galloping
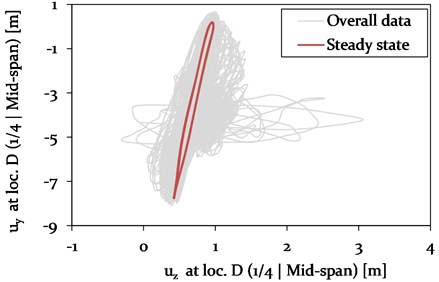
The horizontal vibration amplitudes of the adjacent spans of Model 1 and 2 also vary in magnitude. In Model 1, the amplitudes are with 0.18 m about 90 % higher compared to Model 2. The variation in vibration amplitudes of the different models at mid-span is discussed in more detail in section 4.3.5. In Fig. 20, the characteristic galloping ellipse at Loc. D is shown for the 2-loop galloping condition at steady state.
4.3.4. Model 3: Cable-pylon-connection with cross arm damping
Additional damping in the composite cross arm of the power pylon is assumed to mitigate the galloping induced cable vibration amplitudes. A damping ratio of 0.03 is thereby implemented to the cross arm by Rayleigh damping, calibrated based on the vibration frequencies at Loc. B (CAP) shown in Fig. 12. The results of the time dependent cable displacements in vertical and horizontal direction are presented in Fig. 21 and 22 for different locations along the three-span system.
Fig. 21Model 3 – Time history plot of vertical displacements at location A (Center, adjacent span), location B (CAP, Power pylon), C (Center, mid span) and D (1/4, mid span) (see Fig. 4), representing different vibration conditions (phase I-IV)
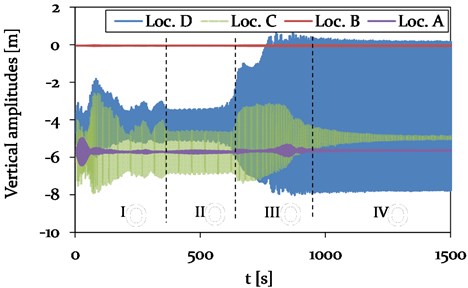
Fig. 22Model 3 – Time history plot of horizontal displacements at location B (CAP, pylon), C (Center, mid span) and D (1/4, mid span) (see Fig. 4), representing different vibration conditions (phase I-IV)
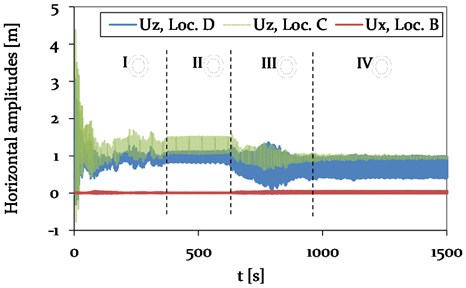
The difference in the time history plots of the vertical and horizontal amplitudes of Model 2 and 3 is mainly related to a changed duration of the different phases. Whereas the durations of the transition phases I and III are increased, the period of phase II with its 3-loop galloping mode is reduced.
However, the overall vibration behaviour with the 2- and 3-loop mode is the same for Model 2 and 3. No significant difference in horizontal and vertical vibration amplitude of the adjacent spans is observed. A comparison of the vibration amplitudes of the mid-span is discussed in more detail in the following section.
4.3.5. Comparison of vibration amplitudes
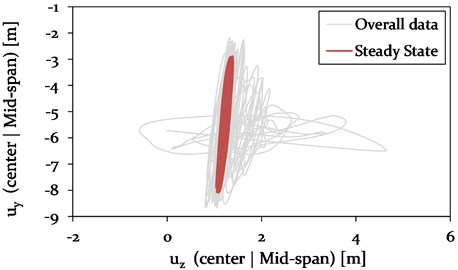
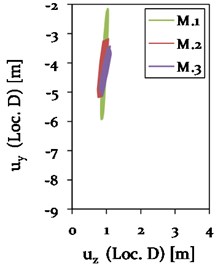
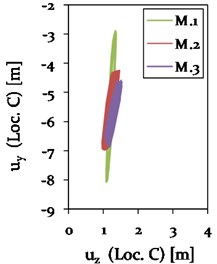
As expected, the vertical vibration amplitudes at steady state are larger during a 2-loop galloping mode (see Fig. 20) compared to a 3-loop mode (see Fig. 17). In order to fairly compare the effect of the cable support condition on the vibration amplitudes of the galloping cable, the vibration conditions need to be similar. Therefore, the galloping ellipse of Model 1, representing a standard cable-insulator string connection, is compared to the galloping ellipses of the models with a direct cable-tower connection (Model 2 and 3) at a time of about 500 s in phase II (see Fig. 18 and 21). At this state, the cables of all three models vibrate in a 3-loop mode with its local maxima in the center and close to one-quarter and three-quarter at mid-span. The resulting galloping ellipses for Model 1, 2 and 3 at Loc. C and D are therefore shown in Fig. 23.
Fig. 23Comparison of the galloping ellipses of Model 1 (Insulator string connection), Model 2 (direct connection without cross arm damping) and Model 3 (direct connection with cross arm damping ζCA= 0.03) with regard to a 3-loop condition at Loc. C and D, each at about 500 s (phase II)
a)
b)
A change in cable support condition from an insulator string to a stiff pylon structure leads to a significant change in the vibration behaviour with respect to the -plane in the center (Loc. C) and close to one-quarter (Loc. D) at mid-span. Two phenomena are thereby observed at both locations: 1) a change in length of the major axis of the galloping ellipse and 2) a rotation of the ellipse towards the -axis. The length of the major axis of the galloping ellipse significantly reduces from Model 1 to Model 2, resulting in a reduced vertical vibration amplitude of about 48 % due to the increased stiffness at the CAP. The application of damping to the cross arm with 0.03 in Model 3 leads to an additional reduction in vertical amplitudes by 15 % for the 3-loop condition at Loc. C.
At the same time, a gradually rotating galloping ellipse towards the -axis is observed for Model 1 to 2 by 7 % and for Model 2 to 3 by additional 2.3 %. This consequently leads to an increase in horizontal amplitude by 53 % from Model 1 to Model 2. A further increase in horizontal vibration amplitude is not observed for Model 3. Instead, the application of damping to the composite cross arm leads to a reduction of the galloping ellipse in horizontal direction by 8 %.
In summary, it can be stated that a change from a flexible cable-insulator string connection to a stiff cable-pylon connection seems to considerably reduce the size of the galloping ellipse, while slightly increasing the horizontal vibration amplitude. Additional damping in the composite cross arm further reduces the vertical vibration amplitudes and, at the same time, the horizontal vibration amplitude compared to Model 2 without any damping.
5. Conclusions
Wind-induced vibrations, such as the severe galloping cable vibration phenomenon, may lead to extensive damage at the cable attachment point or even for the entire mast structure. The objective of this research was to investigate a potential mitigation of conductor line galloping by rigidly connecting the conductor line to a non-conductive composite power pylon with enhanced damping properties.
A numerical galloping analysis of a representative 3×300 m span system was carried out in order to evaluate different cable-support conditions with respect to the resulting vibration amplitudes. The outer most cable of the mid-span was therefore subjected to aerodynamic loading in order to initiate conductor line galloping. The remaining cables were represented by equivalent spring stiffnesses and point masses. The main conclusions are drawn for the conducted simulations:
1) The vibration behaviour of a galloping conductor line, directly attached to a stiff pylon structure, is with a 3-loop and 2-loop condition much more complex compared to a flexible cable-insulator string connection with a constant 3-loop condition.
2) By changing the cable support conditions from an insulator string to a stiff power pylon, the vertical vibration amplitude at the location of maximum deflection may be reduced by 48 %, while the small horizontal vibration amplitude increases by 53 %.
3) The addition of damping to the composite cross arm with 0.03 leads to a reduction of vertical and horizontal vibration amplitudes by 15 % and 8 %, respectively, compared to the model without any damping in the composite cross arm.
References
-
Gardiner D. Transmission Upgrades and Expansion – Keys to Meeting Large Customer Demand for Renewable Energy. A Renewable America, A project of the Wind Energy Foundation, 2018.
-
Liu Z. Global Energy Interconnection. 1st Edition, Academic Press, 2015.
-
Bettencourt A. The Global Smart Grid Federation Report. SmartGrid Canada, 2012.
-
Feltus A. Ageing grid poses problems. Petroleum Economist, 69:15, 2002.
-
New Guidelines for Cable Installation and Expansion of the Transmission Grid. Danish Energy Agency, 022520/78028-001, 2008.
-
Zhu K. J., Liu B., Niu H. J. Statistical analysis and research on galloping characteristics and damage for iced conductors of transmission lines in China. International Conference on Power System Technology: Technological Innovations Making Power Grid Smarter, Powercon2010.
-
Den Hartog J. P. Mechanical Vibrations. 4th Edition, McGraw-Hill Book Company, 1956.
-
Lilien J. L., Farzaneh et al. M. State of the Art of Conductor Galloping – A complementary document to EPRI Orange Book. CIGRÉ Publication, Technical Brochure No. 322, 2007.
-
Krog N. Numerical Modeling of Conductor Line Galloping. Master Thesis, Technical University Denmark, Mechanical Engineering, 2015.
-
Treviso A., Genechten B. V., Mundo D., Tournour M. Damping in composite materials: properties and models. Composites Part B: Engineering, Vol. 78, Issue 1, 2015, p. 144-152.
-
Kliem M., Rueppel M., Høgsberg J., Berggreen C., Baier S. Damping properties of non-conductive composite materials for applications in power transmission pylons. Journal of Composite Materials, 2018, https://doi.org/10.1177/0021998318766635
-
Kliem M., Høgsberg J., Wang Q., Dannemann M. Characterization of clay-modified thermoset polymers under various environmental conditions for the use in high-voltage power pylons. Advances in Mechanical Engineering, Vol. 9, 2017, p. 1-16.
-
Kliem M., Høgsberg J., Hoschützky S., Vanwalleghem J., Filippatos A. Experimental analysis of passive constrained layer damping treatments for composite power pylon structures. Canadian-International Conference on Composites, Cancom Ottawa, Canada, 2017.
-
Vo H. D., Katsuchi H., Yamada H., Nishio M. A wind tunnel study on control methods for cable dry-galloping. Frontiers of Structural and Civil Engineering, Vol. 10, 2016, p. 72-80.
-
Kalaga S., Yenumla P. Design of Electrical Transmission Lines: Structures and Foundations. 1st Edition, CRC Press, 2016.
-
Skouboe H. Power Pylons of the Future. BYSTRUP, 2017.
-
Bystrup Architects Power Pylons of the Future. 3rd Edition, Commercial booklet, 2015.
-
Offersen J. R. Expansion and Reinforcement of Energinet.dk's 400 kV Transmission Line Idomlund - Tjele. Report, Aalborg University, Mechanical Engineering, 2016, (in Denmark).
-
Hayder R. A. Strengthening Design of Reinforced Concrete with FRP. Taylor and Francis, 1st Edition, 2015.
-
Hu J., Yan B., Zhou S., Zhang H. Numerical Investigation on galloping of iced quad bundle conductors. IEEE Transactions on Power Delivery, Vol. 27, 2012, p. 784-792.
-
Yu P., Desai Y. M., Popplewell N., Shah A. H. Three-degree-of-freedom model for galloping. Part II: Solutions. Journal of Engineering Mechanics, Vol. 119, 1993, p. 2426-2448.
-
Walker M. Aluminium Electrical Conductor Handbook. 3rd Edition, Aluminium Association, 1989.
-
Borna A. Prediction of Galloping of Transmission Line Conductors by a Computational Aeroelastic Approach. Dissertation McGill University, Mechanical Engineering, Montreal, 2014.
-
Xu H., Zhu K.-J., Liu B., Liu C.-L., Yang J.-L. A study of influencing parameters on conductor galloping for transmission lines. Journal of Vibroengineering, Vol. 16, Issue 1, 2014, p. 312-323.
-
Stickland M. T., Scanlon T. J. An investigation into the aerodynamic characteristics of catenary contact wires in a cross-wind. Proceedings of the Institution of Mechanical Engineers, Part F: Journal of Rail and Rapid Transit, Vol. 215, Issue 4, 2001, p. 311-318.
-
Kliem M., Høgsberg J., Vanwalleghem J., Filippatos A., Hoschützky S., Fotsing E. R., Berggreen C. Damping investigation of cylindrical composite structures with enhanced damping properties. Journal of Applied Composite Materials, https://doi.org/10.1007/s10443-018-9684-2, 2018.
-
Davies G. J. Numerical Analysis of Cables in the Offshore Environment. Master Thesis, University of Cape Town, South Africa, 1988.
-
Yan B., Lin X., Luo W., Chen Z., Liu Z. Numerical study on dynamic swing of suspension insulator string in overhead transmission line under wind load. IEEE Transactions on Power Delivery, Vol. 25, 2010, p. 248-259.
-
Dai W., Gao F., Bai Y. FEM analysis of deepwater drilling risers under the operability and hang-off working conditions. Journal of Marine Science and Application, Vol. 8, 2009, p. 156-162.
-
Güler S., Karagülle H. Finite element analysis of structures with extruded aluminum profiles having complex cross sections. Latin American Journal of Solids and Structures, Vol. 13, 2016, p. 1499-1514.
-
Li X. M., Zhu K. J., Bin L. Experimental simulation on aerodynamic character of D-shaped iced conductor. Applied Mechanics and Materials, Vol. 614, 2013, p. 622-627.
-
Havard D. G., Lilien J. L. Conductor galloping. IEEE ESMOL and TPC Meeting, Las Vegas, 2008.
-
Liu B., Zhu K. J., Li X. M., Zhan X. P. Hysteresis phenomenon in the galloping of the D-shape iced conductor. Mathematical Problems in Engineering, 2013, https://doi.org/10.1155/2013/784239
-
Guedes A. V., Matt C. F., Cavalcanti E. S. C. Experimental investigation of the dynamic behaviour of Stockbridge dampers. 18th International Congress of Mechanical Engineering, Ouro Preto, 2005.
-
Macdonald J. H. G., Larose G. L. Two-degree-of-freedom inclined cable gallopinga. Part 2: Analysis and prevention for arbitrary frequency ratio. Journal of Wind Engineering and Industrial Aerodynamics, Vol. 96, 2008, p. 291-307.
-
Macdonald J. H. G., Larose G. L. Two-degree-of-freedom inclined cable gallopinga. Part 1: General formulation and solution for perfectly tuned system. Journal of Wind Engineering and Industrial Aerodynamics, Vol. 96, 2008, p. 308-326.
-
Waris M. B., Ishihara T., Sarwar M. W. Galloping response prediction of ice-accreted transmission lines. The 4th International Conference on Advances in Wind and Structures, Jeju, Korea, 2008.
-
Zhang H., Liu X., Zhang L., He L. Theoretical and numerical analysis of galloping of bundle conductors. Asia-Pacific Power and Energy Engineering Conference Wuhan, China, 2011.
-
Gurung C. B., Yamaguchi H., Yukino T. Identification of large amplitude wind-induced vibration of ice-accreted transmission lines based on field observed data. Engineering Structures, Vol. 24, 2001, p. 179-188.
-
Yan B., Liu X., Lv X., Zhou L. Investigation into galloping characteristics of iced quad bundle conductors. Journal of Vibration and Control, Vol. 22, 2014, p. 965-987.
-
Clark R., Cox D., Curtiss H., Edwards J. W., Hall K. C., Peters D. A., Scanlan R., Simiu E., Sisto F., Strganac T. W. A Modern Course in Aeroelasticity. 4th Edition, Springer Science an Business Media, 2006.
-
Swinkels J., Eijnden L. V. D. A Journey Towards Sustainable Energy Security – Lessons Learned from Denmark. Interdisciplinary research Utrecht University, Mechanical Engineering, 2014.
-
Keutgen R., Lilien J. L. Benchmark cases for galloping with results obtained from wind tunnel facilities validation of a finite element model. IEEE Transactions on Power Delivery, Vol. 15, 2000, p. 367-374.
-
Blevins R. D. Flow-Induced Vibration. 2nd Edition, Van Nostrand Reinhold, New York, 1990.
-
Srivastava D., Chandra D. Transmission line conductor galloping analysis using FEM. International Journal of Applied Engineering Research, Vol. 11, 2016, p. 6972-6982.
-
Johansen D. Mitigation of Conductor Line Galloping by Enhanced Damping in Composite Power Pylons. Master thesis Technical University Denmark, Mechanical Engineering, 2018.
-
Implicit dynamic analysis. ABAQUS Theory Manual ver. 6.14, 2014.
-
Veletsos A. S., Darbret G. R. Dynamic stiffness of parabolic cables. Earthquake Engineering and Structural Dynamics, Vol. 11, 1983, p. 367-401.
-
Madugula M. K. S. Dynamic Response of Lattice Towers and Guyed Masts. 1st Edition, American Society of Civil Engineers, 2001.
-
Odgaard T. S., Corfitzen C. Static Design and Analysis of a Glass Fibre Reinforced Composite Power Pylon. Diploma Thesis Technical University Denmark, Mechanical Engineering, 2017.
-
Overhead Electrical Lines Exceeding AC 1 kV – Part 1: General requirements – Common Specifications. DS/EN 50341-1:2013, Dansk Standard, 2013.
-
Overhead Electrical Lines Exceeding AC 45 kV – Part 3: Set of National Normative Aspects. DS/EN 50341-3-5:2001, Dansk Standard, 2013.
-
Kliem M. Fortran-, Python- and Abaqus-Codes for: Mitigation of conductor line galloping by a direct cable-connection to non-conductive composite power pylons. Mendeley Data, 2018, https://doi.org/10.17632/3gg4mc2n8t.1
Cited by
About this article

Thanks to the Innovation Fund Denmark for the financial support of the project “Power Pylons of the Future” (PoPyFu) in collaboration with Bystrup and Tuco Marine ApS.
The author(s) disclosed receipt of the following financial support for the research, authorship and/or publication of this article: This research is supported by Innovation Fund Denmark via the project Power Pylons of the Future (PoPyFu) in collaboration with Bystrup and Tuco Marine ApS, which are gratefully acknowledged.
