Abstract
Fatigue damage is a type of damage usually occurring to repeatedly loaded elements of structures in various engineering fields. Accumulation of fatigue damage may cause failure of structural elements. Identification of incipient fatigue damage is essential to ensure safety of structures. Fatigue crack under repeated loads commonly behaves in a nonlinear dynamic manner, typically manifested by both occurrence of higher harmonic components and interaction of harmonic components. Interrogation of nonlinear dynamic manner provides a promising way to characterize structural fatigue damage. This study aims at developing a new method to interrogate nonlinear dynamic manner for fatigue damage identification. This method is based on bispectral analysis of structural vibrational responses. This method portrays fatigue damage by inspecting the presence of higher harmonic components and quantifying the interaction of these harmonic components. The method can precisely locate and quantify a small-sized fatigue damage in a cantilever beam, presenting great accuracy in fatigue damage identification.
1. Introduction
Damage usually appear in the component of an in-service structure, accumulation of damage may cause dangerous effect on the safety of the structure [1]. The research of Damage identification methods has attracted attention of researchers from different areas in recent decades. Many Damage identification methods have been proposed and improved by eminent researchers. However, these methods have their limitations, most of them are inapplicable to fatigue damage structure.
Fatigue damage is the most typical damage of structural element under repeated loads [2-5]. Identification of incipient fatigue damage is essential to ensure safety of structures. The most traditional damage identification methods are based on linear theory, but fatigue damage commonly exhibits nonlinear dynamic behavior. Analysis of nonlinear problems of fatigue damage structure using linear theory methods is improper, there is a need for development of a damage identification technique based on nonlinear theory, which is more suitable for fatigue damage structure.
A fatigue crack can alter structural dynamic behavior [6], and therefore investigation of changes in structural dynamic behavior provides a feasible means of identifying fatigue cracks in structures [7]. A fatigue crack in a structural element exhibits nonlinear behavior when the structure is vibrating due to external excitation as occurred in vibration measurement [8-10]. According to the research by other scholars, it is possible to detect fatigue damage judged by detecting nonlinear level in vibration behavior, and the nonlinear level should be measured by nonlinear behavior feature [11]. The fatigue crack closes and opens periodically during structural vibration, called the breathing crack, which commonly induces instantaneous changes in stiffness, a type of particular nonlinear behavior [12]. Such a nonlinear behavior displays two predominant distinctions: typically manifested by both occurrence of higher harmonic components [13] and interaction of harmonic components to form new combinations of sum and difference frequencies [14].
The existence of higher harmonics is an important nonlinear basis for detecting fatigue damage. In recent decades, many researchers have devoted their efforts to the existence of higher harmonics in structural dynamic behavior. However, existing studies ignored the interaction of different frequency components, which may distort the nonlinear values measured by harmonics. The coupling between different frequency components should be considered in fatigue damage identification method. Moreover, the traditional methods have not been widely adopted in engineering practice, largely due to practical difficulties. Clearly, acquisition of all the suggested prerequisites beforehand can be a highly complex or even impossible task. Importantly, it is difficult to avoid contamination of a vibration signal by a noise source, yet the previously mentioned methods are easily affected by noise. More consideration is required of how to improve the robustness of the method. It also necessary that quantitative nonlinear indexes be insensitive to noise.
With the aim of addressing such problems, this paper focuses on the use of bispectral analysis to study the structural dynamic behavior of a beam with a fatigue crack. The traditional signal processing techniques used to measure structural damage features are wavelet analysis, Fourier transform, singular value decomposition and power spectrum. However, these techniques are generally based on the linear framework [15]. Apart from these methods, bispectral analysis, as a tool for identifying the relationship between the different harmonic components in a signal, has been developed to identify the nonlinear fatigue damage structure.
Differ from the existing research about bispectral analysis focuses on the coupling level, a new quantitative nonlinear index for identifying the nonlinear level is developed in this paper. The new nonlinear index has been carefully considered both occurrence of higher harmonic components and interaction of harmonic components. Further, an efficient method is proposed for damage identification based on evaluation of the nonlinear parameter of the system response. The detection method is demonstrated successfully through numerically simulated experiments.
2. Bispectral analysis in fatigue damage
2.1. Definition of bispectral analysis
The bispectrum is the two-dimensional Fourier transform of the third order moment of a time signal that involves two frequency components (amplitudes and phases) of the signal together with a frequency component summation of first two frequencies, and is mathematically expressed as [3, 4, 16, 17]:
where is the 3rd order moment, and for a discrete time series, the bispectrum is computed by the signal discrete Fourier transform (DFT) as:
where denotes the expectation operator and denotes the complex conjugate of , is the DFT. The bispectrum is a function of two different frequencies and . Only those that fall within the following domain need be computed:
where is the sampling frequency.
2.2. Bispectrum analysis in fatigue damage detection
Fatigue damage causes the response to exhibit nonlinear behavior [18]. One of the characteristics of nonlinearities is that various frequencies mix to form new combinations of sum and difference frequencies. The amount of interaction between the frequencies components can be used to describe the fatigue damage. Moreover, the advantages of bispectrum are its ability to characterize nonlinearities and its theoretical insensitivity to Gaussian measurement noise. The bispectrum can describe this interaction between three frequencies in two-dimensional frequency space in the signal.
From these points of view, an important signature for detecting nonlinearity is based on the fact that a nonlinear interaction exists in the signal, between these frequency components. Simultaneously, for convenient application, a nonlinear parameter can be obtained from the bispectral analysis in order to measure the amount of interaction. The normalization method is expressed as:
This method is only used to contrast the amplitudes of different peaks in the bispectrum. can be seen as the ratio of the amount of interaction of these frequencies to the maximum amount of interaction in the signal. The bispectrum is complex and is interpreted as measuring the amount of interaction between the frequencies and is described by ‘quadratic phase coupling’.
3. Numerical model of vibration beams with fatigue crack
Before researchers focus on efficient procedures for detection of fatigue cracks [19], the fatigue damage structure models must have been investigated. Unfortunately, the creation of a realistic model of a breathing crack is difficult given the lack of fundamental understanding of certain aspects of the breathing mechanism. Yet crack modeling plays an important role in the study of changes in structural dynamic behavior. Researchers have developed various breathing crack models. All these models laid a theoretical foundation for non-linear dynamics behavior.
3.1. Dynamic behavior analysis
The following discussion considers a 2D cantilever beam containing one single-side edge (the upper edge of the beam) fatigue crack. It is assumed that the beam material properties are linear elastic, the displacements and strains are assumed to be small, and the crack thickness is negligible. In the finite element method framework, the equations governing the nonlinear dynamic behavior of the 2D beam are:
where and are the mass, damping, and stiffness matrices, respectively. The time-dependent vectors, , , and denote the nodal accelerations, velocities, displacements, and external forces, respectively, in terms of a global Cartesian coordinate system , .
An integration method is used to solve Eq. (5), the solution time interval of interest [0, ] is subdivided into equal time increments. The initial conditions of accelerations, velocities, and displacements at time zero are also required. The solution to this nonlinear problem requires an iterative procedure. Employing the modified Newton-Raphson iteration method, the displacement vector is obtained, Eq. (5) is written as:
where the right-hand superscripts in brackets represent the iteration number, with 1, 2, 3,…. The symbols , and denote the stiffness matrix, the nodal force vector, and the incremental nodal displacement, vector, respectively.
3.2. Fatigue crack surface contact modeling
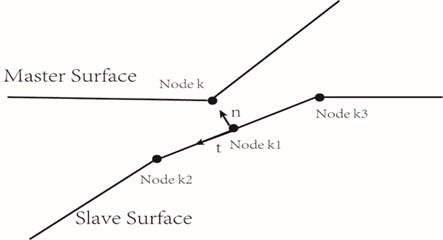
The fatigue crack alternately opens and closes under a time varying load, in what is called the breathing crack behavior. The breathing crack behavior is treated as a contact problem between the crack surfaces and is an inherently nonlinear problem. In the following discussion, it should be noted that a contact model for a breathing crack is used and a no propagating crack assumption is made. The region around the crack is discretized into a set of conventional finite elements. Two-dimensional contact surfaces are formed from a series of linear contact segments and each segment being bounded by two nodes. It is modeled as a contact problem between the crack surfaces: the master surface and the slave surface. A slave node makes contact with only one point on a master segment, but one master segment can make contact with one or more slave nodes each time contact occurs. Penetration between contacting areas is not allowed and any possible sliding is assumed to obey Coulomb’s law of friction.
Fig. 1Contact mechanism of fatigue crack surfaces
3.3. Numerical model
The proposed beam and crack model, although sufficiently simple, can present breathing behavior and capture practical situations [20]. Moreover, this crack model is very useful in the solution of inverse problems. The specific simulation method has been reported [21].
Fig. 2Cantilever beam model with fatigue crack
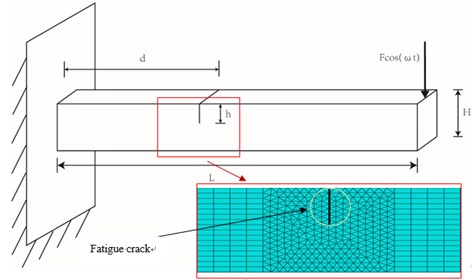
The numerical model of beams with a fatigue crack is now illustrated. A cracked cantilever beam (Fig. 2) of length 2000mm and cross-section 200×200 mm is tested and studied. The material is mild steel with Young’s modulus 68 GPa, Poisson ratio 0.33, and mass density 2700 kg/m3. The cantilever beam has a single-side edge breathing crack. The crack is located at the upper edge of the beam at distance from the fixed end and is the dimensionless crack position; is the dimensionless crack severity. Fig. 2 is the mesh model.
4. Characterization of fatigue damage
For tackling problem of identifying fatigue damage, in accordance with the problem statement using the FE model of the beam with a breathing crack, a comprehensive set of computational experiments is performed to survey the influence of the breathing crack.
4.1. Quantitative fatigue damage feature
In this section, the nonlinear quantitative fatigue damage feature is illustrated by a simple test case. The illustrative example considered is a cantilever beam with a single-side edge fatigue crack, for which the dimensionless crack position and crack severity are 0.1 and 0.3, respectively. Harmonics can be observed when the beam is excited at half or one third of the first system frequency. Thus, when the beam is subjected to harmonic excitation loading, the computed time history of the beam response at the free end is extracted, and the frequency spectrum is obtained through a DFT, the bispectrum is also computed simultaneously.
Fig. 3Frequency response of the transverse acceleration when a fatigue crack is s= 0.3 q= 0.1 under half of the first system frequency excitation
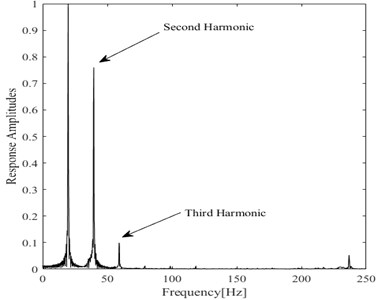
Fig. 4Frequency response of the transverse acceleration when a fatigue crack is s= 0.3 q= 0.1 under one third of the first system frequency excitation
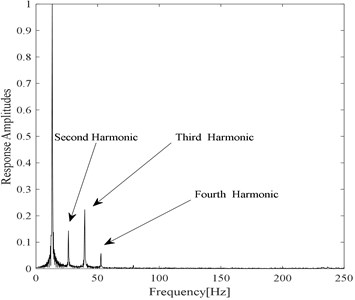
It is known that a single frequency can be observed in the case of an undamaged beam under simple harmonic excitation. Unlike the undamaged model, the response of a cantilever beam with a fatigue crack should contain harmonics under the same conditions. Frequency spectra of the damaged system response are presented in Fig. 3 and Fig. 4, showing the entire spectrum. It is possible to observe the largest responses around the driving frequency, where it is also possible to observe the peak of the higher harmonic components. Incidentally, the amplitude of the spectrum is normalized with respect to the main frequency.
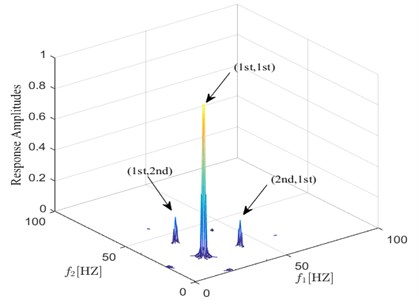
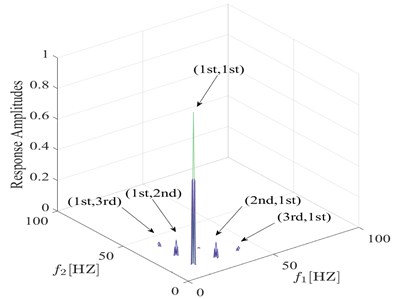
On the other hand, because fatigue damage causes nonlinear behavior, the harmonic components appear and interaction of the harmonic components emerges. From this point of view, an important signature for detecting fatigue damage is based on the fact that both higher harmonics and nonlinear coupling exist in the signal. Bispectral analysis can identify frequency components and nonlinear interaction simultaneously, so the bispectrum of the response is a major feature of interest for damage detection. The amplitude of the bispectrum is also normalized with respect to the main interaction, obtaining the normalized bispectrum resented in Fig. 5. In the following discussion, for easier notation of frequency values, we use “1st, 2nd, 3rd”, and so on to denote the harmonics of the response as “first harmonic (the excited frequency), second harmonic, third harmonic”, and so on. The first order denotes the excited frequency.
Fig. 5 show the bispectrum for the damaged model using a vibration data set from a sample point. From the cantilever beam with a fatigue crack, it is possible to notice the interaction of the frequency and the harmonic components in its bispectrum. High bispectral peaks exist at the following coordinate points: (1st, 1st), (1st, 2nd), and (2nd, 1st).In the case of in which the forcing frequency is half of the first system frequency shown in Fig. 5, a remarkable observation is the highest bispectral peak at (1st,1st).The physical interpretation of this frequency interaction point explains that part of the second harmonic, is generated due to quadratic nonlinearity of the contact problem causing interaction between the 1st and itself. And the peaks at (1st, 2nd), and (2nd, 1st) in Fig. 5 also reflect interaction levels between the excited frequency and the 2nd harmonic, which are used in spectral analysis to detect damage. The maximum interaction value is labeled , which is in the peak at (1st, 1st). The amplitude of the peak at (1st, 2nd) and (2nd, 1st) is the parameter .It is important to note that explains the ratio of the interaction level between excitation and second harmonic to the amount of interaction of the excitation, which reflects the relationship between harmonic and frequencies interaction.
Fig. 5Bispectrum response of transverse acceleration when a fatigue crack is s= 0.35 q= 0.1 under half of the first system frequency excitation
To further study the characteristic of the proposed fatigue damage feature, the relationship between damage feature and damage condition is investigated. The bispectra under different damage conditions are analyzed and the calculation results are presented in the Fig. 6 and Fig. 7. The simulation results show that the proposed fatigue damage feature varies regularly with the severity and position of the fatigue crack, verifying the effectiveness of the feature.
Hence, the parameter is used to characterize the nonlinearity of the structural response of the cantilever beam subjected to a harmonic excitation. The value of depends on the particular choice of the excited frequency , is mathematically expressed as:
For easier notation of the formula, we use to denote that the excited frequency is of the first system frequency. For instance, is obtained when the driving frequency is half of the first system frequency. The non-dimensional ratio is obviously a function of both the crack depth and its location, but it is not dependent on the force amplitude, due to the normalization.
Fig. 6Comparison between bispectra using information from s= 0.4 q= 0.1 and s= 0.2 q= 0.1
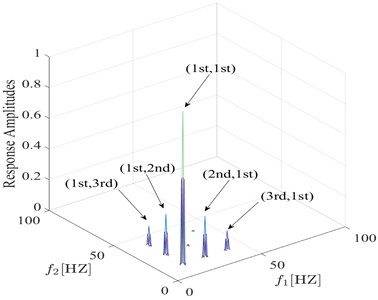
a) 0.4 0.1
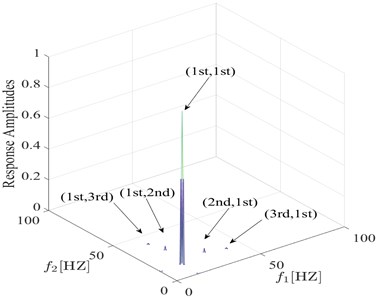
b) 0.2 0.1
Fig. 7Comparison between bispectra using information from s= 0.35 q= 0.1 and s= 0.35 q= 0.3
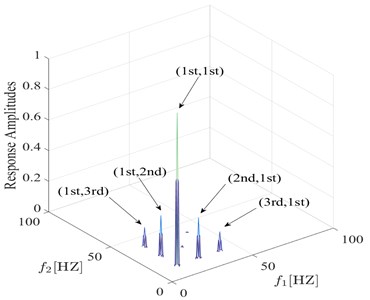
a) 0.35 0.1
b)0.35 0.3
4.2. The damage interaction field
As the position and the severity of a fatigue crack change, the nonlinearity of the system fluctuates. In the considered case of a cantilever beam, the construct of a damage interaction field is proposed to describe the correlation between crack position and its severity changes and the non-dimensional parameter . The damage interaction field defines a sectioning plane that is obtained from the calculated ratio for the corresponding damage condition. Fig. 8 presents the damage interaction field in which the driving frequency is half of the first system frequency. It describes how the damage interaction field change, in relation to the crack position and its severity.
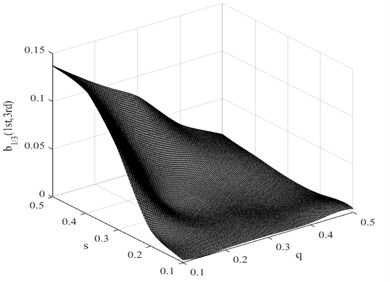
In this research, the damage interaction field properties are analyzed by numerical simulation. The position of the crack varies between 0 and 1000 mm, i.e. 0 0.5, and the severity of the crack depth varies between 0 and 10 mm, i.e. 0 0.5. It is known that the bending stiffness of the beam reduces as the severity of damage increases. Observation reveals that the harmonic content is relatively large, and the degree of interaction is rather high when the crack position and its severity change. This therefore reminds us that the ratio of interaction between the excited frequency and harmonic to self-interaction of excited frequency increases when the crack expands. On the other hand, when the crack is shifted to the fixed end of the beam, the ratio also increases. These findings indicate that small damage close to the fixed end produces impacts similar to those produced by large damage further from the fixed end. The position and the severity of the damage together affect the system dynamics. This damage interaction field is steep, showing sensitivity to both position and severity of the crack. In the same way, other damage interaction field properties are computed by numerical simulation. Fig. 9 and Fig. 10 show the damage interaction field of and respectively. The impacts of damage on interacting is similar. By comparing Fig. 8 with Fig. 9 and Fig. 10, it can be deduced that the damage interaction fields have the same characteristics.
Fig. 8Damage interaction field of b1/2(1st, 2nd)
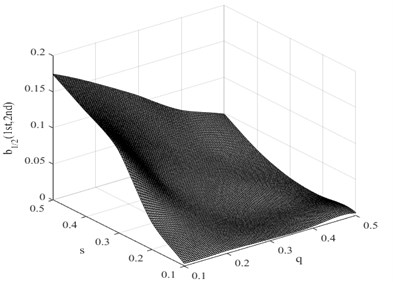
Fig. 9Damage interaction field of b1/3(1st, 2nd)
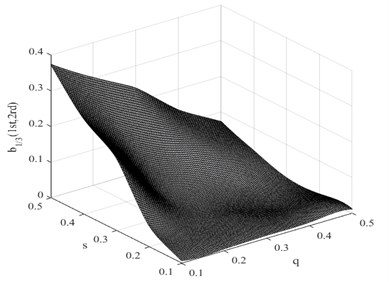
Fig. 10Damage interaction field of b1/3(1st, 3nd)
4.3. Fatigue interaction identification
In this paper we have introduced a fatigue damage feature extraction method based on bispectral analysis. The Damage interaction field, constituted by the features are used to identify the degree of nonlinear interaction of harmonics, thereby finally achieving the research goal. The main steps used in this article are as follow:
1) In according with the objectives of the study, a corresponding model is built by numerical simulation. Based on the numerical simulation, the damage interaction field is developed for the purpose of damage identification. This field describes the relationship between the position of a fatigue crack and its changes in severity and the nondimensional parameter .
2) Using experimental objects with unknown crack damage, the same loads are imposed on the beam for dynamic analysis. Then the response signals at a single definited point are obtained from simulations and the bispectrum of the signal is computed. The fatigue damage feature parameters of the experimental objects with unknown damage are obtained, which contain the combined information of the severity and position of the crack.
3) Finally, the computed unknown damage feature parameter can be used to determine the degree of nonlinear interaction, generating a curve of intersections between one ratio planes and damage interaction field. However, the severity and position of the crack cannot be determined by single curve. Thus, a second parameter is needed to determine the specific condition of the crack. By adding more ratios the solution is finally determined.
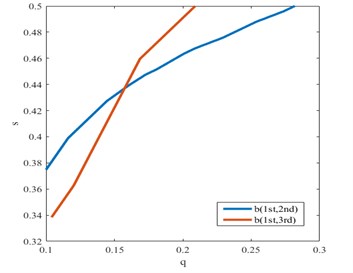
The following application examples are given. The Fig. 11 and Fig. 12 show use of the curve of intersections between single ratio surfaces and damage interaction field to estimate the severity and position of the crack. Fig. 13 depicts the results for a damaged cantilever beam (0.2, 0.4) with use of the damage interaction field relative to pseudo-experimental data obtained by the simulated responses of the unknown damaged beam. The point of intersection of the two curves reflects the damage condition. The damage location and severity can be estimated.
Fig. 11Intersection between quantitative fatigue damage feature and damage interaction field of b1/3(1st, 2nd) for a fatigue crack in the first condition
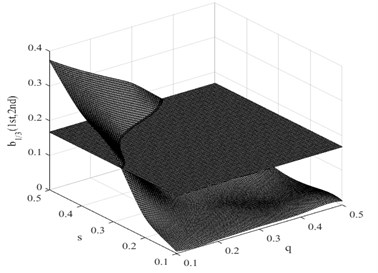
Fig. 12Intersections between single ratio planes and damage interaction field of b1/3(1st, 3rd) for a fatigue crack in the first condition
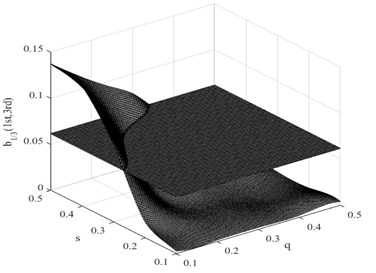
Fig. 13Identifications using information from bispectrum for a fatigue crack in the first condition
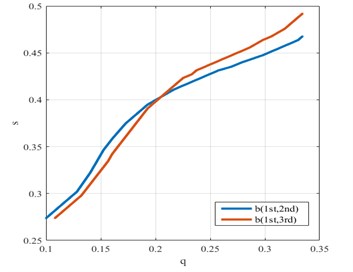
Fig. 14Intersection between quantitative fatigue damage feature and damage interaction field of b1/3(1st, 2nd) for a fatigue crack in the second condition
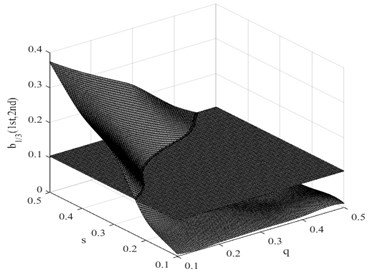
Fig. 15Intersection between quantitative fatigue damage feature and damage interaction field of b1/3(1st, 3rd) for a fatigue crack in the second condition
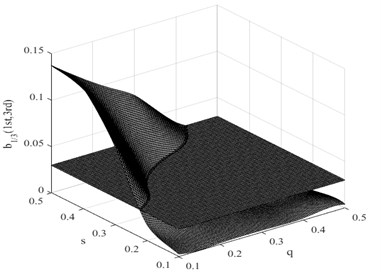
Fig. 16 and Fig. 17 show, for two other damage scenarios, damage feature parameter from two different sets of experimental results. Damage in the second experimental subjects is identified in the above mentioned way. It is quite clear that even if both identifications procedures have their intersection point at 0.18 0.41, the result is not equal to but close to the correct damage location and severity. Fig. 18 depict the result for third subject. It is quite clear that identifications have their intersection point at 0.24 0.4, corresponding to the correct damage location and severity. These results are preferable, as is well demonstrated the feasibility and validity, and demonstrates good performance. These examples show the ability of the methodology to detect fatigue damage.
Fig. 16Identifications using information from bispectrum for a fatigue crack in the second condition
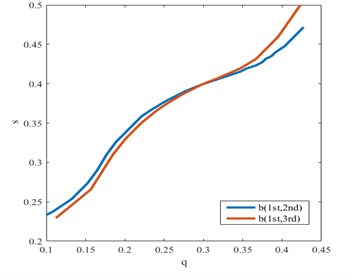
Fig. 17Intersection between quantitative fatigue damage feature and damage interaction field of b1/3(1st, 2nd) for a fatigue crack in the third condition
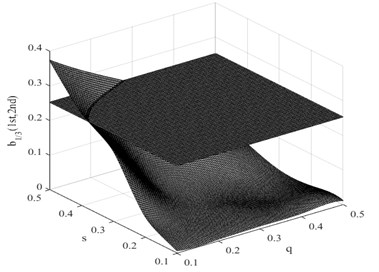
Fig. 18Intersection between quantitative fatigue damage feature and damage interaction field of b1/3(1st, 3rd) for a fatigue crack in the third condition
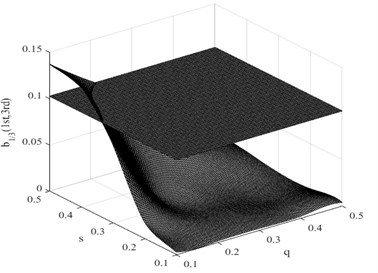
Fig. 19Identifications using information from bispectrum for a fatigue crack in the third condition
5. Conclusions
Determination of the structural nonlinear dynamic behavior of a beam with a fatigue crack by means of bispectral analysis is investigated. For damage identification purposes, this paper proposes a new nonlinear quantitative fatigue damage feature for identification at the nonlinear level. And a method for damage identification is proposed based on the evaluation of the nonlinear fatigue damage of the system response. The detection of structural fatigue cracks using bispectral analysis applied on the response only is demonstrated successfully through numerically simulated experiments.
References
-
Yan A. M., Kerschen G., Boe P. D., Golinval J. C. Structural damage diagnosis under varying environmental conditions – part II: local PCA for non-linear cases. Mechanical Systems and Signal Processing, Vol. 19, 2005, p. 865-880.
-
Benfratello S., Cacciola P., Impollonia N., Masnata A., Muscolino G. Numerical and experimental verification of a technique for locating a fatigue crack on beams vibrating under Gaussian excitation. Engineering Fracture Mechanics, Vol. 74, 2007, p. 2992-3001.
-
Gelman L., White P., Hammond J. Fatigue crack diagnostics: a comparison of the use of the complex bicoherence and its magnitude. Mechanical Systems and Signal Processing, Vol. 19, 2005, p. 913-918.
-
Rivola A., White P. Bispectral analysis of the bilinear oscillator with application to the detection of fatigue cracks. Journal of Sound and Vibration, Vol. 216, 1998, p. 889-910.
-
Sinha J. K. Higher order coherences for fatigue crack detection. Engineering Structures, Vol. 31, 2009, p. 534-538.
-
Shen M. H. H., Chu Y. C. Vibrations of beams with a fatigue crack. Computers and Structures, Vol. 45, 1992, p. 79-93.
-
Tsyfansky S. L., Beresnevich V. I. Non-linear vibration method for detection of fatigue cracks in aircraft wings. Journal of Sound and Vibration, Vol. 236, 2000, p. 49-60.
-
Andreaus U., Baragatti P. Experimental damage detection of cracked beams by using nonlinear characteristics of forced response. Mechanical Systems and Signal Processing, Vol. 31, 2012, p. 382-404.
-
Worden K., Farrar C. R., Haywood J., Todd M. A review of nonlinear dynamics applications to structural health monitoring. Structural Control and Health Monitoring, Vol. 15, 2008, p. 540-567.
-
Semperlotti F., Wang W. K., Smith E. C. Localization of a breathing crack using super-harmonic signals due to system nonlinearity. AIAA Journal, Vol. 47, 2009, p. 2076-2086.
-
Ciampa F., Pickering S. G., Scarselli G., Meo M. Nonlinear imaging of damage in composite structures using sparse ultrasonic sensor arrays. Structural Control and Health Monitoring, Vol. 24, 2016, https://doi.org/10.1002/stc.1911.
-
Chatterjee A. Structural damage assessment in a cantilever beam with a breathing crack using higher order frequency response functions. Journal of Sound and Vibration, Vol. 329, 2010, p. 3325-3334.
-
Andreaus U., Casini P., Vestroni F. Nonlinear features in the dynamic response of a cracked beam under harmonic forcing. International Design Engineering Technical Conferences and Computers and Information in Engineering Conference, 2005, p. 2083-2089.
-
Hassan M. A., Shin Y.-J., Bayoumi A. E., Tarbutton J., Les Eisner M., Higman J. Nonlinear vibration-interaction metric for health assessment of helicopter drivetrain systems. The AHS Airworthiness, CBM, and HUMS Specialists’ Meeting, Huntsville, AL, 2013.
-
Morassi A., Vestroni F. Dynamic Methods for Damage Detection in Structures. CISM International Centre for Mechanical Sciences, 2008.
-
Wilcox P. D., Drinkwater B. W., Neild S. A., Hillis A. J. Global crack detection using bispectral analysis. Proceedings of the Royal Society A: Mathematical, Physical and Engineering Sciences, Vol. 462, 2006, p. 1515-1530.
-
Fackrell J., White P., Hammond J., Pinnington R., Parsons A. The interpretation of the bispectra of vibration signals: I. Theory. Mechanical Systems and Signal Processing, Vol. 9, 1995, p. 257-266.
-
Nichols J. M., Olson C. C., Michalowicz J. V., Bucholtz F. The bispectrum and bicoherence for quadratically nonlinear systems subject to non-gaussian inputs. IEEE Transactions on Signal Processing, Vol. 57, 2009, p. 3879-3890.
-
Abraham O. N. L., Brandon J. A. The modelling of the opening and closure of a crack. Medical History, Vol. 23, 1995, p. 339-345.
-
Buezas F. S., Rosales M. B., Filipich C. P. Damage detection with genetic algorithms taking into account a crack contact model. Engineering Fracture Mechanics, Vol. 78, 2011, p. 695-712.
-
Bouboulas A. S., Anifantis N. K. Finite element modeling of a vibrating beam with a breathing crack: observations on crack detection. Structural Health Monitoring: An International Journal, Vol. 10, 2010, p. 131-145.
Cited by
About this article

This article was support by the National Natural Science Foundation of China (Grant No. 11772115).
