Abstract
In order to extract impulse components from bearing vibration signals with strong background noise, a fault feature extraction method based on multi-scale average combination difference morphological filter and Frequency-Weighted Energy Operator is proposed in this paper. The average combination difference morphological filter (ACDIF) is used to enhance the positive and negative impulse components in the signal. The double-dot structure element (SE) is used instead of zero amplitude flat SE to improve the effectiveness of fault feature extraction. The weight coefficients of the filtered results at different scales in multi-scale ACDIF are adaptively determined by an optimization algorithm called hybrid particle swarm optimizer with sine cosine acceleration coefficients (H-PSO-SCAC). At last, as the Frequency-Weighted Energy Operator (FWEO) outperforms the enveloping method in detecting impulse components of signals, the filtered signal is processed by FWEO to extract the fault features of bearings. Results on simulation and experimental bearing vibration signals show that the proposed method can effectively suppress noise and extract the fault features from bearing vibration signals.
1. Introduction
Vibration signals are often used in the condition monitoring and fault diagnosis of mechanical equipment. If a localized defect occurs in rolling element bearing, periodic transient impacts will occur during rotation, by analyzing the vibration signals, the fault features can be extracted. Bearing faults mainly occur on the inner race, the outer race and the rolling elements. The vibration produced by these defects are often non-stationary and non-linear, and the fault information contained in the periodic impacts is always affected by strong background noise [1]. As a result, the fault feature extraction from vibration signals under strong background noise has been one of the hot topics and one of the unsolved difficulties.
Scholars have put forward many solutions to this problem, such as envelope demodulation [2], wavelet transform [3], empirical mode decomposition [4] (EMD), minimum entropy convolution [5] (MED), spectral kurtosis [6], cepstrum pre-whitening [7], cyclostationary theory [8] and so on. All these methods have achieved some effects on fault feature extraction, but some problems still exist. For example, the EMD is seriously affected by mode mixing and end effect. Thus, ensemble empirical mode decomposition (EEMD) method is proposed by Wu and Huang [9] to reduce the influence of mode mixing, however, the amplitude of white noise and the number of ensembles are still hard to choose. The MED method can be used to reduce the background noise but only the single pulse signal is sensitively detected. To overcome the shortcomings of MED, maximum correlation kurtosis deconvolution [10] (MCKD) is proposed which is able to extract periodic impact components in the signal. However, there are also many disadvantages exist in MCKD. One is the rigorous requires for input parameters, only when all the parameters are set properly, can the superiority of MCKD be highlighted. Another is the number of sampling points are changed in the resampling process. Recently, the propose of improved MCKD reduces the number of input parameters [11], and the stability of the filtered results is better than the traditional MCKD.
Morphology filter is used as a nonlinear analysis method, which was firstly used to analyze images, has received widely acceptance and has become a popular method for fault detection in rotating machines. The theory is used to extract the morphological characters of a signal by geometrical shape matching between it and the SE. If the morphological characters of the signal are similar to those of SE, they can be preserved. Nikolaou et al. [12] first using the morphology filter to extract the impulsive signals produced in bearing faults. They paid much attention to the relationship between the SE length and the filtering effect, and also suggested that the length was around 0.6 times the pulse repetition period. Hu et al. [13] used the morphological gradient (MG) operator to pick up both positive and negative impulses from vibration signals successfully. Dong et al. [14] put forward the average operator (AVG) for the impulse components extraction, and the length of SE was determined by an indicator called signal-to-noise ratio (SNR). Raj et al. [15] introduced the self-complementary Top-Hat (STH) operator for fault feature extraction, the filter is easily constructed with high computational efficiency which proved to be effective. Recently, A new morphology filter construction method is proposed in Ref. [16] called the average combination difference morphological filter (ACDIF), which is the fusion of four basic operators. The ACDIF is able to extract positive and negative impulses for suppressing the background noise. The method is also proven to be more effective than some typical morphology filters, such as, the AVG. The above studies are part of single-scale morphology filters, however, the bearing fault features are usually distributed over multi-scales, only single-scale analysis will lead to the lose of valid information. As a result, multi-scale morphology filter is proposed in Ref. [17] where the original signal is filtered at different scales by using different SEs, and the final filtered result is obtained by averaging the results acquired at different scales.
Recently, multi-scale morphology filter has been widely used [18, 19], but when the scale is too large, the morphology filter will ignore some useful components in the original signal when reducing noise, which may lead to the loss of fault features. So, the traditional multi-scale morphology filter by averaging may not be the optimal choice. Particle swarm optimization is used in Ref. [20] to adaptively obtain the weight coefficients of the filtered results at different scales, and the weighted results at different scales are used to construct the final filtered result. Y. Li [21] et al. pointed out the existing problems of multi-scale morphology, then diagonal slice spectrum is introduced to select the optimal scale in morphology analysis, which is also proved to be capable of extracting the impulsive feature of the bearing vibration signals.
As a result, in this paper, multi-scale ACDIF and Frequency-Weighted Energy Operator (FWEO) is used to extract fault features from bearing vibration signals immersed in heavy background noise. The main contribution of this paper is the use of multi-scale ACDIF which is adopted only in single scale previously for the preservation and enhancement of the information concerning bearing fault. The proposed multi-scale ACDIF uses the double-dot SE instead of zero amplitude flat SE to improve the fault feature extraction ability and the optimal weight coefficients in the multi-scale ACDIF is selected adaptively by hybrid particle swarm optimizer with sine cosine acceleration coefficients (H-PSO-SCAC) algorithm. Moreover, to highlight the demodulation performance, an envelope-derivative operator called FWEO is adopted to extract the information about fault features of bearing, which improves the performance over the traditional enveloping method.
The organization of the rest of this paper is as follows: Section 2.1 and 2.2 provide the basic operator of morphology filter and the construction method of ACDIF. Section 2.3 reviews the definition of multi-scale morphology filter briefly. In Section 2.4, the H-PSO-SCAC based optimal weight coefficients selecting method is introduced. The basic principle of FWEO is introduced in Section 3. Section 4 summarizes the proposed method of fault feature extraction for rolling element bearing. The effectiveness of the method is verified by simulation and experimental bearing fault signals respectively in Section 5 and 6. Finally, some conclusions are drawn in Section 7.
2. Multi-scale morphology filter
2.1. Basic operator of morphology filter
Mathematical morphology was first proposed by Matheron and Serra as an image processing tool [22], which can simplify the amount of data in the images and removes irrelevant information while retaining important features. Then, in 1987, morphology filter was used as a nonlinear data processing method for 1-D time series [23].
There are four basic operators when using morphology filter, including, erosion, dilation, opening and closing, meanwhile the opening and closing operators are composed of erosion and dilation operators. Let be the 1-D discrete signal that is the function over a domain . Let be the SE and the discrete function over a domain . Both and are integers, . Thus, four basic operators can be defined as:
Dilation:
Erosion:
Opening:
Closing:
where in Eq. (1)-(4), , , and represent erosion, dilation, opening and closing operator respectively while max and min represent maximum and minimum values. In theory, the erosion operator can smooth negative impulses and reduce positive ones while the dilation operator has an opposite effect. The closing operator can be used to preserve positive impulses and eliminate negative ones. In contrast, the opening operator is able to extract negative impulses.
2.2. The definition of ACDIF
ACDIF [16] is constructed by combining four basic operators. At first, a combination of dilation operator and closing operator is defined called Dilation-Closing operator and Closing-Dilation operator:
Then, a combination of erosion operator and opening operator is defined called Erosion-Opening operator and Opening-Erosion operator:
Thus, the ACDIF can be defined as:
where the and can be defined as:
By using ACDIF, it can not only suppress noise, but also improve the impact characteristics of signals
2.3. Multi-scale morphology filter
The main idea of multi-scale morphology filter is to analyze the signal at different scales by using different SEs. The denoising ability of large-scale SE is relatively strong, and it can reflect the contour features of signals, but some detail information may be neglected. A small-scale SE can preserve the detail features of the signal, but the ability of denoising is relatively weak. Thus, multi-scale morphology filter seems to be more proper than single-scale morphology filter when applied to complicated bearing fault signals.
Let be the scale, the SE at scale is defined as:
Then the multi-scale ACDIF at scale can be expressed as:
The multi-scale filtered results are usually obtained by averaging the filtered results at all scales or the sum of weighted filtered results at all scales. In this paper, the weighted results are calculated which can be expressed as:
where , denotes the minimum and maximum SE scale, represents weight coefficient of the filtered result at scale and denotes the number of all selected SE scales.
2.4. The process of adaptive selection of weight coefficients
SE is also an important operator for morphology filter, which has a great influence on the filtered results. SE is mainly distinguished in shape, amplitude and length, commonly used shapes of SEs include cosine, semicircle, triangle, flat and their combination. Due to the focus of many studies are the optimal selection of SE scale, to improve the computational efficiency, flat SE with a magnitude of zero has been widely used. Recently, a new SE called double-dot is proposed by Chen [24], which is proved to be better than flat SE in fault feature extraction. Therefore, in this study, the double-dot SE is used instead of the commonly used flat SE. For double-dot SE, when the scale 1, the SE is {1,0,1}; when 2, the SE is {1,0,0,1}; when 3, the SE is {1,0,0,0,1}, and so on.
To adaptively select the weight coefficients of SE scale, a newly proposed H-PSO-SCAC method is used. The H-PSO-SCAC is proposed to solve the problem existing in the traditional particle swarm optimization (PSO) method, such as premature convergence and easily trapped in the local optimum solution, which has been proved to achieve good results [25].
Assuming that the size of the population is and the dimension of the search space is , the position of the th particle can be represented by a vector as (, , …, ). The velocity of a particle is denoted by vector (, , …, ). The optimal position vector of th particle is represented by (, , …, ), called personal best position and the best position of the population is denoted as (, , …, ). The position and velocity are initialized randomly and updates to the D-dimension of the particle. The process of the standard PSO is expressed as:
where and are the cognitive component and the social component respectively. denotes the inertia weight and , are random number between 0 to 1.
In H-PSO-SCAC, the modification is as follows:
First, and are defined as:
where represents the th iteration and denotes the maximum number of iteration.
Second, is defined as:
where , denotes a random number between 0 to 4, and is the current iteration number.
Third, the population initialization method is changed which can increase the opportunities of reaching the global optimal solution by fifty percent [25]:
The initial population is randomly chosen as ( 0), 1, 2, …, and 1, 2, …, , then, the reverse population is calculated as:
where and are population position at dimension’s max value and min value respectively. Finally, the smaller half of and are selected and combined as the initial position.
Forth, the search form described in Eq. (16) is modified as:
where , and are defined as:
where is the mean fitness value in the first iteration, is the current iteration and is the fitness of th particle.
As the correlation kurtosis (CK) can evaluate the impact characteristics of a signal, which means the larger CK value corresponds to the more obvious impact components in the signal. Hence, the maximum CK is chosen as the fitness function in the optimization process which can be expressed as:
where represents the discrete signal, denotes the length of the signal, denotes the period of interest, represents the order of shift. CK overcomes the disadvantage that kurtosis cannot reflect specific signal characteristics. When CK is applied to fault diagnosis of rolling element bearings, the is set to be failure cycle. As a result, when a localized defect occurs, the impulse signal corresponds to the bearing fault cycle has the maximum CK, while the CK of other signals is relatively small.
3. The definition of FWEO
The Teager-Kaiser Energy Operator (TKEO) is original proposed to non-linear speech processing, which can effectively enhance transient impacts. As a result, it has been widely used in feature extraction of bearing faults in recent years.
For continuous signals , the TKEO can be expressed as [26]:
where the and represent the first and second derivative respectively.
For discrete signals , the TKEO can be expressed as:
Eq. (26) shows that only three discrete points are used when the TKEO is calculated each time which provides both better time resolution and demodulation speed, so it is suitable for detecting transient components in signals.
For general modulated signal , its analytical signal is defined by:
where is the Hilbert transform of , denotes the the instantaneous amplitude of the signal, is instantaneous phase. Thus, the instantaneous energy can be defined by the amplitude square of the signal:
To conserve the similarity with TKEO, Toole et al. [27]proposed the FWEO by applying the weighting filter to Eq. (28). If the Fourier transform of is , the harmonic property is used which is then selected as the weighting filter [27]:
For discrete signals , the FWEO can be expressed as:
where represents the Hilbert transform of discrete signal, and .
The FWEO has a better demodulation ability for both amplitude and frequency modulation signals. At the same time, research shows that the FWEO method is able to detect signal impulsiveness and improves performance over the TKEO and enveloping method [28].
4. Summary of the proposed method
The ACDIF has the properties of positive and negative impulse components enhancement, which is conveniently calculated and multi-scale ACDIF is proposed to prevent the loss of some valid information by using signal-scale ACDIF. Double-dot SE is used instead of zero amplitude flat SE. The weight coefficients of multi-scale ACDIF are utilized as the particle in H-PSO-SCAC, and CK is regarded as fitness value while maximum CK denotes the optimal result. Hence, the particle that corresponds to the largest fitness value can be used to get the final filtered result of multi-scale ACDIF. At last, FWEO is applied to the filtered results by multi-scale ACDIF to extract the fault features of bearings. The flowchart of the proposed method in this paper is shown in Fig. 1 and the detailed processes are described below.
Fig. 1Flowchart of the proposed method
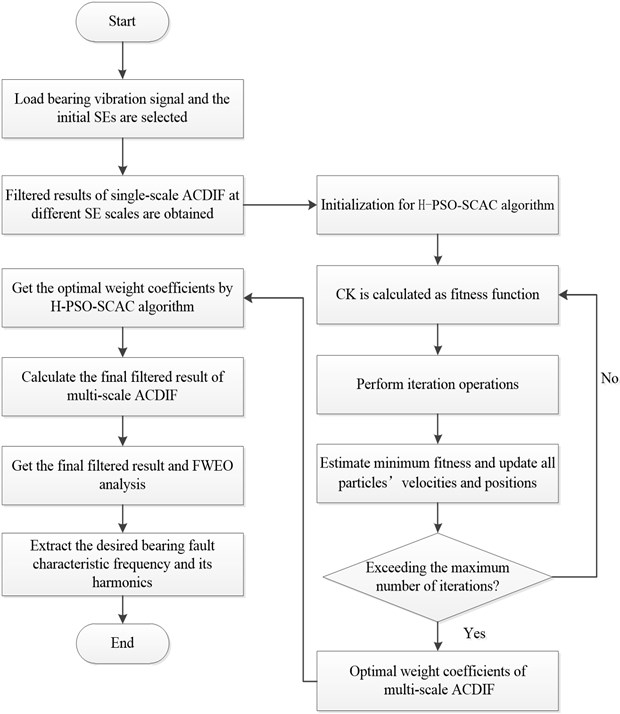
Step 1. The original bearing fault vibration signal is obtained, the SE scales are selected from to and the filtered results of single-scale ACDIF at different SE scales are calculated.
Step 2. Initialize some important parameters in H-PSO-SCAC. To select the optimal weight coefficients of the multi-scale ACDIF adaptively, the number of particles is set to be 50, 0.8 and 3.5 which are mentioned in Eq. (19). The weight coefficients are chosen between 0 and 1 and the maximum iteration number is 100.
Step 3. Based on the results of Step 2, the original signal is processed by multi-scale ACDIF and the final filtered result is achieved.
Step 4. The FWEO is applied to the results in step 3, and the fault features of bearings are extracted.
5. Simulation verification
5.1. Simulation signal
To verify the effectiveness of the proposed fault feature extraction method in this paper, a simulation signal is established and the model of simulation signal is:
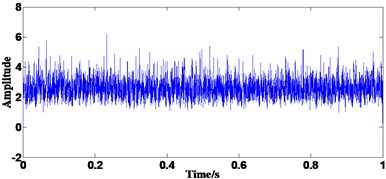
In Eq. (31), the value of the rotating frequency is 42 Hz, is the amplitude modulation which cycle is 1/, and 42 Hz. 3200 is the natural frequency of the system and 0.05 is the damping coefficient, 0.01 represents the delay caused by rolling element slippage in th cycle. The repetition period of the impulses is 1/185 s which means the fault characteristic frequency is 185 Hz. The harmonic is applied to simulate the interference components existing in the signal while the and denotes 50 Hz and 100 Hz, respectively. The signal is used to simulate the random noise which can be applied by MATLAB using (1, ), while equal to the length of the signal. The sampling frequency in simulation is 32768Hz while the length of the signal is 1 second.
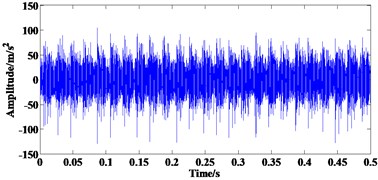
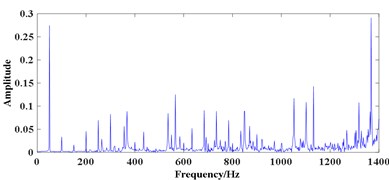
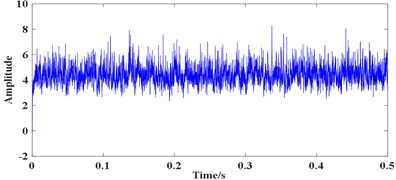
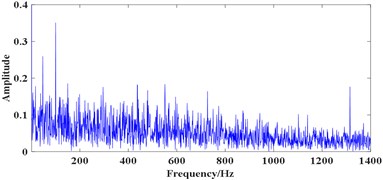
Fig. 2 describes the simulation signal and its FFT spectrum. It can be seen from Fig. 2(a) that periodic impulses are submerged by strong background noise which can hardly be observed. Due to the influence of noise and interference components 50 Hz and 100 Hz, it is difficult to find the fault characteristic frequency and its harmonics in Fig. 2(b). This means some other method is needed for the fault feature extraction of simulation signal.
Fig. 2Simulation signal: a) time domain waveform, b) FFT spectrum of a)
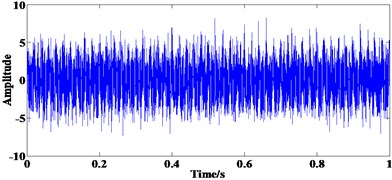
a)
b)
5.2. Simulation analysis
Then the proposed method is applied to the simulation signal. As is shown in Ref. [29] that the optimal SE scale is closely related to both the sampling frequency of the signal and the points in a fault cycle. To get a better preference of multi-scale morphological filter, the maximum SE scale should between 0.2 to 0.3 times of the points in a fault cycle and 0.2 times is chosen in this study. In the simulation, the sampling frequency is 32768 while the fault characteristic frequency is 185 Hz, so the points in a fault cycle is about 177 and the maximum SE scale is 35. What’s more, as the adjacent SE scale has the similar filtering result [16], the SE scales are set to:
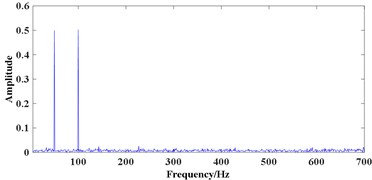
Hence, 12 SEs are used in the multi-scale ACDIF. Fig. 3(a) shows the convergence curve, the optimal fitness value is 3.03×10⁻¹⁴ after 12th iteration while the optimal weight coefficients are:
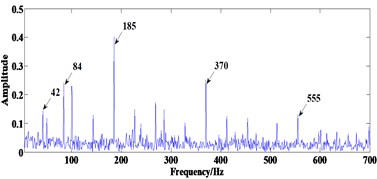
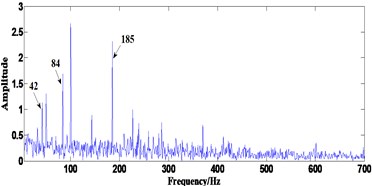
After the acquiring the optimal weight coefficients, the filtered result of multi-scale ACDIF is obtained which is shown in Fig. 3(b). Fig. 3(c) shows the demodulation result of the filtered signal by FWEO where the rotating frequency 42 Hz and its harmonic 84 Hz, the fault characteristic frequency 185 with two of its harmonics 370 Hz and 555 Hz are prominent. Moreover, the sidebands modulated by rotating frequency are able to be observed. As a result, the extracted fault features indicate the existence of a defect on the inner race.
Fig. 3Results of the proposed method in simulation: a) the convergence curve, b) the final filtered result, c) FWEO spectrum of b)
a)
b)
c)
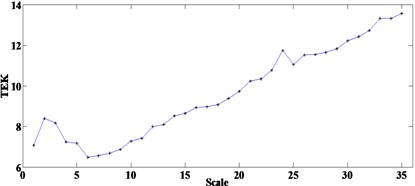
Fig. 4Results of optimal single-scale ACDIF in simulation: a) relationship between SE scales and TEK, b) FWEO spectrum of optimal filtered result
a)
b)
By comparison, optimal SE scale is selected using the method proposed in Ref. [16] by teager energy kurtosis (TKE), then the optimal single-scale ACDIF will still be demodulated by FWEO and the results are shown in Fig. 4. Fig. 4(a) shows the relationship between the SE scales 1-35 and the TEK. The SE scale of 35 corresponds to the maximum TEK will then be used in optimal scale ACDIF. Fig. 4(b) displays the FWEO spectrum of the optimal filtered result where the fault characteristic frequency is prominent but its harmonics can hardly observed which is no better than the result in Fig. 3(c). Hence, the proposed method may be more suitable for the fault feature extraction in this simulation.
6. Experimental verification
6.1. Experimental data
In this study, a bearing test rig is used to further evaluate the effectiveness of the proposed method for fault feature extraction of rolling element bearing. The test rig showed in Fig. 5(a) consists several main components which are bearing support structure, main shaft, experimental bearing, lubricating oil system, servo-driven motor, radial loading device, axial loading device and control system.
Fig. 5Experimental setup: a) the test rig, b) bearing defect on the inner race
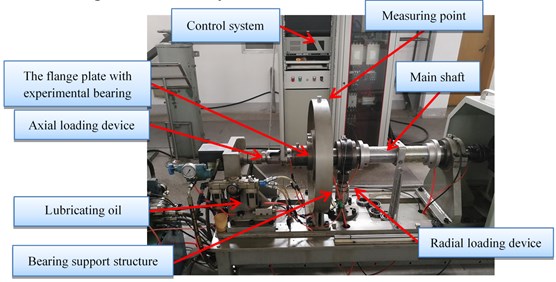
a)
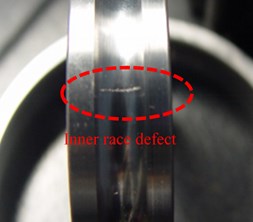
b)
The experimental bearing type is 6010, the outer and inner diameter of the bearing are 80 mm and 50 mm respectively, thus the pitch diameter is 65 mm. The diameter and number of rolling elements are 9 mm and 13. The contact angle is 0°.
The experimental signals are collected by the B&K vibration test system where the models of the acceleration sensor, the signal conditioning and acquisition module are B&K4354B-004 and B&K3053-B-120, respectively. Two conditions are simulated in the experiment when collecting the vibration signals: (1) normal bearing condition (signal 1) (2) bearing with a defeat on the inner race generated by laser wire-electrode cutting (shown in Fig. 5(b), signal 2).
To make the fault feature extraction more difficult, the measuring point is chosen on the outside of bearing support structure (12 o’clock, shown in Fig. 5(a)), the driving motor is set to rotate at a speed of 3000 r/min. The sampling frequency of the data acquisition device is set to 65536 Hz. The fault characteristic frequencies for different localized defects can be calculated by the following equations:
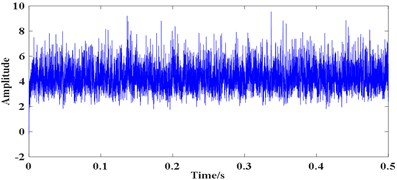
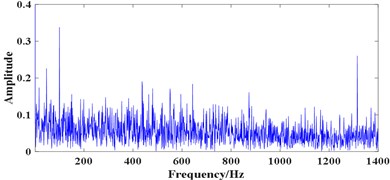
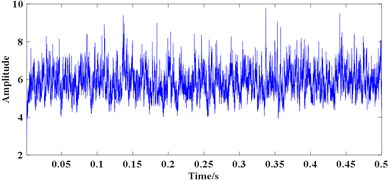
where , and represent the ball pass frequency of the inner race (BPFI), the ball pass frequency of the outer race (BPFO) and the ball spin frequency (BSF), respectively. Therefore, the theoretical BPFI, BPFO and BSF are 370 Hz, 280 Hz and 177.09 Hz. The time domain waveform of the collected vibration signals (all the experimental signals are collected in the radial direction) and their FFT spectrum are shown in Fig. 6.
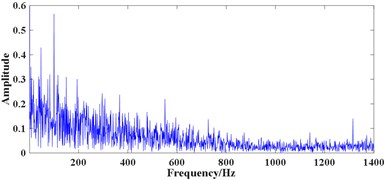
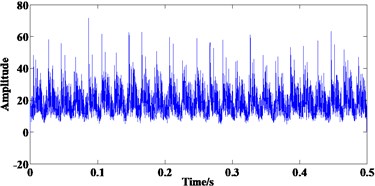
Fig. 6(a) and (b) shows the time domain waveform of signal 1 and its FFT spectrum, respectively. Fig. 6(c) shows the time domain waveform of signal 2 with the length of 32768 points, where periodic impulses are submerged by strong background noise and can hardly recognized. The FFT spectrum of signal 2 is shown in Fig. 6(d) which displays a complicated frequency map containing many frequency components. The BPFI cannot be detected easily, hence, judging whether the bearing is damaged or not by the FFT spectrum of the original signal is difficult.
Fig. 6Experimental bearing vibration signal: a) time domain waveform of signal 1, b) FFT spectrum of a), c) time domain waveform of signal 2, d) FFT spectrum of c)
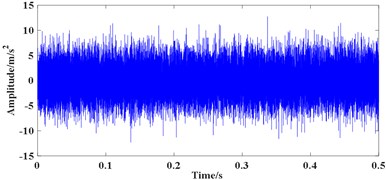
a)
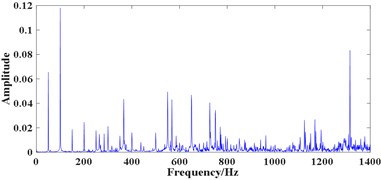
b)
c)
d)
6.2. Fault feature extraction based on proposed method
Then the proposed method is applied to the experimental signals. For bearings with inner race failure, as the sampling frequency and BPFI are 65536 Hz and 370 Hz respectively in the experiment, so the points in a fault cycle is about 177 and the maximum SE scale is 35 (0.2 times of the points in a fault cycle). To avoid selecting the adjacent SE scales, the SE scales are set to:
which is similar to the simulation. So, 12 SEs are used in the multi-scale ACDIF and the H-PSO-SCAC is used to select the optimal weight coefficients. Similarly, for bearing with outer race failure, fifteen SE scales are chosen which are:
for bearing with rolling element failure, totally 25 SE scales are selected which are:
For signal 1, as the selection SE scales are closely related to the fault characteristic frequency, for a bearing with no defects, the proper SE scales may be hard to choose. So, all three range of SE scales mentioned above are used, results are shown in Fig. 7, where the filtered results are shown in (a), (c) and (e), corresponding FWEO spectrum are shown in (b), (d) and (f). As can be seen from Fig. 7(b), (d) and (f), only the spectral lines of 50 Hz and 100 Hz are prominent which represent the rotating frequency and its harmonic (mainly caused by the misalignment existing in the test rig). The BPFI, BPFO and BSF are unable to be observed which is consistent with the actual working condition of the rolling element bearing.
Fig. 7Processing results of signal1 using the proposed method: a) the filtered result using e¨1, b) FWEO spectrum of a), c) the filtered result using e¨2, d) FWEO spectrum of c), e) the filtered result using e¨3, f) FWEO spectrum of e)
a)
b)
c)
d)
e)
f)
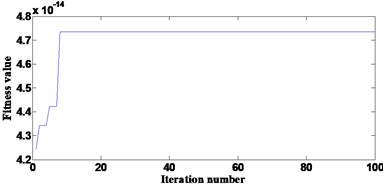
Subsequently, signal 2 is analysed. As depicts in Fig. 8(a), based on the convergence curve, the optimal fitness value is achieved after 8th iteration which value is 3.03×10⁻¹⁴. Thus, the corresponding best position of the population at 8th iteration is considered as the optimal weight coefficients which is: [0.815, 0.802, 0.720, 0.185, 0.042, 0.282, 0.052, 0.013, 0.125, 0.022, 0.376, 0.370]
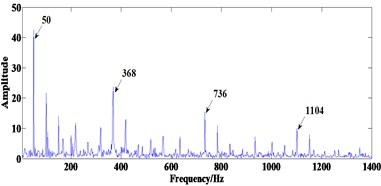
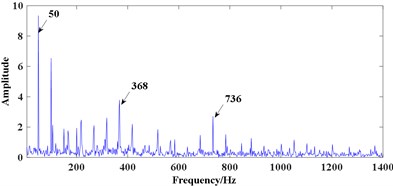
Then the final filtered result of multi-scale ACDIF is obtained which is shown in Fig. 8(b). The FWEO spectrum of the final filtered signal is shown in Fig. 8(c) where the rotating frequency 50 Hz and its harmonic 100 Hz, the frequency component 368 Hz (close to the theoretical value of BPFI, the difference may cause by size error of bearing or the slippage of rolling elements) with two of its harmonics 736 Hz and 1104 Hz are prominent. Moreover, the sidebands modulated by rotating frequency around the BPFI and its harmonics are able to be observed. All the features above clearly indicates the existence of a defect on the inner race.
Fig. 8Processing results of signal 2 using the proposed method: a) the convergence curve, b) the final filtered result, c) FWEO spectrum of b)
a)
b)
c)
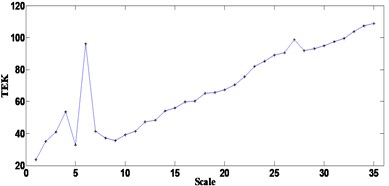
Fig. 9Processing results of signal 2 using optimal signal-scale ACDIF: a) relationship between chosen SE scales and TEK, b) FWEO spectrum using the SE scale 35, c) FWEO spectrum using the SE scale 6
a)
b)
c)
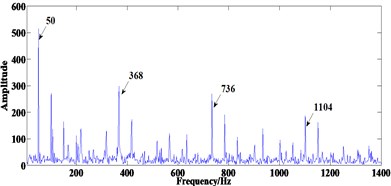
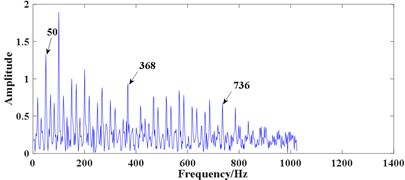
Two methods are used to make comparisons when analysing signal 2, one is similar to the method used in simulation, where the TEK of filtered results at scales 1-35 are calculated and the results are shown in Fig. 9(a). Fig. 9(a) depicts when using the SE scale of 35, the maximum TEK can be achieved. So, the optimal-scale ACDIF is employed by using the SE length of 35, then the FWEO is applied to the filtered signal to extract the fault features of bearing. Fig. 9(b) shows prominent rotating frequency 50 Hz and its harmonic 100 Hz, the BPFI 368 Hz along with one of its harmonic 736 Hz, but the frequency line corresponds to 1104 Hz are unable to observed. Moreover, as the TEK at scale 6 is prominent compared with the adjacent scales, the FWEO spectrum using the SE scale 6 is also calculated and the result is shown in Fig. 9(c) where the BPFI and its harmonics can be clearly observed, which surely indicates the existence of a fault on the inner race. Hence, when the method in Ref. [16] is applied to the experimental signal in this study, using the SE scale corresponds to the maximum TEK may not achieve the optimal result.
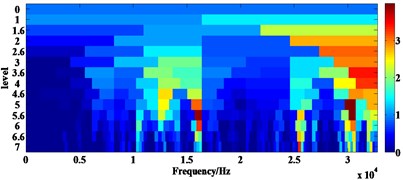
Another method used for comparison is the Fast Kurtogram proposed in [29] and the results are shown in Fig. 10. In Fig. 10(a), the central frequency and bandwidth of the optimal analysis frequency band can be determined as 30208 Hz and 1024 Hz whose square envelope spectrum is shown in Fig. 10(b). In Fig. 10(b), the BPFI 368 Hz and its harmonic 736 Hz are able to be observed but not prominent while the interference frequency components are obvious. Thus, the Fast Kurtogram cannot achieve the ideal results when analysing the signal 2, which further verifies that the proposed method is effective in impulse components extracting from the vibration signal with heavy background noise.
Fig. 10Analysing results of signal 2 using the fast Kurtogram: a) figure of fast Kurtogram, b) square envelope spectrum of signal within optimal analysis frequency band
a)
b)
7. Conclusions
This paper has proposed a new fault feature extraction method for rolling element bearings that can achieve good result by using multi-scale ACDIF and FWEO. The ACDIF is used to extract positive and negative impacts existing in bearing vibration signal and the H-PSO-SCAC can deal with the problem of choosing the optimal weight coefficients. Subsequently, FWEO is applied to the filtered results by using multi-scale ACDIF and the fault features are extracted. Simulation and experimental results show that the proposed method can extract the fault features of rolling element bearing effectively. Moreover, the proposed method would be more suitable for the bearing fault signal with strong background noise when compared with some other methods. The proposed method, however, is time-consuming due to the use of optimization algorithm. Hence the next step in research work is finding more efficient weight coefficients selection method.
References
-
Yu J. B. Bearing performance degradation assessment using locality preserving projections. Expert Systems with Applications, Vol. 38, Issue 6, 2011, p. 7440-7450.
-
Jiang H., Duan C. An adaptive lifting scheme and its application in rolling bearing fault diagnosis. Journal of Vibroengineering, Vol. 14, Issue 2, 2012, p. 759-770.
-
Lei Y., Lin J., He Z., Zi Y. Application of an improved kurtogram method for fault diagnosis of rolling element bearings. Mechanical Systems and Signal Processing, Vol. 25, Issue 5, 2011, p. 1738-1749.
-
Yu D., Cheng J., Yang Y. Application of EMD method and Hilbert spectrum to the fault diagnosis of roller bearings. Mechanical Systems and Signal Processing, Vol. 19, Issue 2, 2005, p. 259-270.
-
Endo H., Randall R. B. Enhancement of autoregressive model based gear tooth fault detection technique by the use of minimum entropy deconvolution filter. Mechanical Systems and Signal Processing, Vol. 21, Issue 2, 2007, p. 906-919.
-
Barszcz T., Randall R. B. Application of spectral kurtosis for detection of a tooth crack in the planetary gear of a wind turbine. Mechanical Systems and Signal Processing, Vol. 23, Issue 4, 2009, p. 1352-1365.
-
Borghesani P., Pennacchi P., Randall R. B., Sawalhi N., Ricci R. Application of cepstrum pre-whitening for the diagnosis of bearing faults under variable speed conditions. Mechanical Systems and Signal Processing, Vol. 36, Issue 2, 2013, p. 370-384.
-
Abboud D., Antoni J., Eltabach M., Sieg Zieba S. Angle\Time cyclostationarity for the analysis of rolling element bearing vibrations. Measurement, Vol. 75, 2015, p. 29-39.
-
Wu Z., Huang N. E. Ensemble empirical mode decomposition: a noise-assisted data analysis method. Advances in Adaptive Data Analysis, Vol. 1, Issue 1, 2009, p. 1-41.
-
Mcdonald G. L., Zhao Q., Zuo M. J. Maximum correlated Kurtosis deconvolution and application on gear tooth chip fault detection. Mechanical Systems and Signal Processing, Vol. 33, 2012, p. 237-255.
-
Miao Y., Zhao M., Lin J., Lei Y. Application of an improved maximum correlated kurtosis deconvolution method for fault diagnosis of rolling element bearings. Mechanical Systems and Signal Processing, Vol. 92, 2017, p. 173-195.
-
Nikolaou N. G., Antoniadis I. A. Application of morphological operators as envelope extractors for impulsive-type periodic signals. Mechanical Systems and Signal Processing, Vol. 17, Issue 6, 2003, p. 1147-1162.
-
Hu Z., Wang C., Zhu J., Liu X., Kong F. Bearing fault diagnosis based on an improved morphological filter. Measurement, Vol. 80, 2016, p. 163-178.
-
Dong Y., Liao M., Zhang X., Wang F. Faults diagnosis of rolling element bearings based on modified morphological method. Mechanical Systems and Signal Processing, Vol. 25, Issue 4, 2011, p. 1276-1286.
-
Raj A. S., Murali N. Early classification of bearing faults using morphological operators and fuzzy inference. IEEE Transactions on Industrial Electronics, Vol. 60, Issue 2, 2013, p. 567-574.
-
Lv J., Yu J. Average combination difference morphological filters for fault feature extraction of bearing. Mechanical Systems and Signal Processing, Vol. 100, 2018, p. 827-845.
-
Zhang L., Xu J., Yang J., Yang D., Wang D. Multiscale morphology analysis and its application to fault diagnosis. Mechanical Systems and Signal Processing, Vol. 22, Issue 3, 2008, p. 597-610.
-
Li B., Hu R. X., Ren G. Q., Fu J. P. Engine fault diagnosis based on a morphological neural network using a morphological filter as a preprocessor. Proceedings of the Institution of Mechanical Engineers, Part D: Journal of Automobile Engineering, Vol. 227, Issue 4, 2013, p. 490-505.
-
Li B., Zhang P. L., Wang Z. J., Mi S. S., Zhang Y. T. Gear fault detection using multi-scale morphological filters. Measurement, Vol. 44, Issue 10, 2011, p. 2078-2089.
-
Deng F., Yang S., Tang G., Hao R., Zhang M. Self adaptive multi-scale morphology AVG-Hat filter and its application to fault feature extraction for wheel bearing. Measurement Science and Technology, Vol. 28, Issue 4, 2017, p. 045011.
-
Li Y., Liang X., Zuo M. J. Diagonal slice spectrum assisted optimal scale morphological filter for rolling element bearing fault diagnosis. Mechanical Systems and Signal Processing, Vol. 85, 2017, p. 146-161.
-
Serra J. Image Analysis and Mathematical Morphology, Image analysis and mathematical morphology. Academic Press, 1983.
-
Maragos P., Schafer R. Morphological filters--Part I: Their set-theoretic analysis and relations to linear shift-invariant filters. IEEE Transactions on Acoustics, Speech, and Signal Processing, Vol. 35, Issue 8, 1987, p. 1153-1169.
-
Chen Q., Chen Z., Sun W., Yang G., Palazoglu A., Ren Z. A new structuring element for multi-scale morphology analysis and its application in rolling element bearing fault diagnosis. Journal of Vibration and Control, Vol. 21, Issue 4, 2015, p. 765-789.
-
Chen K., Zhou F., Yin L., Wang S., Wang Y., Wan F. A hybrid particle swarm optimizer with sine cosine acceleration coefficients. Information Sciences, Vol. 422, 2018, p. 218-241.
-
Randall R. B., Smith W. A. Application of the Teager Kaiser Energy Operator to Machine Diagnostics. 10th DST Group International Conference on Health and Usage Monitoring Systems, 2017.
-
O’toole J. M., Temko A., Stevenson N. Assessing instantaneous energy in the EEG: a non-negative, frequency-weighted energy operator. 36th Annual International Conference on Engineering in Medicine and Biology Society, 2014.
-
Imaouchen Y., Kedadouche M., Alkama R., Thomas M. A frequency-weighted energy operator and complementary ensemble empirical mode decomposition for bearing fault detection. Mechanical Systems and Signal Processing, Vol. 82, 2017, p. 103-116.
-
Antoni J. Fast computation of the kurtogram for the detection of transient faults. Mechanical Systems and Signal Processing, Vol. 21, Issue 1, 2007, p. 108-124.
Cited by
About this article

