Abstract
In order to study the mechanical response of a hard rock tunnel excavated by double shield tunnel boring machine (DS-TBM), a numerical method was introduced to simulate the TBM excavating process. The failure modes of surrounding rock mass described based on the cohesion weakening and frictional strengthening (CWFS) Mohr-Coulomb strain-softening criterion. The characteristics of stress field and plastic zone on the cross and longitudinal section of the tunnel were analyzed in detail, and the results were compared with those in the intrinsic condition (when TBM model is not activated). The simulation results indicate that the stress paths at the vault are relatively simple, and the stress concentration caused by excavation unloading is obviously reduced by lining and backfill grouting, while the sidewall is less disturbed by the excavation of TBM. The invert experiences three unloading processes, due to excavation, the contact between the rear shield and the bottom of surrounding rock, as well as backfill grouting at gap between the lining and the rock mass. The vault has a larger plastic zone than the invert, attributing to the geometrical difference between the cutter-head and the front shield, as well as the conicity of the front and rear shields. The area of plastic zones gradually increases along the tunnel route, but it becomes stable after the rear shield.
Highlights
- The deep hard rock tunnels were numerical analyzed in intrinsic and DS-TBM conditions.
- The stress concentration value at about 45% UCS may cause spalling failure in hard rock.
- The stress paths in activated DS-TBM condition were simulated and obtained.
- The plastic zones of the vault are larger than those of the invert in DS-TBM tunnel.
1. Introduction
TBM is automated large-scale tunnel construction equipment, which integrates technologies of mechanical engineering, electric and electronic engineering, information engineering, as well as telemetry and tele-control system engineering. It can achieve simultaneous and continuous operations of tunnel construction, such as excavation, support and slag-out, as well as guide and monitor all operations. With the development of the tunneling construction method, modern Tunnel Boring Machine (TBM) can excavate in almost all rock conditions [1]. Double shield tunnel boring machine (DS-TBM) is a better choice in hard rock tunneling engineering under high in situ stress in deep-buried ground due to the efficient excavation ability. However, the brittle failure behaviors of hard rock affect all aspects of TBM construction, and greatly reduce the TBM advance speed. Therefore, it is significant to study mechanical response of brittle hard rocks in TBM tunneling.
For the mechanized tunnel design in deep-buried tunnel, the complex interactions between the surrounding rock and the tunnel machine, as well as system-components of machine and tunnel support should be analyzed in detail [2]. Hence, the 3D models including all of those constituent parts are more suitable for simulating the interactions and reducing errors introduced by plane-strain hypothesis. A first demonstration of such a 3D TBM model has been provided by Barla et al. [3]. In order to analyze the practicability of TBM, they developed a 3D numerical model including cutter-head, shields, grippers, jack pressure and linings based on engineering geological condition of Lyon-Turin Base Tunnel in squeezing rock conditions. In addition, Zhao et al. [1] put forward a more comprehensive description to characterize a 3D model, taking into account the improvements related to the simulation of interaction between rock mass and TBM. The case studies of the Brenner Base Tunnel in brittle ground and the Lyon-Turin Base Tunnel in squeeze ground were considered in that study to further illustrate the model. Hasanpour et al. [4] created a detailed 3D finite difference (FDM) model. Flac3D was used to simulate and evaluate the feasibility of using DS-TBMs in deep-buried tunnels. Longitudinal displacement profiles and contact force profiles on the front and rear shields were examined. Also, maximum thrust force needed for overcoming friction was calculated, and the loads on the shields and linings were predicted by the model. Moreover, a comprehensive 3D model used to simulate single shield, double shield and universal double shield TBM was described by Hasanpour [5] for excavating deep-buried long tunnels.
The above models mostly concentrated on squeezing behaviors of soft rocks, however, brittle behaviors of hard rock are more complicated in TBM tunneling. For brittle rock ground, Zhao et al. [6] took Brenner Base Tunnel as a research object and introduced the modified Hoek-Brown criterion [7] in the simulation program to represent the brittle behaviors of rocks. They found the failure behavior of the surrounding rock with a sub-vertical fault zone parallel to the tunnel axis, was neither ductile nor brittle, but controlled by the combination of them. However, surrounding stress fields and failure characteristics in brittle rock mass in excavating process are still ambiguous. Therefore, it is necessary to further analyze brittle behaviors of hard rock in TBM tunneling.
Before conducting the numerical study of this paper, another important thing is how to model the brittle failure of rock mass. The traditional methods to simulate rock mass failure are usually based on linear Mohr-Coulomb failure criteria or non-linear criteria (such as Hoek-Brown failure criteria), which have not been successful in predicting the depth and extent of failure in hard rock deep-buried tunnel with high in situ stress [8-10]. Hence, the present constitutive model with cohesion weakening and frictional strengthening (CWFS) [11] was used in this simulation to overcome the shortcomings of traditional methods, and to observe the characteristics of brittle failure, which the formation of tensile cracks precedes failure in shear.
This paper, Flac3D (Fast Lagrangian Analysis of Continua) was utilized to evaluate the practicability of DS-TBM in deep-buried high geostress tunnel. The CWFS criterion was introduced in the simulation program to represent the brittle behavior of surrounding hard rocks. Longitudinal stresses of surrounding rock, as well as circumferential stresses, radial stresses and plastic zones in key cross sections were obtained and analyzed.
2. Numerical simulation method
2.1. Construction of the rock mass model
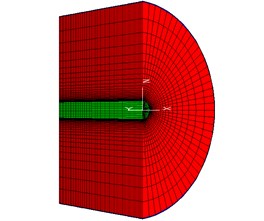
In this study, a DS-TBM excavation model of deep-buried tunnel was established using 3D FDM model and the Flac3D computer codes. The required parameters for 3D model of excavation by a DS-TBM are based on information from the construction of Brenner Base Tunnel [3, 12]. In addition, the influences of water and consolidation are not taken into account in this paper.
Based on the symmetrical assumption by the tunnel axial vertical plane, only a half of the model is constructed. In order to reduce the effect of boundary and shorten the computation time of the model, the length of the model along the tunnel axis () is designed to be 76 m (8), and the radius of the circular outer boundary is designed to be 56.64 m (6), where is equal to 9.44 m.
The mesh discretization in the direction of the axis is 1 m (excavation length). In terms of mesh grading in the transversal plane, it is suggested to use fine meshes [13] near the excavation boundary to capture the extent and shape of the plastic zone in the case of local failure (rock spalling). Hence, the precise zones are used around the tunnel profile, as well as the coarse meshes are used for the areas far away from the tunnel profile, as shown in Fig. 1. In order to demonstrate the spalling behavior of excavation of deep-buried tunnel, it is assumed that (lateral pressure coefficient) is 2 in rock mass and (vertical stress) is equal to 24 MPa.
Fig. 1The 3D meshes of the rock mass (an initial stage)
After creating the 3D model, the following boundary conditions are applied:
• Preventing displacements in the vertical () and horizontal () directions at the circular outer boundary;
• Preventing displacements in the horizontal direction () at the vertical outer boundary;
• Preventing displacements along the excavation direction () on the front and rear outer surfaces.
2.2. Numerical modeling of the main TBM components
The DS-TBM body consists of a cutter-head, a front shield, and a rear shield. In this paper, the TBM model is quoted from the reference [3]. The cutter-head is eccentrically designed, and the axis of the cutter-head deviates 20 mm from the axis of the front shield, so as to increase the clearance between the vault and the shield, and to reserve space for the deformation of surrounding rock. According to Zhao et al. (2012), the grippers were proved to have a limited influence on the excavation processes of TBM, as it was applied at a distance from the work face. Therefore, the impact of grippers was not considered in the present study.
Since each element is a hollow thin-walled shape, the equivalent density of the element is obtained by dividing the total weight of the machine by the volume of the shield in order to consider the gravity influence of internal components. The density value of the lining concrete was risen from the real value of concrete 25 kN/m3 to an equivalent value 30 kN/m3 by considering the back-up-trailer [3]. The geometry of the TBM and the parameters of the main elements are given in Table 1.
2.3. Brittle behavior (Spalling) of rock mass
Brittle failure, mainly in the form of rock spalling and potential strain burst, is generally a process of rock damage in crystalline rocks (such as granite) near the excavated boundary under in-situ stress conditions [14]. The conventional linear Mohr-Coulomb failure criterion or non-linear failure criterion such as the Hoek-Brown failure criterion cannot correctly describe the brittle failure process of rock [15].
Hajiabdolmajid [11], based on laboratory experiments, put forward a CWFS (cohesion weakening and frictional strengthening) strain softening criterion which is suitable for demonstrating the brittle failure process of rock mass. The constitutive model with CWFS implicitly captures the phenomenon that the formation of tensile cracks precedes shear failure in brittle failure process. In this paper, the shear strength is based on the reference [11], and the relationships between the key parameters and the plastic strain are shown in Fig. 2, as well as the remaining parameters as shown in Table 2. The compressive strength and the tensile strength of the rock mass are 128 MPa and –3.7 MPa, respectively [9].
Table 1Geometry and technical parameters of major components [3]
Cutter-head | Shield | ||
Diameter | 9.30 m | Front shield diameter | 9.24 m |
Length | 0.75 m | Rear shield diameter | 9.18 m |
Thickness | 3 cm | Thickness | 3 cm |
Overboring | 0.14 m | Front shield length | 5 m |
Rear shield length | 6 m | ||
Thrust force of cutter | 0.25 MPa | Friction coefficient | 0.3 |
200 GPa | 200 GPa | ||
0.3 | 0.3 | ||
Density | 31.2 g/cm3 | Density | 1412.8 g/cm3 |
Lining | Backfill | ||
Diameter | 9.0 m | Softening phase | |
Thickness | 0.45 m | 0.5 GPa | |
Friction coefficient backfill-lining | 0.3 | 0.3 | |
Density | 2.4 g/cm3 | ||
Hardening phase | |||
36 GPa | 1.0 GPa | ||
0.2 | 0.3 | ||
Density | 3.0 g/cm3 | Density | 2.4 g/cm3 |
Table 2Mechanical parameters of rock mass [11]
/ GPa | Density / (kg/m3) | Dilation / ° | Tension / MPa | |
25 | 2650 | 0.25 | 30 | 8.1 |
Fig. 2Shear strength parameters with a CWFS model [11]
![Shear strength parameters with a CWFS model [11]](https://static-01.extrica.com/articles/19884/19884-img2.jpg)
2.4. Modeling the rock mass-TBM interactions
In this paper, interface elements applied to the tunnel perimeter and shields were used to simulate the surfaces between the shields and the surrounding rock. In order to represent the effect of the compressible backfill material, similar interface elements were utilized to model the surfaces of the linings and the rock mass. Normal and shear stiffness values (, ) were specified in interface elements in order to model the rock mass-TBM interactions. and were selected according to the empirical formula given in [16]:
where is bulk modulus, is shear modulus, and is the smallest width of an adjoining zone of the normal direction.
In addition, the interactions between the shields and the surrounding rock were simulated by utilizing the interface elements considering the non-uniform clearance between them. The faces at the front and rear shields are shown in Fig. 3. According to the reference [9], the skin friction coefficient of 0.3 was selected for all the interfaces.
Fig. 3Cross sections of DS-TBM: a) front shield, b) rear shield [3]. It is note that the yellow curved line is the contact part of the invert and the front shield
![Cross sections of DS-TBM: a) front shield, b) rear shield [3]. It is note that the yellow curved line is the contact part of the invert and the front shield](https://static-01.extrica.com/articles/19884/19884-img3.jpg)
a)
![Cross sections of DS-TBM: a) front shield, b) rear shield [3]. It is note that the yellow curved line is the contact part of the invert and the front shield](https://static-01.extrica.com/articles/19884/19884-img4.jpg)
b)
2.5. Numerical modeling of the excavation process
The excavation process was modeled according to the construction design of the cutter-head, the front and rear shields of a double shield TBM. There are 40 excavation steps modeled by step-by-step method in this study, and the length of each excavation step is equal to 1 m.
It should be noted that, before excavation, in situ stress was initialized in accordance with the stress and displacement boundary conditions to achieve an initial stress equilibrium. The excavation processes of numerical model are specified as follows:
• Excavate the first step, then the TBM enters the rock mass model. Assign the corresponding parameters to cutter-head, and the thrust force of cutter is applied;
• Excavate the second step, then the cutter-head advances 1 step, and the first ring of the front shield is specified as the corresponding parameters;
• The third to fifth excavation steps are similar to the second excavation step;
• Excavate the sixth step, then the first ring of the rear shield is specified as the corresponding parameters;
• The seventh to tenth excavation steps are similar to the sixth excavation step;
• Excavate the eleventh step, and the first ring of the lining is applied;
• Excavate the twelfth step, and the second ring of the lining is applied;
• In the thirteenth step, the backfill is injected into the gap between the rock mass and the lining by using the softening grouting;
• Start from the fifteenth step, the properties of the backfill are turned into the hardening phase;
• These processes continue until a steady state is reached.
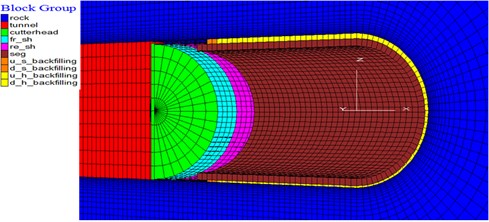
Fig. 4 illustrates the last step of the simulation process.
Fig. 43D model of DS-TBM excavation (final step)
3. Results and discussion of numerical modeling
3.1. The stress analysis method and monitoring objects
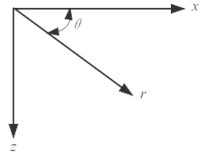
According to Diederichs [7], the dilation displacement of the spalling rock is hard to be reproduced in continuum models because it is discontinuous process after yielding. Therefore, this paper takes the stress and plastic zone as research objects. In the circular tunnel cross section, the stress state of the surrounding rock is generally converted into the circumferential stress and radial stress. The stress components in the rectangular coordinate are converted into the stress components in polar coordinate Eq. (2). The radial stress and the circumferential stress at the vault and invert are equal to the vertical stress component and the horizontal stress component , respectively. The radial stress and the circumferential stress at the sidewall are equal to the horizontal stress component and the vertical stress component , respectively:
where , and are horizontal, vertical and shear stress components, respectively in the rectangular coordinate system; and are radial, circumferential and shear stress components, respectively in the polar coordinate system. The coordinate system is shown in Fig. 5.
Fig. 5Coordinate system of stress transformation
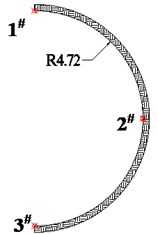
Three monitor points are selected for numerical analysis around the tunnel, and the illustration of point position is shown in Fig. 6(a). In order to further illustrate the internal stress characteristics of surrounding rock, the circumferential stresses and radial stresses of key cross sections are analyzed in detail.
Fig. 6a) Layout and numbers of the measurement points, b) layout and positions of cross sections
a)
b)
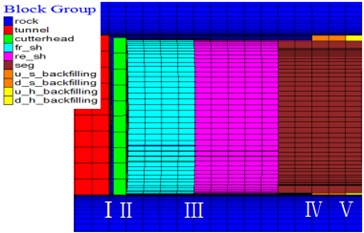
In order to analyze the plastic zone distribution, five cross sections of the tunnel are selected and illustrated. The positions of five cross sections are shown in Fig. 6(b), where position I is the work face, positions Ⅱ and Ⅲ are the faces at the front end of front and rear shields, respectively, as well as positions Ⅳ and Ⅴ are the faces before soften and harden backfill, respectively.
In order to further illustrate the influence of TBM excavation, the plastic zones of the cross sections at the corresponding positions in intrinsic condition are also analyzed, where numerical model in intrinsic condition is excavation model without activating TBM components.
3.2. Intrinsic excavation results
3.2.1. Longitudinal stresses of surrounding rock
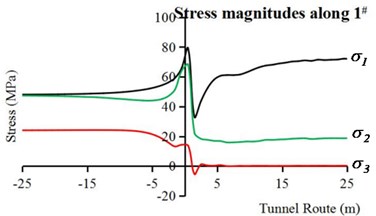
For the intrinsic excavation condition, the stress value of the vault (1#) is equal to that of the invert (3#) due to symmetry of excavation boundary. Therefore, only the longitudinal stress value of the vault (1#) and sidewall (2#) are shown in Fig. 7.
The stress paths of the vault are shown in Fig. 7(a). In the face of the heading, and increase rapidly to about 1.7 times and 1.5 times of their initial values, respectively, as well as drops to approximate three fourths of its initial value, which due to effect of excavation. Behind the work face (excavated part), decreases sharply at first, then increases quickly, and rises to about 1.5 times of its initial value eventually. Meanwhile, drops to approximate half of its initial value quickly, and decreases at first, then increases and finally stabilizes at approximate 0. The above phenomena are stress concentration caused by the stress rotation [17]. In front of the work face (the unexcavated part), and decrease to their initial values, respectively at the face 15 m away from the work face. Meanwhile, decreases slightly at first, then increases obviously, and restores to its initial value at the face 8 m away from the work face.
Fig. 7The stress paths of surrounding rock along the longitudinal direction of the tunnel: a) along point 1#, b) along point 2#
a)
b)
The stress paths of sidewall are illustrated in Fig. 7(b). In the face of the heading, increases rapidly to about double its initial value. Meanwhile, and become about four fifths and six fifths of their initial values, respectively. Behind the work face, , and decrease to 25 MPa, 4.5 MPa and 0 MPa, respectively. In front of the work face, and decrease to their initial values, respectively, and rises to its initial value slowly.
In conclusion, the stress concentration appears in the vault and invert due to excavation in intrinsic condition, and the stress concentration value is about 76 MPa, while the sidewall experiences excavation unloading.
3.2.2. Circumferential stresses and radial stresses
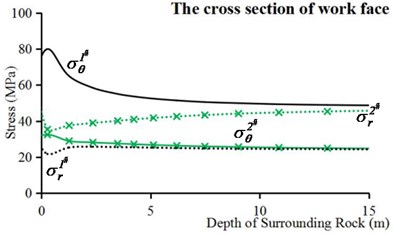
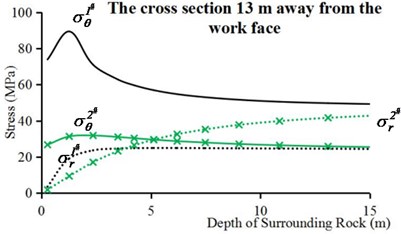
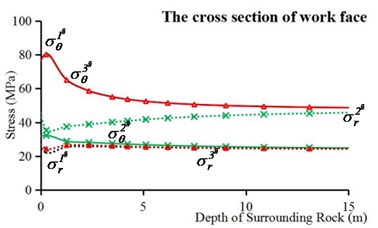
The circumferential stresses and radial stresses are mainly influenced by in situ stresses and excavation effects in intrinsic condition. In this paper, the stresses in two key cross sections are analyzed in detail, where key cross sections are the work face and the face 13 m away from the work face (Corresponding to I and Ⅳ positions in Fig. 6(b)). In order to simplify the illustration, only the stress values of the vault (1#) and the sidewall (2#) are shown in Fig. 8.
As shown in Fig. 8(a), the circumferential stress of point 1# reaches a maximum value of about 80.0 MPa near the tunnel wall, and then decreases to its initial value gradually with the depth increase of surrounding rock. The radial stress of point 1#, however, has a minimum value of approximate 21.0 MPa near the tunnel wall, and then increases to its initial value slowly. In addition, near the tunnel wall, the circumferential stress of point 2# reaches its maximum value of about 32.4 MPa, but the radial stress of point 2# has its minimum value of about 35.3 MPa. With the increase depth of surrounding rock, they restore gradually to their initial values, respectively.
The stresses in the cross section 13 m away from the work face are shown in Fig. 8(b). The circumferential stresses of points 1# and 2# have similar tendency to increase first and then decrease, but the circumferential stress of point 1# varied more than that of point 2# with the increase of the depth of the surrounding rock. However, the radial stresses rise to their initial values gradually with the increase depth of surrounding rock. Moreover, radial stress of point 1# restores to its initial value earlier than point 2#.
Fig. 8Circumferential stresses and radial stresses of internal surrounding rock points in intrinsic condition: a) the cross section of work face and, b) the cross section 13 m away from the work face
a)
b)
3.2.3. Plastic zone distribution
The plastic zone can clearly indicate the stress state (whether it is yielding or not) of the surrounding rock, which reflects its mechanical response after stress redistribution due to excavation.
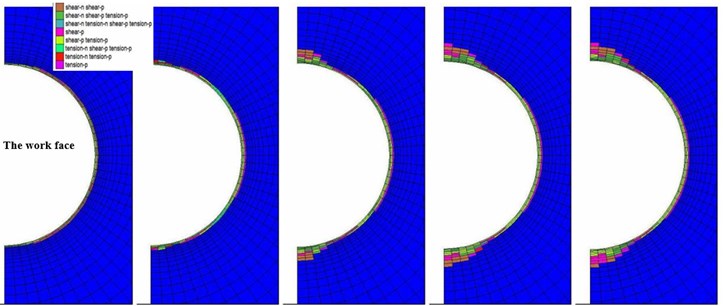
As shown in Fig. 9, the failure zones by the positions Ⅰ and Ⅱ are mainly concentrated in the tunnel circumference. The v-shape failure zone is shown in Ⅲ to occur at the vault and the invert, which is a form of brittle failure caused by excavation unloading under high in situ stress [18, 19]. The vault and invert underwent tensile plastic yield but became shear plastic yield after stress adjustment. According to the previous study on stress paths by true triaxial tests on granite [20, 21], samples failed in shear when the intermediate principal stress was less than 20 MPa, but failed in slabbing when was equal to and greater than 20 MPa. The stress paths simulated in those tests are similar to the vault stress paths as shown in Fig. 7(a) in this paper, which further proves 1# point fails in spalling. In addition, shear failure occurs at the sidewall.
By the positions Ⅳ and Ⅴ, the angle and depth of v-shape failure zone increase due to the distance from the work face and the unloading time increase, which means the development of brittle failure. Moreover, the failure zones of vault and invert distribute symmetrically. In addition, there are tension-p failure zones around tunnel hole, which is due to the Poisson’s effect that lateral extension strain with a relative larger may larger than a critical value (). This will leads to tension failure prior to shear failure for the hard rocks [13]. It is note that the depth of the v-shape of the vault is larger than that of the invert due to the influence of dilatancy deformation in the actual excavation process. However, it is hard to consider for the analysis software using continuous elements [7].
It can be seen from Fig. 9 that excavation will not immediately lead to obvious spalling failure. The spalling failure occurs at a certain distance away from the excavation face (the cross section III). This is because the stress concentration of rock mass near the excavation face has not increased to a critical stress value of the occurrence of spalling failure. However, spalling failure occurs at the cross section III. The stress concentration value of cross section III accounts for about 45 % of the unaxial compressive strength (UCS) of the rock mass, which can be taken as the critical stress value of occurrence of spalling failure. Therefore, it is considered that when the stress concentration value reaches about 45 % of the compressive strength, spalling failure occurs in surrounding rock. The result is located in the range of the reported results for spalling occurrence, which is about 40 %-60 % UCS for hard rock [9, 22].
Fig. 9The plastic zone distributions within surrounding rock on profile Ⅰ-Ⅴ (intrinsic condition)

3.3. DS-TBM excavation results
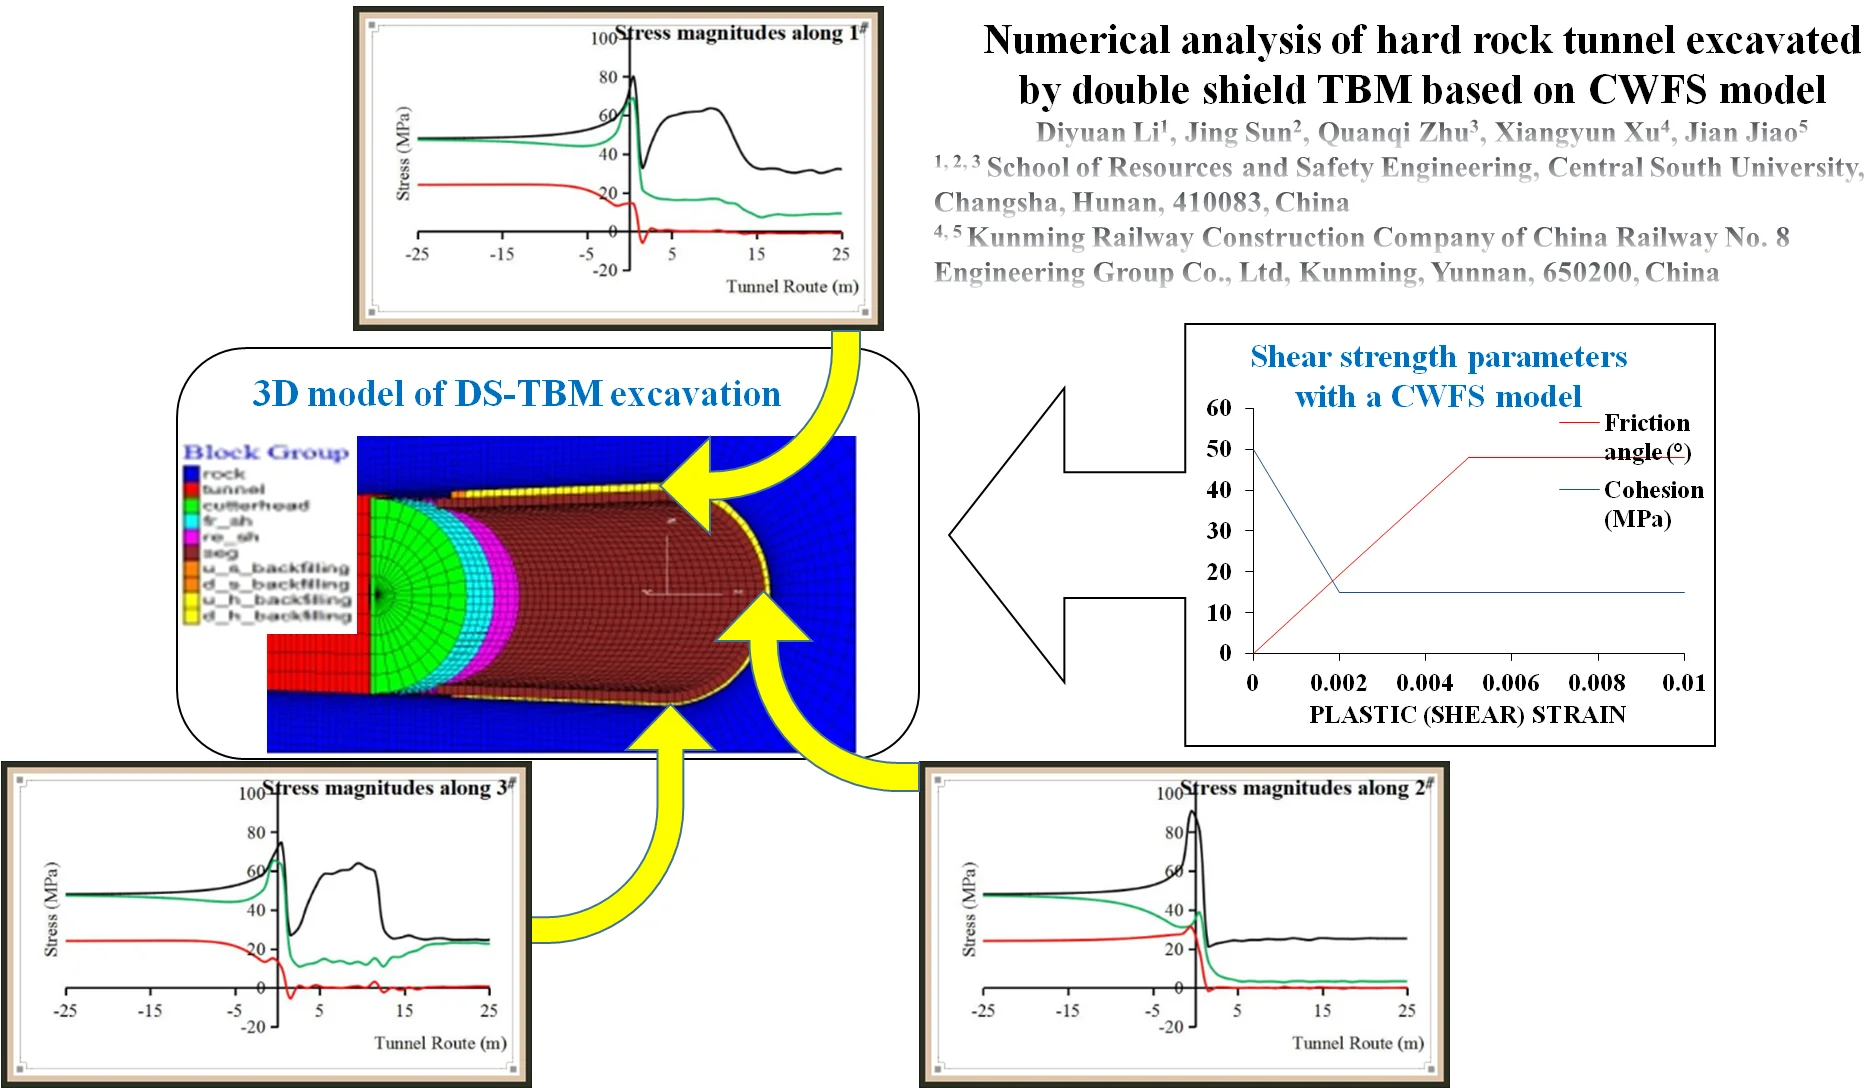
3.3.1. Longitudinal stresses of surrounding rock
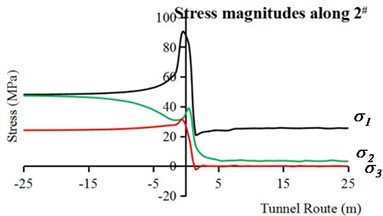
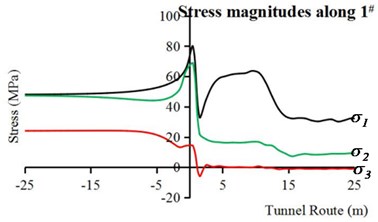
In DS-TBM excavation condition, the stress of vault is different from that of invert because of nonuniform gap between the shields and surrounding rock. Therefore, Fig. 10(a), (b) and (c) illustrate the longitudinal stress magnitudes along 1#, 2# and 3#, respectively. It can be seen from Fig. 7 and Fig. 10 that the stress paths of TBM model on the work face and in front of the work face are similar to those of the intrinsic condition. Therefore, only the stress in the areas behind the work face is analyzed in detail.
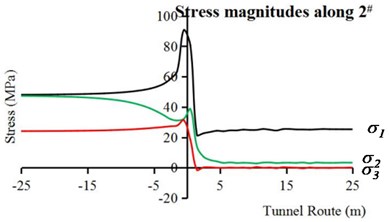
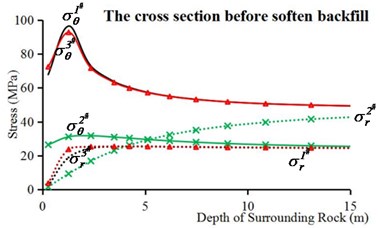
As shown in Fig. 10(a), the stress concentration of surrounding rock takes place in the area before soften backfill (less than 13 m away from work face) as the shields don’t contact with the surrounding rock, and the stress concentration value is about 64 MPa. In the meanwhile, and decrease to their relative stabilized values, respectively. After backfill and lining, the level of stress concentration decreases rapidly with increasingly harden grouting material. Therefore, decreases to about 35 MPa, and decreases to about 16 MPa. In addition, has a very weak unloading process. As shown in Fig. 10(b), the 2# point stress paths of complete TBM model are similar to those of intrinsic condition because the stress of sidewall is mainly affected by the in situ stress.
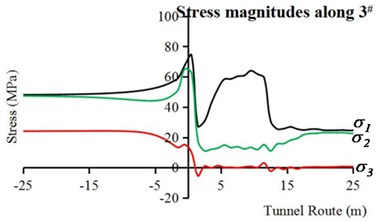
Furthermore, in the area before soften backfill, the stress paths of invert (Fig. 10(c)) are more complex than those of vault (Fig. 10(a)) due to the contact between the shields and the rock mass at the tunnel bottom. Eventually decreases to 25 MPa and increases to 24 MPa due to supporting effect. Meanwhile, remains about 1 MPa after a number of small level unloading and loading processes.
Notably, the number of unloading processes at different monitor points is different. A brief description of the obvious unloading processes of each monitoring point and its causes are listed as follows:
• When the tunnel walls are no longer supported, the entire tunnel boundary undergoes the first unloading process.
• The invert experiences the second unloading process at the end of rear shield (11 m away from the work face) due to the contact between the rear shield and the invert.
• Since the backfill is injected in the gap between the lining and the rock mass, the vault and invert experience the final unloading process.
In conclusion, the vault, sidewall and invert experience two, one and three unloading processes respectively.
Fig. 10Longitudinal stresses of surrounding rock in complete TBM model: a) along point 1#, b) along point 2#, c) along point 3#
a)
b)
c)
3.3.2. Circumferential stresses and radial stresses
In simulation process of complete TBM excavation, differences exist in the stress paths between the vault and the invert because of interaction between shields and surrounding rock. Circumferential stresses and radial stresses of three cross sections (corresponding to Fig. 6(b) Ⅰ, Ⅲ and Ⅳ positions) are analyzed. Moreover, the stress of sidewall is hardly influenced by excavation method because the initial stress dominated by horizontal geostress, so the stresses of vault and invert are mainly analyzed.
It can be seen from Fig. 8(a) and Fig. 11(a) that the stress paths of surrounding rock in complete TBM model are similar to those in the intrinsic condition. However, there is a small difference in radial stresses between of 1# and 3# as the contact between the cutter-head and the surrounding rock behind work face.
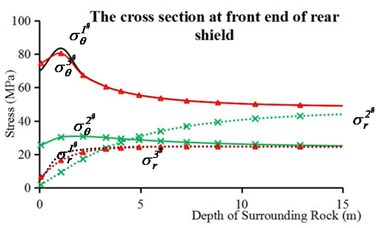
In Fig. 11(b), the stress paths of 1# point are different from those of 3# point due to the interaction between the rear shield and the surrounding rock, as well as the conicity between the front and rear shields. Moreover, the maximum circumferential stress value of 1# and 3# point become higher, and those peak positions are also located deeper surrounding rock. In addition, the cross section before soften backfill is shown in Fig. 11(c). The difference in stress paths between 1# and 3# point still exists due to nonuniform gap caused by the eccentricity of the shield. The peak circumferential stress value of 1# and 3# point become higher, on account of longer stress relaxation time.
Fig. 11Circumferential stresses and radial stresses of internal surrounding rock points in complete TBM model: a) the cross section of work face, b) the cross section at front end of rear shield, c) the cross section before soften backfill
a)
b)
c)
3.3.3. Plastic zone distribution
Analyzing the plastic zone of surrounding rock under TBM tunneling can help to estimate the pressure on the shields. Fig. 12 shows failure zones in cross sections in steady state when interaction of TBM is activated. It can be seen from Fig. 9 and Fig. 12 that the failure zones of TBM model by the positions Ⅰ and Ⅱ are similar to those of the intrinsic condition. The v-shape failure zone in complete model also occurs in Ⅲ cross section. It can be seen that plastic zones of invert are less than those of vault, as shields and their self-weight produce a support at the invert, which closely relates to the shield eccentricity. This is consistent with the in situ observations [23, 24].
Fig. 12The plastic zone distributions within surrounding rock on profile Ⅰ-Ⅴ (complete TBM model)
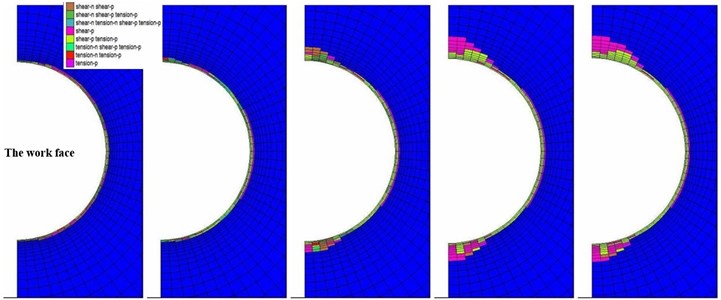

In addition, some zones exit the plastic state (the zones of shear-p or tension-p) in IV position due to the stress adjustment caused by interaction between grouting and surrounding rock. In the cross section V, as increasingly grouting material strength, the surrounding rock has been stabilized by the stress adjustment.
Brittle surrounding rock in high geostress mainly fails in spalling or slabbing, and forms v-shape failure zone eventually. It can be seen from Fig. 9 and Fig. 12 that the excavation influence area of the intrinsic condition is smaller than that of the complete TBM model. This is because the high geostress conditions have the negative effects on breaking intact rock mass, but the positive impacts on TBM excavation, which are similar to the phenomena observed by Boniface A. et al. [25, 26].
4. Conclusions
Longitudinal stresses of surrounding rock, as well as circumferential stresses, radial stresses and plastic zones in some key cross sections were calculated for intrinsic condition, and for the complete TBM model. The following conclusions are obtained:
1) In intrinsic condition, the vault and the invert experience stress concentration, and the sidewall undergoes excavation unloading.
2) The v-shape failure zone is observed to occur at the vault and the invert in the surrounding rock and it occurs when the excavation progresses to a certain degree. It indicates that the stress concentration value about 45 % UCS may lead to the occurrence of spalling failure, which is a critical stress value for spalling phenomenon in hard rock.
3) The stress paths at the vault above the TBM shields are relatively simple, and the vault undergoes two obvious unloading processes. The sidewall is less disturbed by the TBM excavation, and only experiences excavation unloading. The stress paths at the invert below the TBM shields are complex, and there are three unloading processes, which are located behind the work face, at the end of rear shield, and before the backfill grouting.
4) In TBM activated condition, the plastic zones of the vault at the key cross sections are more than those of invert, namely the depth and angle of the v-shape failure zone of the vault are larger than those of invert.
References
-
Zhao K., Janutolo M., Barla G. A completely 3D model for the simulation of mechanized tunnel excavation. Rock Mechanics and Rock Engineering, Vol. 45, Issue 4, 2012, p. 475-497.
-
Cantieni L., Anagnostou G. The effect of the stress path on squeezing behavior in tunneling. Rock Mechanics and Rock Engineering, Vol. 42, Issue 2, 2009, p. 289-318.
-
Barla G., Zhao K., Janutolo M. 3D advanced modelling of TBM excavation in squeezing rock conditions. 1st Asian and 19th Iranian Tunnel Symposium, 2011.
-
Hasanpour R., Rostami J., Ünver B. 3D finite difference model for simulation of double shield TBM tunneling in squeezing grounds. Tunnel and Underground Space Technology Incorporating Trenchless Technology Research, Vol. 40, Issue 2, 2014, p. 109-126.
-
Hasanpour R. Advance numerical simulation of tunneling by using a double shield TBM. Computers and Geotechnics, Vol. 57, Issue 2, 2014, p. 37-52.
-
Zhao K., Janutolo M., Barla G., Chen G. X. 3D simulation of TBM excavation in brittle rock associated with fault zones: The Brenner exploratory tunnel case. Engineering Geology, Vol. 181, 2014, p. 93-111.
-
Diederichs M. S. The 2003 Canadian Geotechnical Colloquium: Mechanistic interpretation and practical application of damage and spalling prediction criteria for deep tunnelling. Canadian Geotechnical Journal, Vol. 44, Issue 9, 2005, p. 1082-1116.
-
Pelli F., Kaiser P. K., Morgenstern N. R. An interpretation of ground movements recorded during construction of the Donkin-Morien tunnel. Canadian Geotechnical Journal, Vol. 28, Issue 28, 1991, p. 239-254.
-
Martin C. D. 17th Canadian Geotechnical Colloquium: The effect of cohesion loss and stress path on brittle rock strength. Canadian Geotechnical Journal, Vol. 34, Issue 5, 1997, p. 698-725.
-
Hajiabdolmajid V. R. Mobilization of Strength in Brittle Failure of Rock. Ph.D. thesis, Department of Mining Engineering, Queen’s University, Kingston, Canada, 2001.
-
Hajiabdolmajid V., Kaiser P. K., Martin C. D. Modelling brittle failure of rock. International Journal of Rock Mechanics and Mining Sciences, Vol. 39, Issue 6, 2002, p. 731-741.
-
Loew S., Barla G., Diederichs M. Engineering geology of Alpine tunnels: past, present and future. 11th IAEG Congress, 2010.
-
Stacey T. R. A simple extension strain criterion for fracture of brittle rock. International Journal of Rock Mechanics and Mining Sciences and Geomechanics Abstracts, Vol. 18, Issue 6, 1981, p. 469-474.
-
Diederichs M. S. Manuel Rocha medal recipient rock fracture and collapse under low confinement conditions. Rock Mechanics and Rock Engineering, Vol. 36, Issue 5, 2003, p. 339-381.
-
Kaiser P. K., Diederichs M. S., Martin C. D., Sharp J., Steiner W. Underground works in hard rock tunneling and mining. ISRM International Symposium, Melbourne, Australia, 2000.
-
Flac3D (Fast Lagrangian Analysis of Continua in Three-Dimensions). Version 3.0, User’s Manual, Itasca Consulting Group Inc., Minneapolis, 2005.
-
Eberhardt E. Numerical modelling of three-dimension stress rotation ahead of an advancing tunnel face. International Journal of Rock Mechanics and Mining Sciences, Vol. 38, Issue 4, 2001, p. 499-518.
-
Ortlepp W. D., Stacey T. R. Rockburst mechanisms in tunnels and shafts. Tunnelling and Underground Space Technology, Vol. 9, Issue 1, 1994, p. 59-65.
-
Ortlepp W. D. Rock fracture and rockbursts: an illustrative study. Monograph Series M9, The South African Institute of Mining and Metallurgy, Johannesburg, 1997, p. 98.
-
Du K., Li X. B., Li D. Y., Weng L. Failure properties of rocks in true triaxial unloading compressive test. Transactions of Nonferrous Metals Society of China, Vol. 25, Issue 2, 2015, p. 571-581.
-
Li X. B., Du K., Li D. Y. True triaxial strength and failure modes of cubic rock specimens with unloading the minor principal stress. Rock Mechanics and Rock Engineering, Vol. 48, Issue 6, 2015, p. 2185-2196.
-
Li D. Y., Li C. C., Li X. B. Influence of sample height-to-width ratios on failure mode for rectangular prism samples of hard rock loaded in uniaxial compression. Rock Mechanics and Rock Engineering, Vol. 44, Issue 3, 2011, p. 253-267.
-
Read R. S. Interpreting Excavation-Induced Displacements Around a Tunnel in Highly Stressed Granite. Ph.D. Thesis, Department of Civil and Geological Engineering, University of Manitoba, Winnipeg, 1994.
-
Diederichs M. Brittle spalling, practical limits. Swedish Rock Mechanics Symposium, Sweden, 2010.
-
Boniface A. Tunnel Boring Machine performance in basalts of the Lesotho Formation. Tunnelling and Underground Space Technology Incorporating Trenchless Technology Research, Vol. 15, Issue 1, 2000, p. 49-54.
-
Myrvang A., Blindheim O. T., Johansen E. D. Rock stress problems in bored tunnels. Norwegian Soil and Rock Engineering Association, Vol. 11, 1998, p. 56-62.
About this article

The authors would like to acknowledge financial supports from the National Natural Science Foundation of China (51474250), the State Key Research Development Program of China (2016YFC0600706), and the Fundamental Research Funds for the Central Universities of Central South University (2018zzts723).
