Abstract
As an important characteristic information in incipient fault diagnosis of rotating machinery, the fault impulse signal is hard to be monitored due to the low signal amplitude and system disturbance/noise. Based on bilateral spectrum and precession energy difference density spectrum for the incipient fault diagnosis of rotating machinery, a novel diagnosis method is proposed in this paper to overcome this key problem. Compared with the existing methods to extract transient impulses from the vibrate signals, this paper designs a new fault feature parameter-precession energy difference density to characterize the feature of transient impulse. Furthermore, the complex signal and the negative frequency are introduced into the spectrum analysis and the forward and backward precession characteristics, which can be directly gained through the bilateral spectrum and relieves the problems not to be overlooked, such as high calculation, high error and time consuming. Finally, the feasibility and effectiveness of the proposed methods are demonstrated via a case study of a vertical mill reducer.
1. Introduction
Rotating machinery is the critical equipment widely used in industrial manufacture. Timely incipient fault diagnosis is the key to guarantee operation safety and suppress fault deterioration. Compared with traditional fault diagnosis methods, incipient fault diagnosis is a more sophisticated form of diagnosis.
Time-frequency transform analysis of vibration signal is one of the most widespread and effective method among the existing methods to incipient fault diagnosis [1, 2]. Most of the vibration signals of rotating machinery are non-stationary and nonlinear signals [3, 4]. The main methods of dealing with such signals are including Short-time Fourier Transform [5], Wavelet transform [6], quadratic time-frequency distribution, Empirical Mode Decomposition, etc. [7-9]. Zhao [10] et al. proposed an instantaneous speed estimation method based on short-time Chirp-Fourier transform. And it is used to detect the incipient fault of a gearbox during the non-stationary working conditions. Wavelet transform is another technological innovation after Fourier transform, which can provide both the time domain and frequency domain information of the localized signal. Based on the characteristics of adjustable wavelet of quality factor, Luo [11] et al proposed an adaptive demodulation method. The method reconstructs the signal according to the kurtosis value of the wavelet and applies it to the bearing fault diagnosis. The quadratic time-frequency distribution uses a bilinear transformation rather than a linear transformation, so there is serious cross-term interference for multi-component signals. Adaptive time-frequency analysis can not only reflect the characteristics of instantaneous frequency with time-varying, but also accurately reflect the changes of signal energy with time and frequency. Zheng [12] proposed a new adaptive time-frequency analysis method based on improved local characteristic-scale decomposition.
The essence of these non-stationary signal processing methods is similar. The non-stationary signals are divided into a great many of small segments, and each small segment can be regarded as a stationary or cyclostationary signal. Therefore, the traditional spectrum analysis technology still has important research significance and a very wide range of applications in the rotating machinery fault diagnosis for its simplicity and intuitive [13-15]. The most representative spectral analysis technologies are holospectrum technology [16-18], full-spectrum technology [19] and vector spectrum technology [20, 21]. These three technologies have their respective merits and have been widely used in engineering. However, these methods obtain forward and backward precession parameters through a series of mathematical operations, which will inevitably increase the amount of calculation and analysis error. This makes it difficult to apply these methods to effective diagnosis of the incipient fault.
As we know, if a frequency component of the signal is regarded as a harmonic function in the spectrum analysis process, the negative frequency can be considered as the result of mathematical operations. However, if a frequency component of the signal is interpreted as a rotation vector, the negative frequency can be given different physical meaning. The negative frequency has been applied to the machinery, communication and other engineering fields [22-26]. In the rotor system, the negative frequency can be defined as the rotation vector opposite to the rotor rotation direction while the positive frequency is the rotation vector with the same direction of rotor. Thus, the positive and negative frequency components characterize the forward and backward precession of the frequency components of the rotor system.
Periodic transient impulse is an important characteristic information in incipient fault diagnosis of rotating machinery. However, it is very difficult to monitor this fault impulse signal because the amplitude of this signal is rather low and always covered by system disturbance and noise easily. Compared with the existing methods of extracting transient impulses from the vibrate signals, a novel scheme is adopt in this paper. Due to the physical mechanism of periodic impulse, the energy of the impact would act on the forward or backward precession of the rotor. In this paper, a new fault feature parameter - precession energy difference density is designed to characterize the feature of transient impulse, and a new diagnosis method is proposed based on bilateral spectrum and precession energy difference density spectrum. The main contributions of this paper include (1) the complex signal and the negative frequency are introduced into the spectrum analysis and the forward and backward precession characteristics can be directly gained through the bilateral spectrum; and (2) a new fault feature parameter-procession energy difference density is designed to characterize the feature of transient impulse of rotating machinery incipient fault.
2. Theoretical basis of bilateral spectrum and precession energy difference density spectrum
2.1. Bilateral spectrum and negative frequency
In general, a signal has positive and negative spectrum after Fourier transform. Whereas, the signal is always treated as a real function, and the classical spectrum analysis utilizes its positive axis spectrum. So, the frequency spectrum is also called unilateral spectrum. However, if the signal is a complex signal, its spectrum is not conjugate symmetry. And the frequency spectrum is bilateral spectrum.
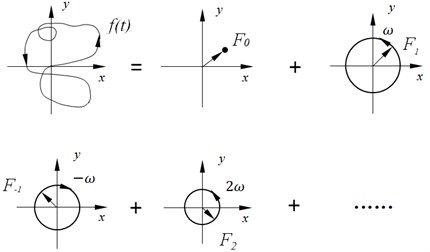
In fact, any real function can be converted to complex exponential form by Euler transform. Meanwhile, the Fourier transform can also be regarded as the expansion of complex exponential form. Each frequency in the bilateral spectrum can be transformed from harmonic component to rotation vector (see Fig. 1) [24].
It follows from Fig. 1 that the Fourier transform of complex signals are decomposed into a number of rotation vectors with different directions, rotation frequency and rotation radius. The negative frequency part of the spectrum is defined as the rotation vector, which is opposite to the rotation direction of the rotor. The positive frequency part of the spectrum is the rotation vector with the same rotation direction of rotor. In this way, the positive and negative frequency components characterize the forward and backward precession of rotor system respectively.
Fig. 1Rotation vector decomposition of complex exponential function
2.2. Forward and backward precession of Bilateral Spectrum
The rotor system is simplified as a disc, which is mounted on a massless elastic rotation shaft (see Fig. 2).
Fig. 2Model of rotor system
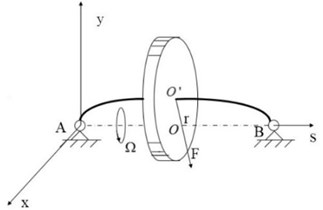
The differential equation of the rotor dynamics model is established as follow:
where is stiffness coefficient of the rotating shaft. Set , then the Eq. (1) can be expressed as:
The solutions of Eq. (2) are as follow:
where , are the displacement amplitude in the direction of and axis, and are the phase angle of , . Suppose is a complex plane, and . Then Eq. (2) can be transformed into free motion equation as:
The solution of Eq. (4) is expressed as the following plural form:
where and , which are determined by initial conditions. is a motion vector of rotor. And its trajectory is an ellipse which is composed of two circles with same frequency and opposite direction.
The first part of the solution is called forward precession. It represents a circular whose radius is , and the rotation direction is anti-clockwise. Similarly, the last part is called backward precession. It represents a circular whose radius is , and the rotation direction is clockwise.
Then we can draw the conclusions that: (1) in bilateral spectrum, the positive half-axis spectrum characterizes the forward precession of the rotor and the negative half-axis indicates the backward precession; (2) the amplitude of the positive and negative frequency components represents respectively the radius of the forward and backward precession circles.
2.3. Precession energy difference density spectrum
Periodic transient impulse is an important characteristic information in incipient fault diagnosis of rotating machinery. However, it is very difficult to monitor this fault impulse signal because the amplitude of this signal is rather low and always covered by system disturbance and noise easily. Due to the physical mechanism of periodic impulse, the energy of the impact would act on the forward or backward precession of the rotor. To overcome this problem, a novel fault feature parameter-precession energy difference density is designed in this paper to characterize the feature of transient impulse. The procession energy difference density () is defined as: the ratio between the square difference of forward and backward precession radius and the sum of square of forward and backward precession radius for a certain harmonic frequency, and it can be described as:
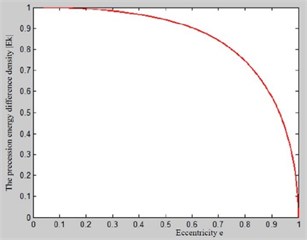
The procession energy difference density can not only represent the energy distribution but also reflect the difference between forward and backward precession. On the one hand, precession energy difference density indicates the change of rotor eccentricity which reflects the influence degree by transient impulse. The smaller the , the larger the eccentricity is, and vice versa. The total variation curve of the precession energy density with eccentricity () is shown in Fig. 3. The value of is closer to 1, the eccentricity is closer to 0, and the difference between forward and backward precession is larger. That means the filtering axis orbits is closer to a circle. On the contrary, the filtering axis orbits are closer to the straight line. On the other hand, the procession energy difference density can amplify rotor precession features by the rotor precession energy, the magnitude of which is proportional to the square of the amplitude spectrum. If 0, that means the feature of precession is forward. And if 0, that means the feature of precession is backward. If 0, that means the forward precession energy is equal to the backward precession energy. The value of distributes in the range of [–1, 1].
According to Eq. (6), when the precession energy difference density at each characteristic frequency is calculated and plotted on the same plane, we may call it as precession energy difference density spectrum. The advantage of this curve is that the values of each characteristic frequency are positive or negative. And the positive or negative values indicate the procession direction of the rotor at a certain characteristic frequency, which intuitively display the energy feature of forward and backward precession. Therefore, it is very convenient to judge the forward and backward precession direction of the rotor, and the resolution is high. As the negative frequency is closely related to the backward precession, the negative frequency has a significant advantage on the fault types of a large number of backward precessions.
Fig. 3Curve of Ek change with eccentricity
3. Fault diagnosis process
The fault diagnosis process mainly consists of 3 steps, including, fault feature extraction and fault diagnosis (see Fig. 4).
Fig. 4Flow chart of diagnosis process
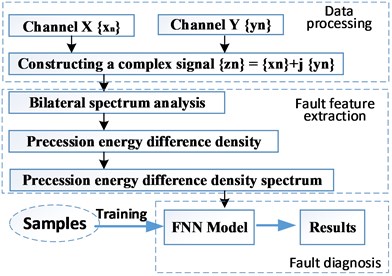
Step 1: Data processing.
1-1 Vibration signals acquisition.
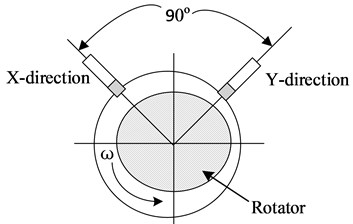
The vibration signals of two channels, and , which are orthogonal to each other on the same section of the rotor are collected by installing the vibration sensors in vertical direction (as shown in Fig. 5). Note that, in order to ensure the data accuracy, the model of sensor, sampling frequency, initial sampling time, data transmission, installation conditions should be highly consistent with each other.
1-2 Constructing the complex signal.
Based on the collected two channel vibration signals (, ), the complex signal () can be constructed as:
Step 2: Fault feature extraction.
2-1 Bilateral spectrum analysis.
A FFT transform is used to get the discrete Fourier transform form of the complex signal . And it can be described as follow:
is a plural sequence. And the feature parameters (,,,) can be obtain by these equations:
where, is the radius of the forward precession circle, is the radius of the backward precession circle, is the initial phase of the forward precession circle, is the initial phase of the backward precession circle.
Fig. 5Diagram of rotor vibration signal gathering
The advantage of bilateral spectrum lies in building the relationship between the forward (backward) precession and positive (negative) frequency, and the calculation process to obtain the feature parameters is simple.
2-2 Drawing the precession energy difference density spectrum.
According the parameters which are obtained in bilateral spectrum, it is easy to get the precession energy difference density of each feature frequency by Eq. (6). Then we can get the precession energy difference density spectrum after putting the point of each feature frequency together. The vector expression form of precession energy difference density spectrum can be described as follow:
where is the fault feature vector, and is the precession energy difference density of frequency.
Step 3: Fault diagnosis.
After getting the precession energy difference density spectrum, it is necessary to make fault judgment by human or intelligent diagnosis method. In this paper, the FNN-based (fuzzy neural network) fault recognition method is adopted, and the process is as follows:
(1) The input fault feature vector (training sample) can blurred by applying fuzzy theory, and then membership grade of is obtained.
(2) Fuzzy rules are extracted from sample data first. Then, the fuzzy rules are transformed into mapping relations of neural network. Meanwhile the learning result of neural network is transformed into the knowledge rules of fuzzy inference system, which makes the network have the better ability of knowledge expression, data processing and fuzzy inference.
(3) Training the neural network by the learning algorithm to optimize the connection weight and the parameters of membership function until meet the error requirement. The fuzzy rules are dynamically updated also.
(4) Generalize the FNN model by the test samples to confirm the corresponding relationship between the input data and output. After that, FNN can be used to diagnose the fault.
4. Case study
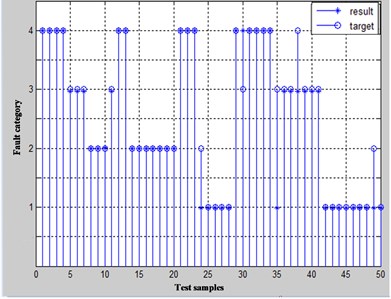
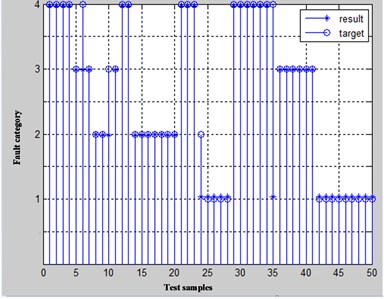
In order to verify the effectiveness of the method, an automatic diagnosis system was developed using Microsoft Visual Studio 2010 and MATLAB R2012b as the integrated development environment. Four type of fault (rotor unbalance, rotor misalignment, rotor rubbing and oil whirl) are test with the historic operation data (from 2013 to 2016) of a vertical mill reducer of a cement factory in Yibin, Sichuan province, china. And the diagnostic results are compared with BP neural network. Under the same training sample and test sample, the diagnosis results of BP neural network (Fig. 6(a)) and this paper method (Fig. 6(b)) are shown in Fig. 6, and the accuracy rates are respectively 90 % and 92 %.
Fig. 6Diagnosis results of: a) BP neural network, b) this paper method
a)
b)
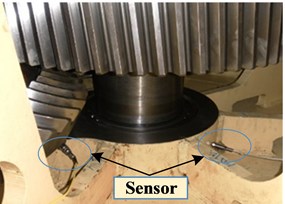
Fig. 7Vibration sensors installation schematic diagram
In order to illustrate the process of the method propose in this paper, we take the rotor misalignment data as an example.
The on-site layout mode of vibration sensor is as shown in Fig. 7. It is mounted on the reducer bearing seat. The device frequency is 102.8 Hz, sampling frequency is 2000 Hz, and the length of data processed at one time is 1024 points.
The time domain features of the selected one time processed data are shown in Fig. 8.
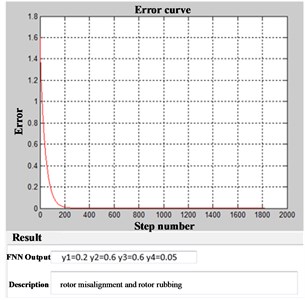
Using the method proposed in this paper, the and direction signals are composed into a complex signal first. The bilateral spectrum (Fig. 9) of this signal is obtained next. As shown in Fig. 9, the energy are mainly distributed in 1X, 2X, 3X and 4X. Therefore, these frequencies are mainly analyzed. The procession energy difference density spectrum is plotted as shown in Fig. 10. The fault feature vector can be constructed as an input for FNN. And the result of fault diagnosis is as shown in Fig. 11.
Fig. 8Time domain features of one time processed data
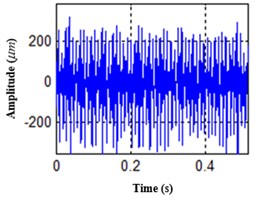
a) direction
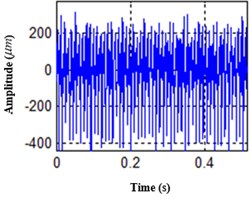
b) direction
Fig. 9Bilateral spectrum of one time processed data
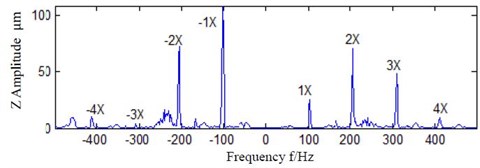
Fig. 10Procession energy difference density spectrum
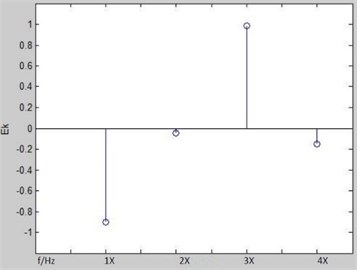
Fig. 11The result of fault diagnosis
5. Conclusions
In the bilateral spectrum, the negative frequency is defined as the rotation vector which is opposite to the rotation direction of the rotator, and the positive frequency is the rotation vector with the same direction of the rotator. The positive half-axis spectrum characterizes the positive precession characteristic, while the negative half-axis spectrum represents the backward precession characteristics. The amplitude of the positive and negative frequency components represents the forward and backward precession circles radius. By constructing a complex signal with two channel vibration signal which are perpendicular in the same section of the rotor, then analyzing its bilateral spectrum, the forward and backward precession parameters can be directly acquired. The new fault feature parameter-precession energy difference density can characterize the feature of transient impulse. And the incipient fault diagnosis method for rotating machinery based on bilateral spectrum and precession energy difference density spectrum is effectiveness.
References
-
Wang Y., Xiang J., Markert R., et al. Spectral kurtosis for fault detection, diagnosis and prognostics of rotating machines: a review with applications. Mechanical Systems and Signal Processing, Vols. 66-67, 2016, p. 679-698.
-
Singh S., Vishwakarma M. A review of vibration analysis techniques for rotating machines. International Journal of Engineering and Technical Research, Vol. 4, Issue 3, 2015, p. 757-761.
-
Li X., Duan F., Mba D., et al. Multidimensional prognostics for rotating machinery: a review. Advances in Mechanical Engineering, Vol. 9, Issue 2, 2017, https://doi.org/10.1177/1687814016685004.
-
Abboud D., Baudin S., Antoni J., et al. The spectral analysis of cyclo-non-stationary signals. Mechanical Systems and Signal Processing, Vol. 75, Issue 5, 2016, p. 280-300.
-
Gao Huizhong, Liang lin, Chen Xiaoguang, et al. Feature extraction and recognition for rolling element bearing fault utilizing short-time Fourier transform and non-negative matrix factorization. Chinese Journal of Mechanical Engineering, Vol. 28, Issue 1, 2015, p. 96-105.
-
Chen J., Li Z., Pan J., et al. Wavelet transform based on inner product in fault diagnosis of rotating machinery: a review. Mechanical Systems and Signal Processing, Vols. 70-71, 2016, p. 1-35.
-
Zhao Xiao Min, Patel T. H., Zuo Ming J. Multivariate EMD and full spectrum based condition monitoring for rotating machinery. Mechanical Systems and Signal Processing, Vol. 27, 2012, p. 712-728.
-
Hu Zhen Bang, Xu Mu Xun, Jaing Ge Dong, et al. Analysis of non-stationary signal of a sudden unbalanced spindle based on wavelet noise reduction and short-time Fourier transformation. Journal of Vibration and Shock, Vol. 33, Issue 5, 2014, p. 20-23+36.
-
Gu F., et al. Electrical motor current signal analysis using a modified bispectrum for fault diagnosis of downstream mechanical equipment. Mechanical Systems and Signal Processing, Vol. 25, Issue 1, 2011, p. 360-372.
-
Ming Z., Jing L., Liao Y., et al. Instantaneous rotating speed estimation using adaptive short-time Chirp-Fourier transform and its applications. Journal of Mechanical Engineering, 2015.
-
Luo J., Yu D., Liang M. A kurtosis-guided adaptive demodulation technique forbearing fault detection based on tunable-Q wavelet transforms. Measurement Science and Technology, Vol. 24, Issue 5, 2013, p. 055009.
-
Zheng J. D., Cheng J. S., Zeng M. A new time-frequency analysis method based on improved local characteristic-scale decomposition and normalized quadrature. Tien Tzu Hsueh Pao/acta Electronica Sinica, Vol. 43, Issue 7, 2015, p. 1418-1424.
-
Hu B., Li B. Blade crack detection of centrifugal fan using adaptive stochastic resonance. Shock and Vibration, Vol. 2015, 2015, p. 954932.
-
Borghesani P., et al. The velocity synchronous discrete Fourier transform for order tracking in the field of rotating machinery. Mechanical Systems and Signal Processing, Vol. 44, Issues 1-2, 2014, p. 118-133.
-
Cheng Jian Sheng, Sun Ye Mei, Yang Shuai, et al. Rotary machine fault diagnosis based on spectrum analysis method. Coal Mine Machinery, Vol. 32, 2011, p. 253-254.
-
Chen P., Wang K., Feng K. Application of order-tracking holospectrum to cracked rotor fault diagnostics under nonstationary conditions. Prognostics and System Health Management Conference, 2016.
-
Wei Y., et al. A probability uncertainty method of fault classification for steam turbine generator set based on Bayes and Holospectrum. Proceedings of the Institution of Mechanical Engineers Part C-Journal of Mechanical Engineering Science, Vol. 230, Issue 20, 2016, p. 3767-3776.
-
Zhang Y., et al. Research on accuracy improvement of holospectrum technique in machine tool spindle diagnosis. 3rd World Congress in Applied Computing, Computer Science, and Computer Engineering, 2011, p. 598-603.
-
Li H., et al. Applying full vector spectrum for electric hoist gearbox fault diagnosis. Machine Design and Manufacturing Engineering, 2013, 725-728.
-
Chen L., et al. Full-vector signal acquisition and information fusion for the fault prediction. International Journal of Rotating Machinery, Vol. 2016, 2016, p. 5980802.
-
Antoni J., Randall R. B. The spectral kurtosis: application to the vibratory surveillance and diagnostics of rotating machines. Mechanical Systems and Signal Processing, Vol. 20, Issue 2, 2006, p. 308-331.
-
Du F. Negative frequency communication. Physics, 2010, p. 28-33.
-
Tu Ya Qing, Li Ming, Shen Ting Ao, et al. Error analysis of DFT and DTFT based phase difference measurement considering the negative frequency contribution. Journal of Vibration and Shock, Vol. 32, Issue 20, 2015, p. 85-91.
-
Zhang Hua Rong Spectrum analysis of complex signals [EB/OL]. http://blog.sciencenet.cn/blog-282387-303316.html.
-
Tan S. W., Ren Z. L., Sun J. Parameter estimation of low-frequency signal with negative frequency contribution. Applied Mechanics and Materials, Vols. 380-384, 2013, p. 3457-3460.
-
Liang Y., et al. Synthetic amplitude spectrum and its extensions for analyzing the two perpendicular directional vibration displacement signals of a rotating rotor. Advances in Mechanical Engineering, 2013, https://doi.org/10.1155/2013/218576.
About this article

This work was supported by the National Natural Science Foundation of China (Grant No. 51575072), Basic and Frontier Research Project of Chongqing, China (Grant No. cstc2017jcyjAX0037).
