Abstract
Variational mode decomposition (VMD) is a modern decomposition method used for many engineering monitoring and diagnosis recently, which replaced traditional empirical mode decomposition (EMD) method. However, the performance of VMD method specifically depends on the parameter that need to pre-determine for VMD method especially the mode number. This paper proposed a mode determination method using signal difference average (SDA) to determine the mode number for the VMD method by taking the advantages of similarities concept between sum of variational mode functions (VMFs) and the input signals. Online high-speed gear and bearing fault data were used to validate the performance of the proposed method. The diagnosis result using frequency spectrum has been compared with traditional EMD method and the proposed method has been proved to be able to provide an accurate number of mode for the VMD method effectively for rotating machinery applications.
1. Introduction
Signal decomposition method helps to reduce signal complexity and improve the efficiency of rotating machinery diagnosis. Empirical mode decomposition (EMD), developed by Huang et al. is a well-known decomposition method used for many rotating machinery diagnoses over decades [1-4]. However, this method suffers in decomposition process due to mode mixing and end effect [5, 6]. In later years, some improvement methods have been developed for EMD such as ensemble EMD (EEMD), complementary EEMD (CEEMD), partial EEMD (PEEMD) and succinct and fast EMD (SF-EMD) which helps to solve mode mixing and end effect problem by taking advantages of noise addition, permutation entropy, sifting stop criterion and window width selection [5-8]. But, the improvement method mainly solves the end effect and mode mixing problem for some signals but not for all signals.
Signal decomposition method is one of the most important element in rotating machinery diagnosis using the vibration signal. A new idea of vibration suppression of rotating machinery application has been proposed by Zhao et al. which helps to reduce system complexity [9]. Besides that, there are many diagnosis strategies have been proposed recently in order to provide better diagnosis result. Zhao et al. has proposed EEMD, multi-scale fuzzy entropy and SVM and W. Deng has proposed EMD, fuzzy entropies and improved LS-SVM for rotating machinery diagnosis [10, 11]. Recently, a new signal decomposition method called variational mode decomposition (VMD) has been developed and proposed by Dragomiretskiy and Zosso which can surpasses EMD and EEMD method in rotating machinery diagnosis [12-15]. VMD helps to solve mode mixing problem in decomposition result by the shift from sifting process approach to alternating direction method of multipliers approach [16]. The founder of VMD also pointed out the importance of determining the number of mode for VMD method to avoid under and over decompose problem [16]. In current practice, most researchers used peak searching method on frequency spectrum to estimate the mode number for VMD method [14, 15, 17]. Some researchers also used an optimization method to solve the VMD problem such as particle swarm optimization (PSO) and artificial fish swarm algorithm (AFSA) [18, 19]. However, these approaches may cause a lot of computational time. Some other optimization may be considered to reduce computational time such as novel two-stage hybrid swarm intelligence optimization algorithm (GA-PSO-ACO), chaotic ant colony optimization (CACO), improved adaptive particle swarm optimization (DOADAPO) and genetic and ant colony adaptive collaborative optimization (MGACACO) [20-23]. The concept of system technical state evaluation point of view to find operational parameters also may considered [24]. Nonetheless, the pre-determine the number of the mode is still considered as an open problem for VMD method [16, 17].
Hence, this paper proposed a mode determination method using similarities approach between VMFs and input signal. The similarities are calculated by using the SDA method. Firstly, the maximum possible number of mode for a signal is estimated for VMD decomposition. Then, SDA method is used to verify the similarities between VMFs and the input signal for each mode number and the SDA plot is produced for each signal. The smallest to the steady state value of SDA method was selected as the number of mode for an input signal. The proposed method may provide a good alternative solution for current method used to determine the mode number for the VMD method as it is simple, easy to implement, less computational and it also can provide an accurate mode number for the VMD method.
2. Variational mode decomposition (VMD)
VMD is a novel new, fully intrinsic and adaptive and quasi-orthogonal decomposition method, where the modes are extracted non-recursively [16]. It determines the relevant band adaptively and estimates correspond modes concurrently that will properly balance the errors between them. VMD method relies on three main concepts which are Wiener filtering, Hilbert transform and analytic signal, and frequency mixing and heterodyne demodulation. It decomposes an input signal into its principal modes called variational mode functions (VMFs) that reproducing the input signal with different sparsity properties. For each VMFs, it has limited bandwidth and assumed to be mostly compact around centre pulsation that been determined during the decomposition process. VMD method also adopted alternate direction method of multipliers (ADMM) for reconstruction process instead of using sifting process from traditional decomposition method. Sparsity prior of each mode is chosen as bandwidth in the spectral domain and can be accessed by the following scheme for each mode:
• Compute associated analytic signal by means of the Hilbert transform in order to obtain a unilateral frequency spectrum.
• Shift frequency spectrum of mode to baseband by mixing the exponential tune to the respective estimated centre frequency.
• The bandwidth estimated through the Gaussian smoothness of the demodulated signal.
VMD is a good method for sampling and noise of the signal. A tight relation with Wiener filter makes this method has an optimal ability to deal with noise in the signal [16]. VMD method also helps to solve current decomposition methods limitation such as lacking mathematical theory, recursive sifting process which not allows for backward error correction, hard-band limits, the requirement to predetermine filter bank boundaries and sensitive to noise. VMD has shown it superiority in a wide range of application such as machinery diagnosis, a speech signal, crude oil forecasting, wind speed forecasting and image processing due to its advantages over another decomposition method [14, 25-29]. VMD was known as a unique method with the unique theory behind this method. However, the performance of VMD method totally depends on the predetermined parameter especially the number of modes. An inaccurate number of mode will result in over and under decompose that will affect the diagnosis result. Therefore, the mode determination method proposed in this paper will help to solve this problem as discussed in section 3. The theory of decomposition procedure of VMD method described as below.
Step 1. Initialize ,,,.
Step 2. The value of , , and is updated according to the following formula:
Step 3. Repeat the iterative process from 2 until the function is converge based on convergence criteria satisfied the condition of , where is a given accuracy requirement.
3. The proposed mode determination method
3.1. Similarities concept between sum of VMFs and input signal
Decomposition method is a tool that separates an input signal into a set of sub-signals that will have its own instantaneous frequency. VMD method decomposes an input signal into sets of VMFs where each VMF own a unique property. Each VMF owns certain frequency range which is derived from the input signal. For an example, the frequency spectrum of clean gear vibration signal mainly consists of two or three major peaks that represent the operating speed frequency and gear mesh frequencies. This signal will have either two or three VMFs by using VMD method. The similarities concept can be described as a relationship between VMFs and input signal. Perfect decomposition result will have 100 percent similarities between VMFs and input signal which is impossible to achieve due to mathematical slack during the calculation process. Therefore, the highest possible value of similarities indicates that the decomposition result is accurate, and the information of input signal is not lost during the decomposition result.
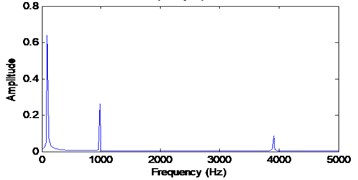
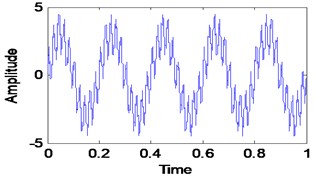
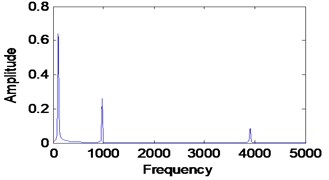
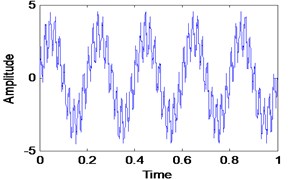
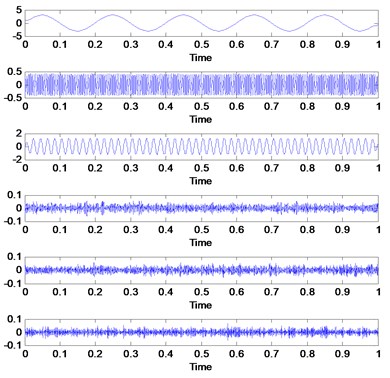
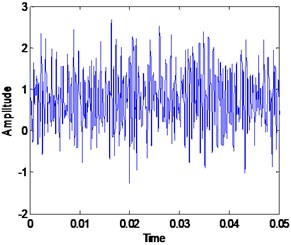
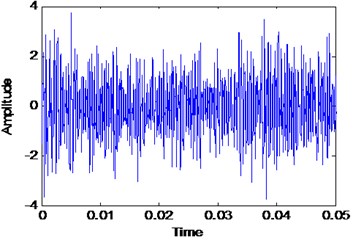
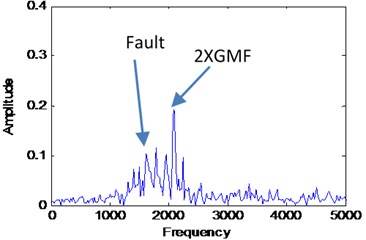
Three simulated signals described in Eq. (2), Fig. 1 and Fig. 2 have been used in order to review the similarities concept visually. These three signals are added together to form a single signal that will be used as an input signal for VMD method as shown in Fig. 1. Then, three mode number has been predetermined for VMD decomposition. Other VMD parameter has been set to the standard value as discussed in [14, 16]. Fig. 3 shows the decomposition result for the simulated signal in Fig. 2. Then, all the VMFs in Fig. 3 is added up to construct signal shown in Fig. 4. Visually, there is no difference between the input signal and reconstructed signal due to clean signal, accurate mode number and superiority of VMD method:
3.2. Signal difference average (SDA) for mode determination
In order to validate the similarities between VMFs and input signal, signal difference average method (SDA) has been used. Signal difference average method (SDA) calculates the difference between the signal for each data point within the signals itself. The smallest value of SDA indicates that the signals have high similarities whereas the large value of SDA indicates that there is a lot of information loss from the signal. Eq. (3) described SDA method where is a sum of VMFS, is an input signal and is the data point in the signals. Therefore, the SDA value between reconstructed signal in Fig. 5 and input simulated signal in Fig. 3 is 7.9814×10⁻¹⁷ which is very small that indicates the similarities is very high:
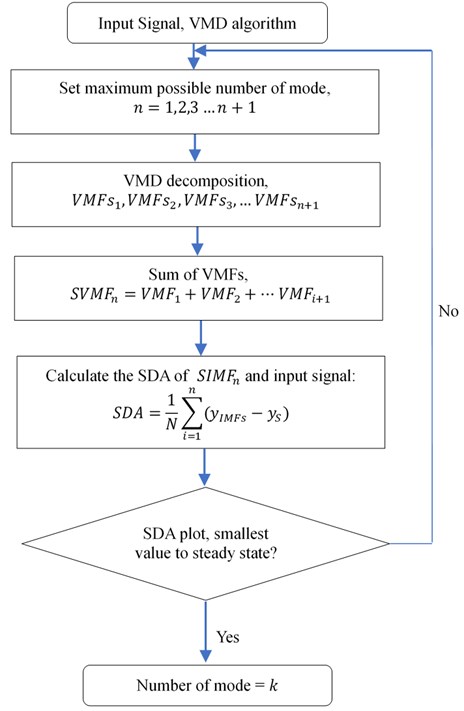
The theoretical framework of the proposed automated mode determination method is shown in Fig. 5. Initially, the number of the mode is set from 1 until the maximum possible number of mode such as 10-20 and in some cases, up until 30. It depends on the signal conditions. For most rotating machinery cases, the maximum possible value of mode is set at 15-20 which is based on knowledge of previous decomposition method Research's [30-33]. Then, VMD method will be run for each mode and produce VMFs for each set of mode. For each mode, all the VMFs will be added up to form a single signal which will be compared using SDA method with the input signal. Then, the smaller value to the steady state of SDA will be selected as mode number for the input signal. Simulated signal with Gaussian white noise is used to validate the proposed method.
Fig. 1Three simulated signals
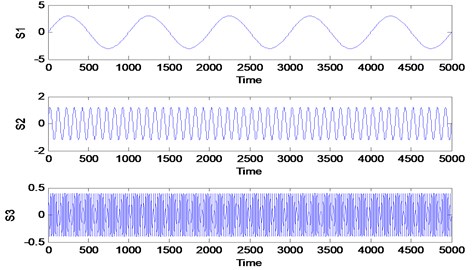
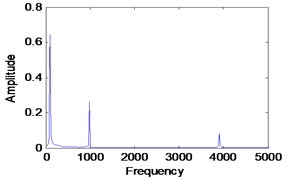
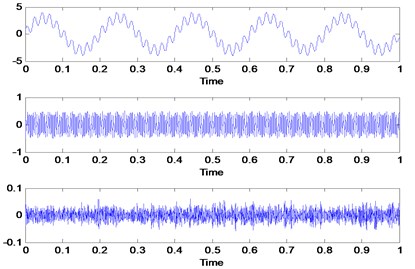
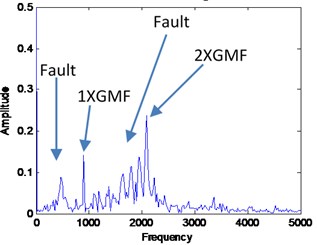
Fig. 2Input simulated signals and it frequency spectrum
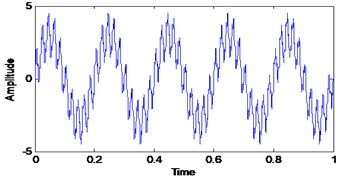
a) Simulated signals
b) Frequency spectrum
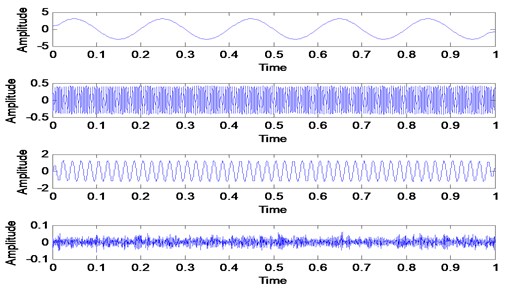
Fig. 3VMD decomposition result for simulated signals
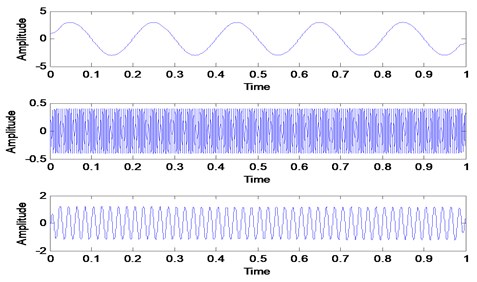
Fig. 4Sum of VMFs and it frequency spectrum
a) Sum of VMFs
b) Frequency spectrum
Fig. 5Proposed mode determination method framework
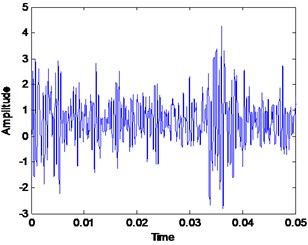
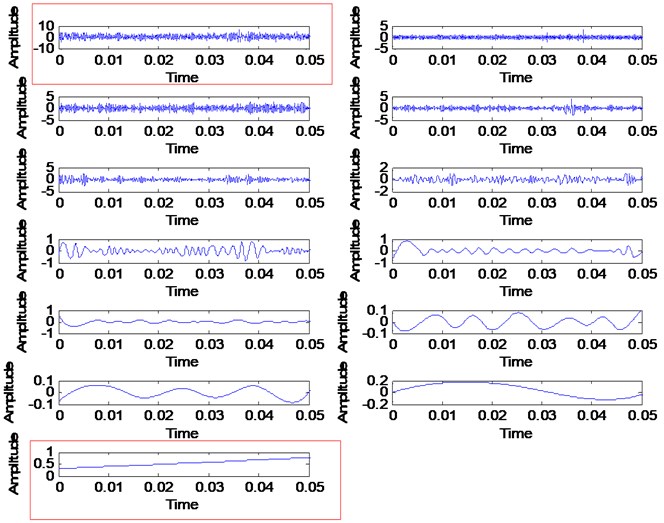
For a simulated signal in Fig. 6, the Gaussian white noise is added with the signal to-noise ratio is set to 25. In order to run the proposed automated mode determination method, the maximum number of the mode is set to 10. The exact number of the mode is unknown due to noise added to the signal. Others VMD parameters are set to a standard value based on [14, 16]. Then, the proposed method is run for the simulated signal shown in Fig. 6 and the result is shown in Fig. 7. Starting from 4 modes to 10 modes, the SDA value is the smallest to steady state. Therefore, the exact number of the mode is 4 as it is the starting point for the smallest SDA value. The VMD decomposition results are shown in Fig. 8. The first three VMFs is the three-simulated signal same as in Fig. 1. The fourth VMF is the Gaussian white noise that has been added to the signal. Now, we will choose the 3, 5 and 6 as mode number and the VMD decomposition result shown in Fig. 9. When the mode is 3, the decomposition result is inaccurate due to none of the VMFs produce represent the three-simulated signal shown in Fig. 1. When the mode number is 5 and 6, the first three VMFs is the three-simulated signal shown in Fig. 1 and the others VMFs is a noise from the signal itself. This is expected due to smallest SDA value for this mode number. Therefore, we can conclude that the mode number can be selected from the smallest SDA value to steady state value which is 4 to 10 for this signal. But, the best practice will be the first smallest value of SDA selected as the mode number to avoid any redundancies after decomposition result and save computational time.
Fig. 6Simulated signal with Gaussian white noise
a) Simulated signal
b) Frequency spectrum
Fig. 7SDA plot between sum of VMFs and input signal
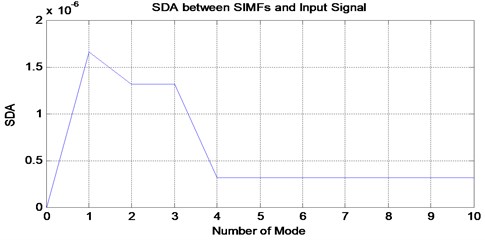
Fig. 8VMD decomposition result for simulated signal when the mode is 4
4. Applications
In this section, the proposed automated mode determination method was applied and tested with the real rotating machinery vibration data that is usually more complex and noisy in order to show its capability and efficiency in determining accurate mode number. Wind turbine gearbox and bearing online data set from Acoustics and Vibration Database have been used [34, 35].
Fig. 9VMD decomposition result with a different number of mode: a) mode is 5, b) mode is 6, c) mode is 3
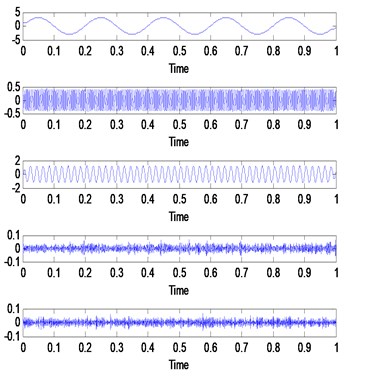
a)
b)
c)
4.1. Case 1: Wind turbine gearbox diagnosis
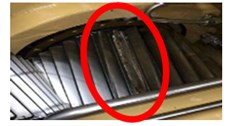
The wind turbine was used to convert non-polluting and renewable wind energy into electricity. Due to the long operation and harsh working environment, wind turbines always subject to failures such as wear as shown in Fig. 10. It is very important for any wind energy company to diagnose their asset frequently in order to avoid any fatalities. Recently, VMD method offers a good diagnosis for many rotating machineries that will be useful for many industries including wind energy company [14, 36, 37]. Online vibration data has been used for this study. The data was taken from Vestas V90 Hansen gearbox. The power rating for the gearbox is 3 MW with a nominal speed of 1800 rpm (30 Hz). Vibration data was taken in a radial direction which places on the gearbox casing. The sampling rate is 97656 Hz with a recording time of 6 seconds. The gear has 32 teeth with gear mesh frequency of 960 Hz. The vibration datasets have been taken in two different conditions which is healthy condition and faulty condition. The healthy and faulty vibration signal is shown in Fig. 11.
Fig. 10Vestas V90 Hansen gearbox fault condition
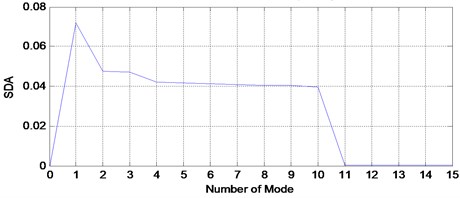
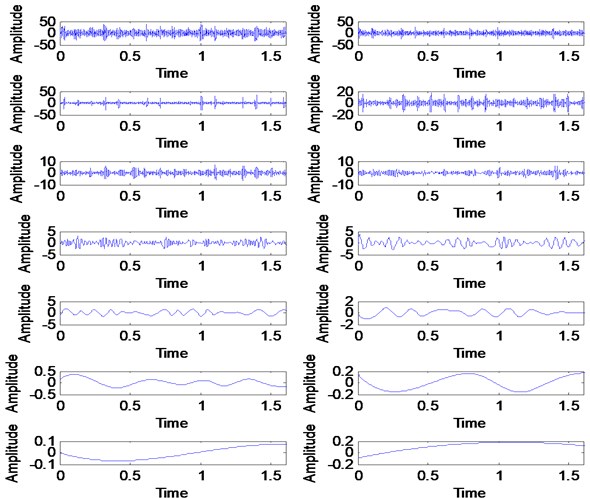
The healthy and faulty signal were decomposed into sets of VMFs by using VMD method. However, the exact number of the mode is unknown for both signals. It is very important to have an accurate number of mode for each signal in order to have a good and accurate diagnosis result. Therefore, the proposed mode determination method has been applied to both signals in order to determine its mode number. By following the flow in Fig. 5, the smallest value of SDA to steady state is selected as the mode number for each signal. Therefore, the number of mode for healthy signal is 7 and the number of mode for the faulty signal is 11. The result is shown in Fig. 12 and Fig. 13 respectively. It is expected for the faulty signal to have more mode number due to signal complexness. Then, both numbers of mode was initiate in VMD method for decomposition process. Others VMD parameters are set to a standard value based on recommended parameter value [14, 16]. The decomposition result of the healthy signal is shows in Fig. 14 with its corresponding FFT in Fig. 15. For faulty signal, the result is shows in Fig. 16 with its corresponding FFT in Fig. 17.
Fig. 11Healthy and faulty vibration data of wind turbine gearbox
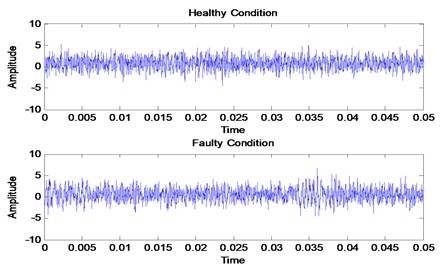
Fig. 12SDA plot for healthy signal
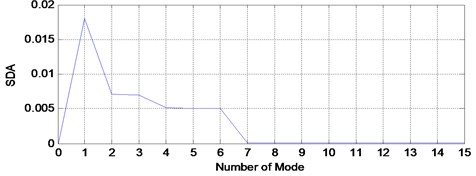
Fig. 13SDA plot for faulty signal
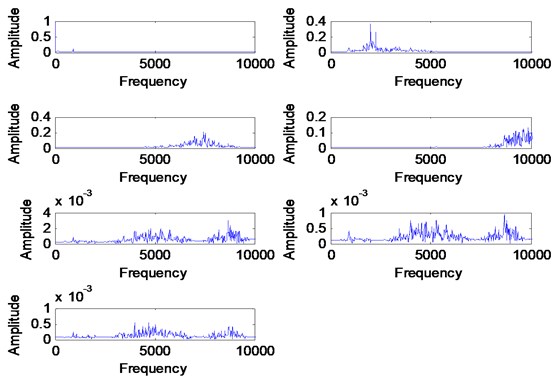
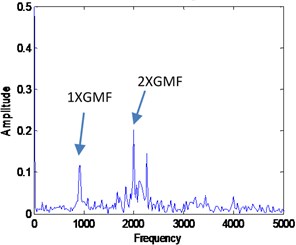
Based on these result, first two VMFs from healthy and faulty signals have been selected to reconstruct the signals as shown in Fig. 18 and Fig. 19 with its corresponding FFT. The VMFs selection is based on the frequency range of required frequency for diagnosis which includes first gear mesh frequency and second gear mesh frequency at 960 Hz and 1920 Hz. Based on the FFT result for each VMFs in Fig. 15 and Fig. 17, VMF1 has a frequency range from 0 to 1000 Hz and VMF2 has a frequency range from 1000 Hz to 2000 Hz which is related to the required frequencies for diagnosis. Other VMFs will be excluded as it has higher frequency range and it is a noise from the signal itself. Then, the same faulty signal has been decomposed using EMD method for comparison purpose. The faulty signal has been decomposed into 13 modes which contain signal itself as the first mode, 11 IMFs and its trend as the last mode as shown in Fig. 20. In order to select most significance IMFs, we use the correlation coefficient method as an indicator as shown in Fig. 21 [38]. First three IMFs with high correlation value are selected for gearbox diagnosis as there are only IMF1, IMF3 and IMF5 have the correlation value higher than 0.5. Other IMFs are excluded as it is not significance for the faulty signal. Hence, the reconstructed signal from EMD is shows in Fig. 22 with its corresponding FFT.
Fig. 14VMD decomposition result for the healthy signal
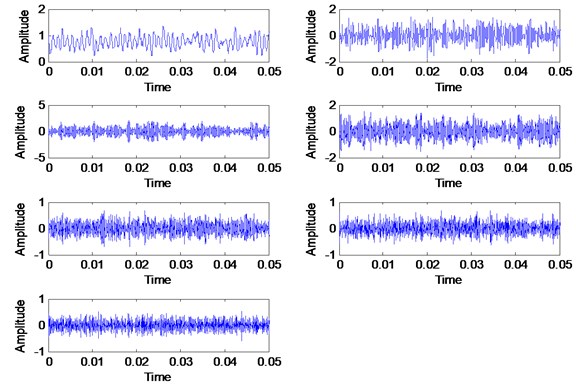
Fig. 15FFT of VMFs for the healthy signal
By comparing the VMD and EMD reconstructed signal results, the fault information’s are more significance in VMD result. The VMD result shown in Fig. 19 shows the first and second gear mesh frequencies at 960 Hz and 2000 Hz respectively and fault frequencies that occurred at 500 Hz and side band around 2000 Hz. The fault information is due to wear fault on gear teeth and may also have other fault occurred in the gearbox due to high peak at sub-harmonic frequency. The EMD result shown in Fig. 22 shows only the second gear mesh frequency with the side-band at 2000 Hz where the information of sub-harmonic frequency and first gear mesh frequency is missing. The problem for this to happen is the high noise contaminated in the signal where the EMD method unable to decompose the signal effectively. Hence, it may lead to wrong diagnosis result which can caused failure to occur during operation. Therefore, we can conclude that VMD method provides more better diagnosis result by having a good and accurate pre-determined mode number. The proposed automated mode determination method also plays an important role to ensure the VMD method capable to provide an accurate diagnosis result by providing the accurate mode number.
Fig. 16VMD decomposition for the faulty signal
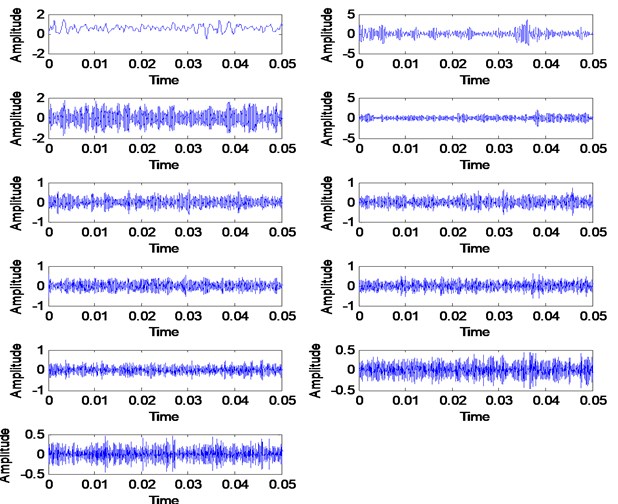
Fig. 17FFT of VMFs for the faulty signal
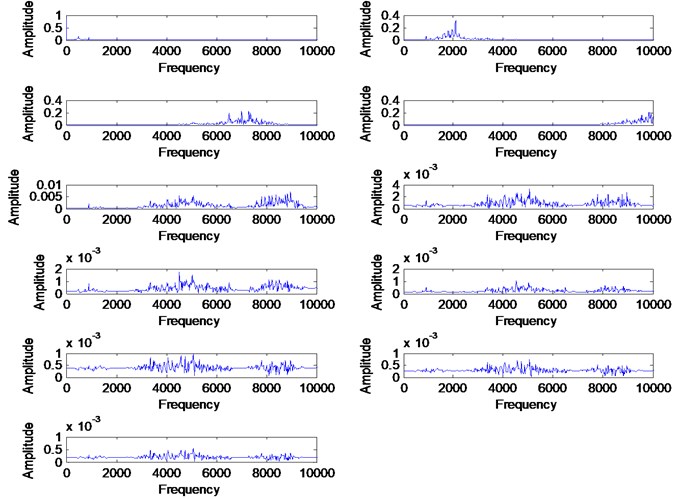
Fig. 18Combined signal of VMF1 and VMF2 with its FFT for the healthy signal
a) Combined signal of IMF1 and IMF2
b) FFT of combine signal
Fig. 19Combined signal of VMF1 and VMF2 with its FFT for the faulty signal
a) Combined signal of IMF1 and IMF2
b) FFT of combine signal
Fig. 20EMD decomposition of the faulty signal, highlighted is the signal itself and the trend
4.2. Case 2: Bearing outer race fault
This dataset has been taken from Spectra Quest Machinery Fault Simulator in the radial direction. This dataset was downloaded online from Acoustic and Vibration Database. The sensor used for this measurement is an accelerometer which places on the bearing housing of the simulator. The sampling frequency is 51200 Hz with recording length of 10 seconds. The rotational speed of the shaft is 29 Hz. Others information for the bearing was described in Table 1. VMD method has been used to decompose outer race fault signal. Before the decomposition process, the proposed automation mode determination method has been used to determine the number of modes. Fig. 23 shows the result which indicates that the number of mode for outer race signal need to be set at 4. Fig. 24 shows the decomposition result of VMD method with its FFT shown in Fig. 25. Then, the outer race fault signal also has been decomposed using EMD method as shown in Fig. 26 with its corresponding FFT in Fig. 27.
Fig. 21IMFs selection for the EMD method
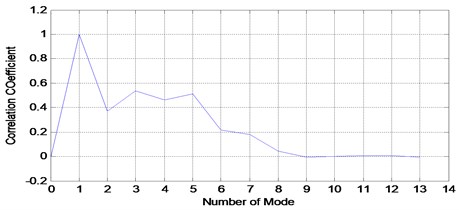
Fig. 22Combined signal of IMF3, IMF4 and IMF5 of EMD decomposition
a) Combined signal
b) FFT of combine signal
Fig. 23SDA for outer race fault signal
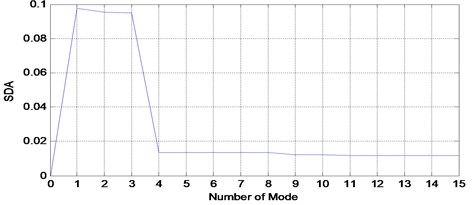
Table 1Bearing information
Name | Information |
Number of balls | 9 |
Ball diameter | 7.9375 mm |
Pitch diameter | 38.50 mm |
Cage frequency (FTF) | 0.359×(shaft speed) |
Ball pass frequency outer (BPFO) | 3.572×(shaft speed) |
Ball spin frequency (BSF) | 2.320×(shaft speed) |
Fig. 24VMFs of VMD method for outer race fault signal
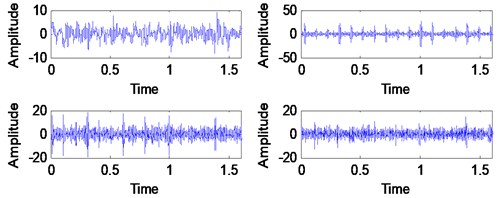
Fig. 25FFT of VMFs for outer race fault using VMD method
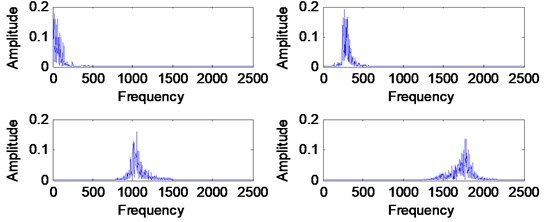
Fig. 26EMD decomposition result for outer race fault
The outer race fault signal can be considered as a clean signal which results to perfect decomposition result by VMD method as no mode represent the noise. This is an expected result for experimental using Spectra Quest Machinery Fault Simulator. In order to diagnose the bearing, the selected VMF and IMF has been used to reconstruct the outer race fault signal. For VMD method, the first two VMF have been selected due to a frequency range of 0 Hz to 500 Hz as the most required frequency is around this range. The reconstructed signal is shown in Fig. 29 with its corresponding FFT. For the EMD method, IMF2, IMF3 and IMF4 have been selected in order to reconstruct the outer race fault signal.
Fig. 27FFT of IMFs for outer race fault
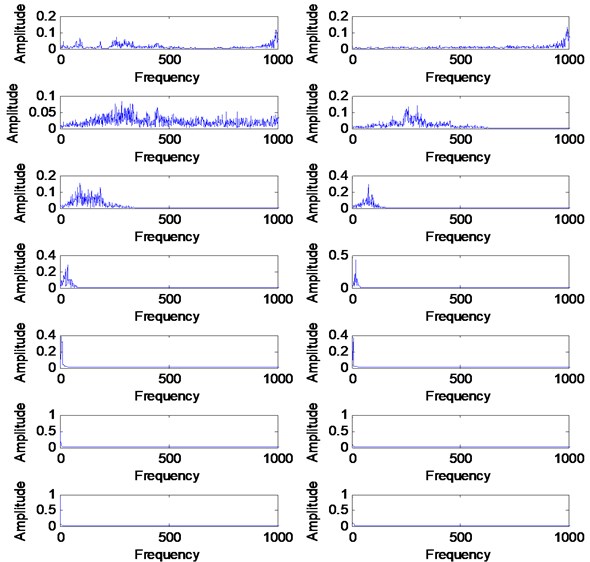
Fig. 28Correlation coefficient for outer race fault
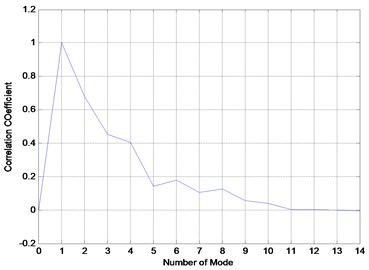
Fig. 29Reconstructed signal of outer race fault
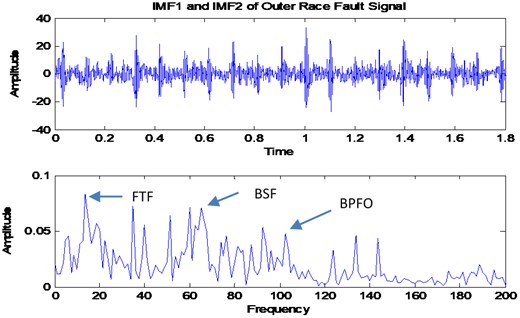
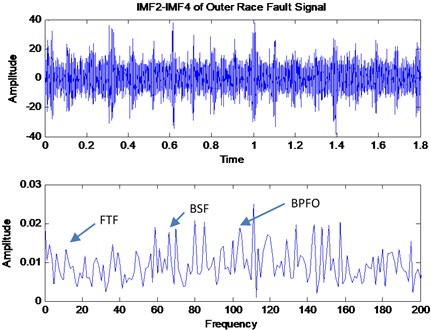
The reconstructed signal is shown in Fig. 30 with its corresponding FFT. By comparing the VMD and EMD result, the VMD result shows more dominant peaks for FTF, BSF and BPFO. This is due to the capabilities of VMD method to avoid information losses during the decomposition process. Accuracy in determining the number of modes also influence the diagnosis result as the accurate decomposition will reduce the information losses during the decomposition process.
Fig. 30Reconstructed signal of IMF2-IMF4 for outer race fault
5. Conclusions
The method proposed in this paper overcomes the mode determination problem for VMD method which provides an accurate number of mode for rotating machinery signals. The method iteratively adopts the similarities concept between VMFs and input signals by calculating using signal difference averaging (SDA) methods. This method has been successfully used for determining the mode number of bearing fault and gear fault signal for fault diagnosis. The accurate number of mode initiated for VMD method makes this method work effectively and efficiently as compared to traditional EMD method for fault diagnosis. However, the proposed method may suffer a computational extensive problem for large signal despite its superiority in determining the exact number of mode. Some of the highlight from this research study are:
1) An accurate number of mode influence the decomposition process and result which also influence the accuracy of rotating machinery diagnosis.
2) Signal difference average method (SDA) is able to provide a good indicator for determining the exact mode number for a signal.
3) Automated mode determination method is able to provide an accurate number of mode for any vibration signal either clean or noisy signal.
4) VMD method avoids information losses as it reconstructed very good signal after decomposition as compared to EMD.
5) Pre-determine parameters for VMD is still considered as a good research direction for future improvement in order to improve its performance.
In the future, we will pay attention to optimizing this method to reduce the computational cost and time.
References
-
Huang Ne, Shen Z., Long S. R., Wu M. C., Shih H. H., Zheng Q., Yen N. C., Tung C. C., Liu H. H. The empirical mode decomposition and the hilbert spectrum for nonlinear and non-stationary time series analysis. Proceedings of the Royal Society A: Mathematical, Physical and Engineering Sciences, Vol. 454, Issue 1971, 1998, p. 995-903.
-
Singh Dheeraj Sharan, Qing Zhao Pseudo-fault signal assisted EMD for fault detection and isolation in rotating machines. Mechanical Systems and Signal Processing, Vol. 81, 2016, p. 202-218.
-
Yang C. Y., Wu T. Y. Diagnostics of gear deterioration using EEMD approach and PCA process. Measurement: Journal of the International Measurement Confederation, Vol. 61, 2015, p. 75-87.
-
Kedadouche M., Thomas M., Tahan A. A comparative study between empirical wavelet transforms and empirical mode decomposition methods: application to bearing defect diagnosis. Mechanical Systems and Signal Processing, Vol. 81, 2014, p. 88-107.
-
Huang Norden E., Wu Zhaohua Ensemble empirical mode decomposition: a noise-assisted data analysis method. Advances in Adaptive Data Analysis, Vol. 1, Issue 1, 2009, https://doi.org/10.1142/S1793536909000047.
-
Yeh Jia Rong, Jiann Shing Shieh Complementary ensemble empirical mode decomposition: a novel enhanced data analysis method. Advances in Adaptive Data Analysis, Vol. 2, 2010, p. 135-156.
-
Zheng Jinde, Cheng Junsheng, Yang Yu Partly ensemble empirical mode decomposition: an improved noise-assisted method for eliminating mode mixing. Signal Processing, Vol. 96, 2014, p. 362-374.
-
Li Hongguang, Hu Yue, Li Fucai, Meng Guang Succinct and fast empirical mode decomposition. Mechanical Systems and Signal Processing, Vol. 85, 2017, p. 879-895.
-
Zhao H. M., Li D. Y., Deng W., Yang X. H. Research on vibration suppression method of alternating current motor based on fractional order control strategy. Proceedings of the Institution of Mechanical Engineers, Part E: Journal of Process Mechanical Engineering, Vol. 231, 2016, p. 786-799.
-
Deng Wu, Yao Rui, Zhao Huimin, Yang Xinhua, Li Guangyu A novel intelligent diagnosis method using optimal LS-SVM with improved PSO algorithm. Soft Computing, 2017, https://doi.org/10.1007/s00500-017-2940-9.
-
Zhao H., Sun M., Deng W., Yang X. A new feature extraction method based on EEMD and multi-scale fuzzy entropy for motor bearing. Entropy, Vol. 19, Issue 1, 2017, p. 14.
-
Li Zhixiong, Jiang Yu, Guo Qiang, Hu Chao, Peng Zhongxiao Multi-dimensional variational mode decomposition for bearing-crack detection in wind turbines with large driving-speed variations. Renewable Energy, Vol. 116, 2018, p. 55-73.
-
Mohanty S., Gupta K. K., Raju K. S. Comparative study between VMD and EMD in bearing fault diagnosis. 9th International Conference on Industrial and Information Systems (ICIIS), 2014.
-
Zhang Ming, Jiang Zhinong, Feng Kun Research on variational mode decomposition in rolling bearings fault diagnosis of the multistage centrifugal pump. Mechanical Systems and Signal Processing, Vol. 93, 2017, p. 460-493.
-
Zhang Dong, Feng Zhipeng Application of variational mode decomposition based demodulation analysis in gearbox fault diagnosis. IEEE Instrumentation and Measurement Technology Conference, 2016.
-
Dragomiretskiy Konstantin, Dominique Zosso Variational mode decomposition. IEEE Transactions on Signal Processing, Vol. 62, 2014, p. 531-544.
-
Li Zipeng, Chen Jinglong, Zi Yanyang, Pan Jun Independence-oriented VMD to identify fault feature for wheel set bearing fault diagnosis of high speed locomotive. Mechanical Systems and Signal Processing, Vol. 85, 2017, p. 512-529.
-
Wang X. B., Yang Z. X., Yan X. A. Novel particle swarm optimization-based variational mode decomposition method for the fault diagnosis of complex rotating machinery. IEEE/ASME Transactions on Mechatronics, Vol. 23, 2018, p. 68-79.
-
Zhu Jun, Wang Chao, Hu Zhiyong, Kong Fanrang, Liu Xingchen Adaptive variational mode decomposition based on artificial fish swarm algorithm for fault diagnosis of rolling bearings. Proceedings of the Institution of Mechanical Engineers, Part C: Journal of Mechanical Engineering Science, Vol. 231, 2015, p. 635-654.
-
Deng Wu, Zhao Huimin, Yang Xinhua, Xiong Juxia, Sun Meng, Li Bo Study on an improved adaptive PSO algorithm for solving multi-objective gate assignment. Applied Soft Computing, Vol. 59, 2017, p. 288-302.
-
Deng Wu, Zhao Huimin, Zou Li, Li Guangyu, Yang Xinhua, Wu Daqing A novel collaborative optimization algorithm in solving complex optimization problems. Soft Computing, Vol. 21, 2017, p. 4387-4398.
-
Deng Wu, Zhao Huimin, Liu Jingjing, Yan Xiaolin, Li Yuanyuan, Yin Lifeng, Ding Chuanhua An improved CACO algorithm based on adaptive method and multi-variant strategies. Soft Computing, Vol. 19, 2015, p. 701-713.
-
Deng Wu, Chen Rong, He Bing, Liu Yaqing A novel two-stage hybrid swarm intelligence optimization algorithm and application. Soft Computing, Vol. 16, 2012, p. 1707-1722.
-
Pająk Michał Identification of the operating parameters of a complex technical system important from the operational potential point of view. Proceedings of the Institution of Mechanical Engineers, Part I: Journal of Systems and Control Engineering, Vol. 232, 2017, p. 62-78.
-
Lahmiri Salim, Amir Shmuel Variational mode decomposition based approach for accurate classification of color fundus images with hemorrhages. Optics and Laser Technology, Vol. 96, 2017, p. 243-248.
-
Upadhyay Abhay, Manish Sharma, Ram Bilas Pachori Determination of instantaneous fundamental frequency of speech signals using variational mode decomposition. Computers and Electrical Engineering, Vol. 62, 2017, p. 630-647.
-
Zhang Chu, Zhou Jianzhong, Li Chaoshun, Fu Wenlong, Peng Tian A compound structure of ELM based on feature selection and parameter optimization using hybrid backtracking search algorithm for wind speed forecasting. Energy Conversion and Management, Vol. 143, 2017, p. 360-376.
-
Jianwei E., Yanling Bao, Jimin Ye Crude oil price analysis and forecasting based on variational mode decomposition and independent component analysis. Physica A: Statistical Mechanics and Its Applications, Vol. 484, 2017, p. 412-427.
-
An Xueli, Zeng Hongtao, Li Chaoshun Envelope demodulation based on variational mode decomposition for gear fault diagnosis. Proceedings of the Institution of Mechanical Engineers, Part E: Journal of Process Mechanical Engineering, Vol. 231, Issue 4, 2017, p. 864-870.
-
Cheng Junsheng, Yu Dejie, Tang Jiashi, Yang Yu Local rub-impact fault diagnosis of the rotor systems based on EMD. Mechanism and Machine Theory, Vol. 44, 2009, p. 784-791.
-
Liu Xiaofeng, Bo Lin, Luo Honglin Bearing faults diagnostics based on hybrid LS-SVM and EMD method. Measurement: Journal of the International Measurement Confederation, Vol. 59, 2015, p. 145-166.
-
Yang Yu, He Yigang, Cheng Junsheng, Yu Dejie A gear fault diagnosis using Hilbert spectrum based on MODWPT and a comparison with EMD approach. Measurement: Journal of the International Measurement Confederation, Vol. 42, 2009, p. 542-551.
-
Junsheng Cheng, Dejie Yu, Yu Yang A fault diagnosis approach for roller bearings based on EMD method and AR model. Mechanical Systems and Signal Processing, Vol. 20, 2006, p. 350-362.
-
Forbes Gareth Inner and Outer Race Bearing Fault Vibration Measurements. Acoustics and Vibration Database, 2012, http://data-acoustics.com/measurements/bearing-faults/bearing-1.
-
Bechhoefer Eric High Speed Gear Dataset. Acoustics and Vibration Database, 2014, http://data-acoustics.com/measurements/gear-faults/gear-1.
-
An Xueli, Pan Luoping Bearing fault diagnosis of a wind turbine based on variational mode decomposition and permutation entropy. Proceedings of the Institution of Mechanical Engineers, Part O: Journal of Risk and Reliability, Vol. 231, 2017, p. 200-206.
-
Zhao Hongshan, Li Lang Fault diagnosis of wind turbine bearing based on variational mode decomposition and spectrum kurtosis. IET Renewable Power Generation, 2016, p. 851-854.
-
Firdaus Isham M., Salman Leong M., Hee L. M., Ahmad Z. A. B. Empirical mode decomposition: A review on mode selection method for rotating machinery diagnosis, International Journal of Mechanical Engineering and Technology, Vol. 8, Issue 6, 2017, p. 16-26.
About this article

The authors would like to extend their greatest gratitude to the Institute of Noise and Vibration UTM for funding the study under the Higher Institution Centre of Excellence (HICoE) Grant Scheme (R.K130000.7809.4J226). Additional funding for this research also comes from the UTM Research University Grant (Q.K130000.2543.11H36), and Fundamental Research Grant Scheme (R.K130000.7840.4F653) by The Ministry of Higher Education Malaysia.
