Abstract
In order to further extend the effective isolation range of the quasi-zero stiffness (QZS) platform, the vibration isolation performance of the chaotic interval is improved. For a class of self-design quasi-zero-stiffness (QZS) vibration isolation platform, starting with chaotic motion of the non-linear vibration isolation system, the jumping interval is eliminated by means of transient chaos phenomena. The control method of damping increase is proposed in combination with the application of the Von der Pol Plane, which can make the jumping-down frequency to be decreased below the external excitation frequency, thus the effective isolation range of vibration isolation platform can be extended, and a lower isolation frequency can be obtained. Research shows that, when the solution of the motion equation of the platform system falls to resonant branch led by certain initial conditions, the resonant amplitude response will jump to the non-resonant branch by transient damping increase control method, which the removal time is determined by the Von der Pol Plane, hence making the platform system obtain the ideal vibration isolation performance. The research results have a significant importance for improving the low frequency and ultra-low frequency vibration isolation effect of such platforms, which lays a foundation for the popularization and engineering application, and can also provide a reference for control of other nonlinear vibration system.
1. Introduction
The existing researches have proved that the parallel mechanism has the advantages of compact structure, good rigidity and strong load bearing capacity, and it can be applied to multi-dimensional vibration isolation field [1, 2]. As a non-linear vibration isolation system, the QZS vibration isolation platform based on a parallel mechanism, a research focus at present in the field of vibration isolation, has outstanding performance in solving the problems in low frequency and ultra-low vibration isolation [3-6]. For example, reference [3] proposed a nonlinear magnetic vibration isolator with quasi-zero-stiffness characteristic; reference [4] proposed a quasi-zero stiffness mechanism using inclined linear springs; reference [5] proposed a torsion quasi-zero stiffness vibration isolator; reference [6] proposed a multi-direction vibration isolation with quasi-zero stiffness by employing geometrical nonlinearity. This kind of vibration isolation platform has the excellent characteristics of “high static low dynamic”, which means high static stiffness and low dynamic stiffness. It can both guarantee sufficient static load bearing capacity, and make the dynamic stiffness theoretically tend to zero, which perfectly meet the requirements of low frequency and ultra-low frequency vibration isolation [7-9]. For example, reference [7] shows that zero stiffness can be achieved under imperfect conditions, and verifies that the proposed isolator can handle a weight ranging from 0 to 6 kg, and an external excitation with the frequency as low as 2.3 Hz can be attenuated; reference [8] show that the quasi-zero stiffness mechanism achieves low stiffness without having a large static deflection at the static equilibrium position; reference [9] shows that the dynamic stiffness of the proposed vibration isolator at the static equilibrium position is zero, which can offer a good effectiveness of isolation for low excitation frequencies.
However, none of those references solve the vibration isolation problem of quasi-zero stiffness platform in the chaotic region. Among them, reference [3] mentioned the jump-down frequency, namely the starting frequency of isolation for a nonlinear vibration isolator, and it concluded that the peak value of the transmissibility curve is effected by the excitation force and the damping; reference [5] shows that the nonlinear QZS vibration isolation system is effective only for the case when excitation frequencies exceed the jump down frequency, and conclude that the jump down frequency reduces with the increase in damping, but increases as the excitation amplitude increases for the proposed torsion quasi-zero stiffness vibration isolator; reference [8] shows that a good isolator should simultaneously achieve low peak transmissibility and wide isolation range, while the peak transmissibility of the compact quasi-zero-stiffness isolator can be readily attenuated by adding a damper, and the isolation range depends on the physical parameters of the isolator; reference [9] shows that the jump-down frequency occurs at the undamped natural frequency of the linear system when the parameters of the nonlinear system are adjusted properly. In addition, reference [10] also shows that such platforms contain unstable area, while the point (, ) is within the range of instability, the disturbance increases with respect to time; reference [11] shows that the jump-down frequency increases as the excitation amplitude increases, and the jump-down frequency is very sensitive to the variation of damping. Increasing damping shortens the resonance branch shapely, and even eliminates it, but makes the isolation performance worse. However, the references give no solution to the problem.
Aiming at how to solve the vibration isolation problem of quasi-zero stiffness platform in the chaotic interval or unstable interval, reference [12] demonstrates that the time-delay active control devices in the horizontal direction significantly improve the isolation effect in the vertical and horizontal directions of the proposed MDQZS-VI by reducing the natural frequencies and resonant peak through choosing appropriate values of structural parameters and using time-delay active control; reference [13] proposed a novel idea of initial value control based on the analysis of attraction basins for coexistent attractors, which would be an effective way to break the obstacle of frequency jump phenomena and multi-solutions coexistence by controlling the system into a desired motion with a small vibration amplitude.
In order to overcome the difficult problem of low frequency vibration isolation, a new vibration isolation platform is designed based on the theory of parallel mechanism, and its dynamic equation is derived. The vibration isolation platform has the excellent characteristics of “high static low dynamic”, which resolve the contradiction between low frequency vibration isolation and load capacity. The parameter matching and displacement transfer characteristics of the vibration isolation platform have been carried out in the early stage [2, 14]. Starting from the chaotic motion of the nonlinear vibration isolation system, this paper proposes a damping increase control method to improve the vibration isolation performance of the vibration isolation platform in the chaotic interval. The vibration isolation performance of the platform is studied emphatically, including the elimination of the jumping interval by means of transient chaos phenomena and the reduction of jumping-down frequency, which is decreased below the external excitation frequency as per the damping increase control method to extend the effective isolation range. The validity of the control method is proved by virtue of Von der Pol Plane evaluation. The research results show that the control method of damping increase can further extend the effective isolation range of the platform, a lower isolation frequency can be obtained, to improve the low-frequency vibration isolation effect of the platform.
2. Physical model and dynamic equation of new QZS vibration isolation platform
2.1. Physical model of platform
The new QZS isolation vibration platform, designed by our research team, is mainly composed of upper and lower springs, which provide negative and positive stiffness respectively. The vibration isolation platform is able to possess quasi-zero stiffness near the static equilibrium position by reasonable arrangement of the position of springs and appropriate matching of the system parameters [14]. At the same time, the flexible adjustment of stiffness and damping of the vibration isolation platform enables it to regain quasi-zero stiffness near the static equilibrium position by adjusting the stiffness and damping coefficients when the mass of the isolated object is changed, to improve the versatility of the vibration isolation platform.
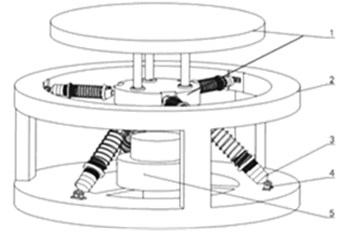
Fig. 1Physical model of QZS isolation vibration platform: 1 – stage, 2 – rack, 3 – elastic vibration reduction component, 4 – hinge, 5 – position limiter
a) Static equilibrium position
b) Initial position
As shown in Fig. 1, the QZS isolation platform consists of five parts: 1 – stage, 2 – rack, 3 – elastic vibration reduction component, 4-hinge, 5- position limiter. The isolated object is installed on the stage. The rack is used to install components and parts. The vibration reduction component is intended to mitigate impact and external vibration excitation. The hinge ensures flexible motion between the vibration reduction component and the rack. The position limiter prevents from a damage caused by overload. The vibration reduction component consists of a damper and elastic elements. The damping of the damper can be adjusted according to the mass of the isolated object. In the static equilibrium position, the upper spring of the elastic element is in the tensional working state, offering vertical negative stiffness, while the lower one is in the compressed working state, offering vertical positive stiffness. The original length of each spring and preload of the isolation platform can be flexibly adjusted to enhance the versatility and controllability of the platform.
2.2. Static equation of platform
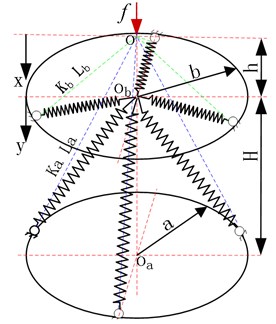
A simplified vertical mechanical model of the vibration isolation platform is shown in Fig. 2. In the figure, and are the distances from the hinge centers of the upper and lower springs and the outer frame to the axis of the vibration reduction platform, respectively. The displacement of the initial position is defined as the vertical displacement of the intersection point of the upper and lower springs. represents the vertical distance between and , the centers of upper and lower platforms. is the vertical distance between the initial top intersection of the inclined springs and the static equilibrium position, where the platform starts to have quasi-zero stiffness, assuming that the static equilibrium position of the vibration isolation platform coincides with the center . and are the original lengths of the upper and lower springs respectively when the top intersection point of the inclined springs is in the initial position.
As shown in Fig. 2, the lower spring with the stiffness and the upper one with the stiffness intersect at the point . Both the upper and lower springs are slightly compressed. With the vertical static force acting at the initial position , the relationship between the total elastic recovery force and the displacement of the vibration isolation platform is given by:
where:
which are the working lengths of upper and lower springs respectively when the displacement is .
Fig. 2Vertical mechanical model of vibration isolation platform
So, the Eq. (1) can be expressed as:
With the vertical displacement representing the displacement of the intersection point from the static equilibrium position of the vibration isolation platform, that is the position of , then the Eq. (2) can be transformed into:
When both sides of Eq. (3) are divided by 3, the dimensionless force-displacement equation of the platform can be obtained:
where , , , , , , .
If we take the derivative of on both sides of Eq. (4), the dimensionless equation about stiffness can be expressed as follows:
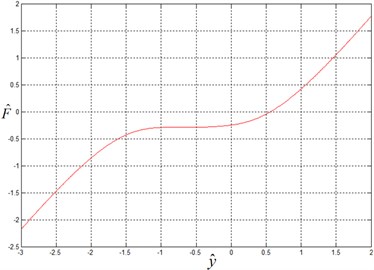
When a set of coefficients is given, the force-displacement curve of the vibration isolation platform can be got, as demonstrated in Fig. 3. It can be seen that the platform displays stable quasi-zero stiffness within a small range when –0.75
Fig. 3Force-displacement curve of platform under selected parameters
2.3. Dynamic equation of platform
It is necessary to simplify Eq. (4) for the convenience of dynamic calculation and analysis. Consequently, the Eq. (4) is extended at point (shown in Fig. 4), that is equals to –0.75, according to the definition of Taylor series. The former three orders are kept. So, it can be expressed:
According to Eq. (4) and (5), the first derivative of elastic recovery force at point is 0, the second derivative is 0, and the third one:
So, the approximate elastic recovery force can be presented as:
If to set:
Then:
Inclusion of the third derivative only in Eq. (10) ensures the convenient of analysis of dynamic performance of the vibration isolation platform. The error between Eq. (10) and (4) is shown in Fig. 4.
Fig. 4Error between approximate force-displacement curve and accurate one
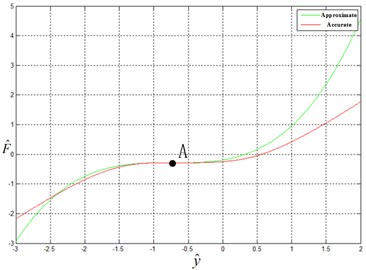
It can be seen from Fig. 4 that the approximate curve largely coincides with the accurate one in the interval (–2.4, –1.3). When the intersection point of the spring vibrates near point in the small range, the approximate curve coincides exactly with the accurate one, making it feasible to replace the accurate Eq. (4) of elastic recovery force with the approximate Eq. (10) in the range of small vibration.
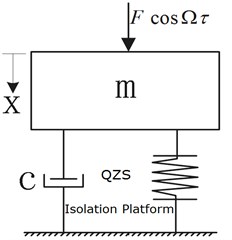
It was supposed that the vibration isolation platform slightly vibrates in small range near point A, where the stiffness tends to zero. The simplified dynamic model of the platform is shown in Fig. 5.
Fig. 5Dynamic model of platform
Under the simple harmonic excitation condition, the approximate force-displacement equation of the platform can be presented as follows:
where the stiffness of the system:
Furthermore, the Eq. (11) can be changed to Duffing equation that contains only non-linear terms to represent the force-displacement equation of the vibration isolation platform [15-17]. It can be expressed as follows:
where , , , , , .
3. Amplitude-frequency characteristic of platform
By using the harmonic balance method, the same order harmonic term on both sides of the differential equation has the same coefficient. In the meanwhile, only the predominant excitation frequency is considered but with ignoring higher harmonic terms [18]. The periodic response of Eq. (12) is as follows:
where is the system response amplitude, represents the response phase of the system, is the harmonic excitation frequency.
Upon substitution of Eq. (13) into Eq. (12), it can be got:
Upon the elimination of phase in Eq. (14), the amplitude-frequency characteristic equation of the platform can be obtained:
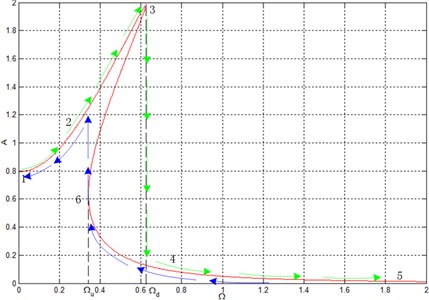
With the stiffness ratio, damping ratio, excitation force amplitude = 0.05, the vibration amplitude-frequency characteristic curve of the platform can be acquired by using the command ezplot() of Matlab implicit function, as shown in Fig. 6.
As can be seen in Fig. 6, when the excitation frequency changes in different directions, the system amplitude response is as follows:
1) When the excitation frequency gradually increases from zero.
When the excitation frequency increases from zero, the response amplitude changes are shown in the green arrow line in Fig. 6. The response amplitude first increases along the upper branch, namely the resonant branch: starting from point 1, via point 2, then reaching point 3, which corresponds to the maximum amplitude and the jumping-down frequency .That is to say, as the excitation frequency continues to increase, the response amplitude jumps directly to point 4 on the lower branch, non-resonant branch, finally to point 5 and extends infinitely.
2) When the excitation frequency gradually decreases from infinity to zero.
When the excitation frequency decreases from high frequency to low frequency, the changing tendency of the response amplitude is shown in the blue arrow line in Fig. 6. The response amplitude first increases along the non-resonant branch: starting from point 5, via point 4, then reaching point 6, which corresponds to the jumping-up frequency . That is to say, as the excitation frequency continues to decrease, the response amplitude jumps directly to point 2 on the resonant branch, finally changes to point 1 along the resonant branch.
In summary, only when the external excitation frequency is larger than then the system amplitude response will certainly change along the non-resonant branch. The excitation frequencies in the jumping range cause in uncertain amplitude-frequency response of the system, which may fall to the resonant branch curve with a large amplitude or on the non-resonant curve with a small amplitude. It is obvious that only when the amplitude frequency response changes along the non-resonant branch, the system has vibration isolation characteristics.
In general, to make the solution of its dynamic differential equation tend to the non-resonant branch with a small amplitude, it is required that the excitation frequency is larger than the jumping-down frequency for the non-linear vibration isolation system. However, it can be seen in Fig. 6 that the isolation system, starting from the jumping-up frequency, already has excellent vibration isolation capability. As a result, the extension of the available vibration isolation interval in the system to jump-up frequency is an effective measure to improve the low frequency vibration isolation capability of the system.
Fig. 6Amplitude-frequency characteristic curve of platform. Ωu is jumping-up frequency and Ωd is jumping-down frequency
4. Jumping frequency of system
4.1. Jumping-down frequency
By expanding the amplitude-frequency characteristic Eq. (15), it can be obtained:
If Eq. (16) is regarded as the equation about, using the formula of root, we can get:
In an actual system, the damping ratio is far less than one, and the excitation frequency can be only positive. As a result, based on the actual meaning, the expression in the radical sign must be non-negative. So:
The amplitude-frequency characteristic curve in Fig. 8 shows that the frequency corresponds to the maximum amplitude point is the jumping-down frequency , so . That is:
Based on the formula of root, the maximum root, namely the maximum amplitude, of Eq. (19) can be attained:
As the damping ratio is far less than one, then , so the approximate maximum amplitude can be expressed:
By substituting the approximate into quadratic equation with one unknown about , that is Eq. (16), the approximate jumping-down frequency can be got:
Furthermore, since , it can be got:
It can be seen from Eq. (23) that the increase of the damping ratio brings about lower jumping-down frequency .
4.2. Jumping-up frequency
It shows that the change of the damping ratio exerts little influence to the jumping-up frequency [19]. The approximate value of the jumping-up frequency is obtained by setting 0.
With 0, it can be found from the amplitude-frequency characteristic Eq. (16) that the amplitude corresponding to the jumping-up frequency is the solution of Eq. (16) when 0. It can be got:
By substituting of the approximate into the quadratic equation with one unknown about , which is Eq. (16), the approximate jumping-up frequency can be got:
4.3. Influence of system damping control on jumping interval
For the common non-linear vibration isolation system, the effective vibration isolation frequency is the external excitation frequency that is larger than [20, 21]. That is to say, only when the excitation frequency is not less than the jumping-down frequency the system obtains the satisfactory vibration isolation effect. From the text above, under harmonic excitation, the jumping-up frequency:
and jumping-down frequency:
The influence of the jumping-up and jumping-down frequency on the jumping interval is shown in Fig. 7.
Fig. 7Influence of damping ratio ζ on jumping frequency
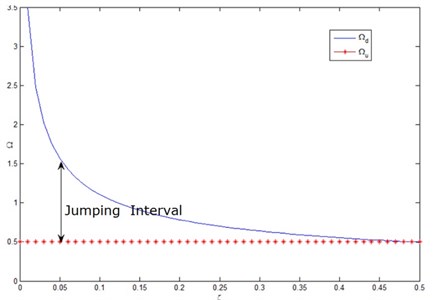
It can be seen from Fig. 7 that, with the increase of the system damping ratio, the jumping-up frequency remains the same, while the jumping-down frequency decreases obviously, indicating the great sensitivity of the jumping-down frequency of the system to the system damping ratio. Therefore, a control method is proposed to increase the system damping. By using the transient chaotic motion state in the jumping interval, the ideal result is realized that the amplitude response jumps from the resonant branch to the non-resonant one. Specific ideas are as follows:
Under certain initial conditions, the increase control of damping ratio of the system makes the jumping-down frequency gradually decrease, and ultimately to be less than the excitation frequency so that the system response jumps to the non-resonant branch with small amplitude when it is on the resonant branch with a large amplitude. At this time, the large amplitude resonant motion of the system will appear to be in the transient chaotic state. The influence of non-resonant steady focus attraction makes the amplitude response tend to the non-resonant branch.
In order to ensure that the system amplitude response of any initial value can fall to the non-resonant branch with a small amplitude, the removal time of damping is determined by the Von der Pol plane [22]. Specifically, the damping ratio of the system increases when there are some initial values on the resonant branch; the damping ratio is removed when all the initial values fall to the non-resonant branch with a small amplitude. After the transient state, the system will do simple harmonic vibration again, and the system response amplitude will fall to the non-resonant branch. In this way, the initial vibration isolation frequency of the platform can be reduced to the jumping-up frequency so that the effective low-frequency isolation interval is further expanded.
5. Effect of control of damping increase
5.1. Application of Von der Pol plane
Taking the system state at the control removal time as an initial condition, a new set of response expressions is used to describe the changing relationship between the system phase and amplitude with time. The expressions are as follows:
where and are the amplitude coefficients of harmonic waves.
By substituting of Eq. (26) into Eq. (12), ignoring high order harmonic terms, the first-order differential equations with respect to the coefficients and can be expressed as follows:
The initial value under the initial condition where , is exactly the solution of the dynamic equation of the system on the Von der Pol plane.
Under certain initial conditions, the damping is removed when the system amplitude response all tend to the non-resonant branch with a small amplitude by observing the solution curve (, ). For all initial conditions of the system, if the amplitude response has fully fallen to the non-resonant branch before removal of the damping control, then the amplitude response of the system will definitely fall to the non-resonant branch where the system attains the capability of vibration isolation after the removal of the damping control.
5.2. Response of system in control of damping increase
Under the simple harmonic vibration condition, the initial system condition is (0.01, 0), as shown in Fig. 8. When (0, 2000), the damping control has not yet been applied to the system, where the response amplitude reaches 0.1243. The large response amplitude indicates that the solution of the motion equation falls to the resonant branch with large amplitude, and the force transmissibility of the system as shown in Fig. 9. As the force transmissibility is larger than one, the vibration isolation system will bring about an increased amplitude, so the system will not attain vibration isolation capability, even worse, it will deteriorate the working environment of the isolated objects.
The parameters of the vibration isolation system are shown in Table 1.
Table 1System parameters
System parameters | Initial values |
Damping | 0.01 |
External excitation frequency | 0.25 |
Excitation amplitude | 0.3 |
Non-linear term coefficient | 2 |
In order to verify its effectiveness, damping control ( 0.02) is applied to the system when 2000. During this process, the change of system response is visually shown before and after the damping control is imposed.
From the simulation time 2000, the system, after the transient state, remains in the harmonic vibration state, but the vibration amplitude obviously changes: The system amplitude has been greatly reduced as compared with that of the damping control is not applied. As shown in Fig. 8, after the damping control is applied when (2000, 4000), the system amplitude is reduced to 0.01609; the small response amplitude indicates that the system falls to the non-resonant branch with a small amplitude. The transmissibility 0.08142, decreased by 99.3 percent as compared with that before the damping control is applied, making the system has a very excellent vibration isolation ability.
Fig. 8Response of vibration isolation system with time
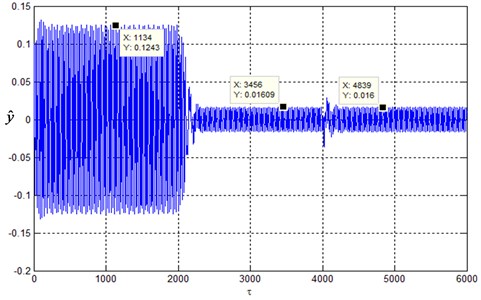
In order to study whether the system state still meets the requirements of vibration reduction and isolation after the removal of damping control, the damping control of the system is removed from the simulation time 4000 (restoring system damping ratio 0.01). It can be seen from Fig. 8 that during the time (4000, 6000), the system still returns to the harmonic vibration state after the transient state. The system amplitude response, before and after the damping control is removed, does not change, and the response amplitude remains 0.016. In the range (4000, 6000), the response amplitude almost does not change, indicating that on the removal of the damping control, the amplitude response of the system still change along the non-resonant branch.
Fig. 9Transmissibility of system in different damping ratio
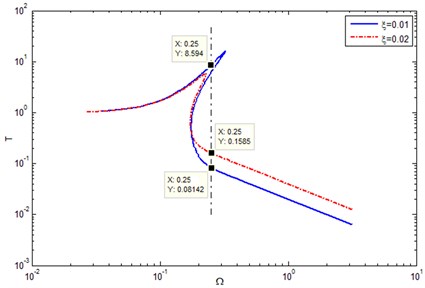
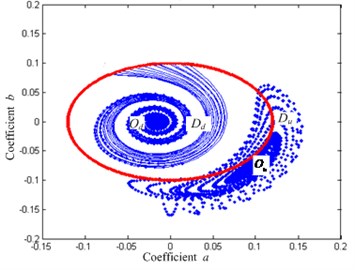
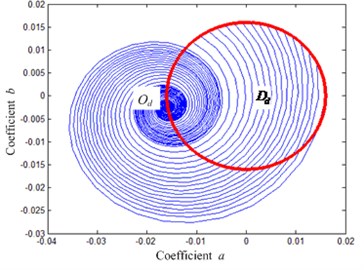
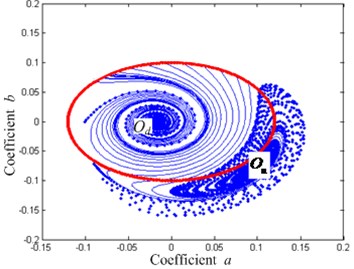
As per Fig. 8, when the control damping increases, the maximum displacement of the system response , the maximum velocity 0.04 Therefore, all the points satisfying 0.01609 and 0.04 are the initial conditions of the QZS isolation system, that is to say, all the values in the red circle in Figure 10 can be used as the initial system conditions. The curves form two different areas under different initial conditions: (the area indicated by the dashed line) and (the area indicated by the solid line). The two areas represent the equations of system motion, namely the solutions of Eq. (2) are in the resonant and non-resonant branches. The dashed line in Fig. 10 means that the response of the system under the initial conditions will tend to a stable focal point (on the resonant branch); the solid line means that the system response under this initial condition will tend to a stable focal point (on the non-resonant branch). If the system response is in the area indicated by the dashed line, namely the system vibration amplitude will vary along the resonance branch with a large amplitude before the system damping control is removed; if the system response is in the area indicated by the solid line, namely the system vibration amplitude will vary along the non-resonant branch with a small amplitude.
Fig. 10Solutions of different damping ratio on Von der Pol plane when Ω= 0.25
a) 0.01
b) 0.02
5.3. Effect evaluation of control of damping increase
Supposing the external excitation frequency 0.25, the change is shown in Fig. 10 and in solutions of the system motion differential equation, Eq. (12), on the Von der Pol Plane under different damping ratio conditions. It can be concluded that: 1) When no damping control is applied to the system ( 0.01, shown in Fig. 10(a)), only a half of the initial conditions eventually make the system amplitude fall to the non-resonant branch, the other make it fall to the resonant one. 2) When the damping control is applied to the system ( 0.02, shown in Fig. 10(b)), all the initial conditions fall to area , that is to say, all the initial conditions make the system amplitude fall to the non-resonant branch in the control of damping increase. Even though the damping is removed at this time, the system, after the transient state, must fall to the non-resonant branch with a small amplitude, which is caused by the fact that when the system damping is large enough, so the jumping-down frequency will be lower than the excitation frequency , leading to instability of the large-amplitude resonant motion of the system, which makes the response fall to the non-resonant branch. Therefore, by appropriate damping control, all the system amplitude and frequency responses caused by external excitation frequency fall to the non-resonant branch.
Assuming that the external excitation frequency 0.17, the change is shown in Fig. 11 and in the solutions of the system motion differential equation, Eq. (12), on the Von der Pol plane under different damping ratio conditions. In Fig. 11(a), the area tending to the stable focus does not contain the system responses under all initial conditions. That shows that the system response under a certain initial condition may fall to the stable focus on the resonant branch, resulting in a loss of vibration isolation ability of the system. On the application of control of damping increase to the system ( 0.02), the curves starting from all the initial conditions tend to the stable focus (shown in Fig. 11(b)). It is shown that at the excitation frequency, after the system damping is increased, all the solutions of the system differential equation of motion will be located in the non-resonant branch, and after removal of the damping control, the system can still remain on the non-resonant branch with a low amplitude, eventually achieving the purpose of solutions of the system motion equation jumping from the resonant branch to the non-resonant one.
Fig. 11Solutions of different damping ratio on Von der Pol plane when Ω= 0.17
a) 0.01
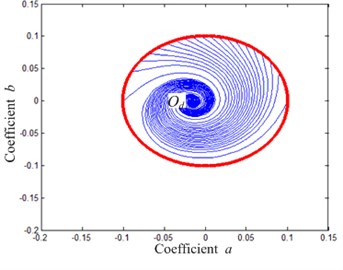
b) 0.02
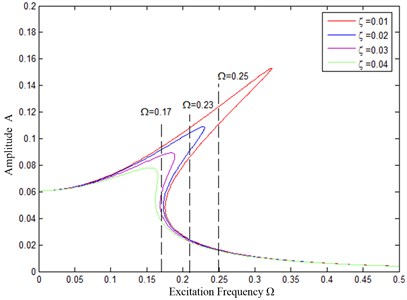
To further illustrate the effectiveness of the proposed method, the effect of increased vibration damping is explored by the following amplitude-frequency response curve. As shown in Fig. 12, when the excitation frequency is 0.25, upon the increase of damping from 0.01 to 0.02, the jumping-down frequency of the blue amplitude-frequency response curve is less than the excitation frequency. So, the system amplitude will jump from the resonant branch to the blue non-resonant one. Since the blue non-resonant branch almost coincides with the non-resonant system branch, the red curve, before damping control is applied; the amplitude-frequency response curve of the system will tend to the original non-resonant branch after the damping control is removed. When the excitation frequency 0.23, the jumping-down frequency ( 0.24) of the blue amplitude-frequency response curve is still greater than the excitation frequency ( 0.23), for which the damping increase is small. So, in order to make the excitation frequency greater than the jump frequency and to avoid the uncertainty of the amplitude response of the system, it is necessary to further increase the damping control. When the system damping ratio is increased to 0.03, the jumping-down frequency ( 0.18) of the purple amplitude-frequency characteristic curve in Fig. 12 is smaller than the excitation frequency ( 0.23), then the damping control can be removed at this time. Similarly, when the excitation frequency 0.17, it is necessary to increase the damping to 0.04 before the damping control can be removed (shown in the green curve in Fig. 12). Therefore, different damping increases are applied to different excitation frequencies. Equipped with a flexible damping control mechanism, the QZS vibration isolation platform will always work in the non-resonant branch, which greatly improves the low-frequency vibration isolation performance of the platform.
Fig. 12Relationship between damping increase and excitation infrequency
6. Conclusions
For a non-linear vibration isolation system, only when the excitation frequency is higher than its jumping-down frequency, the system can exhibit good low-frequency vibration isolation ability. The vibration isolation effect is uncertain when the excitation frequency is in the chaotic interval of the platform. To improve the vibration isolation performance of the vibration isolation platform in the chaotic interval, this paper proposes a damping increase control method.
1) In order to ensure that the system has good vibration isolation performance when the vibration frequency falls to the chaotic interval, the damping increase control makes the jumping-down frequency less than the external excitation frequency, to avoid the chaotic interval. Thus, the effective vibration isolation range of the platform can be extended.
2) The dynamic response of the platform jumps from the resonant branch with a high amplitude to the non-resonant branch with a small amplitude by the method proposed, which expands the effective vibration isolation interval as well as enhances the low-frequency vibration isolation performance. The validity of this method is proved by the application of the Von der Pol plane, which provides a theoretical basis for the removal time of damping control.
3) The control method of damping increase can further extend the effective isolation range of the platform, a lower isolation frequency can be obtained, to improve the low-frequency vibration isolation effect of the platform.
References
-
Yu Changchun Application of parallel mechanism in multi-DIM vibration absorbers. Applied Mechanics and Materials, Vol. 532, 2014, p. 297-300.
-
Shi Peicheng, Shi Peilei, Nie Gaofa, Tang Ye, Pan Daoyuan, Xiao Ping Research on parameter matching design of new quasi-zero stiffness vibration-isolation platform. Journal of Residuals Science and Technology, Vol. 13, Issue 8, 2016, p. 401-406.
-
Xu Daolin, Yu Qiping, Zhou Jiaxi, Bishop S. R. Theoretical and experimental analyses of nonlinear magnetic vibration isolator with quasi-zero-stiffness characteristic. Journal of Sound and Vibration, Vol. 332, 2013, p. 3377-3389.
-
Robertson William S. P., Cazzolato Ben, Zander Anthony Horizontal stability of quasi-zero stiffness mechanism using inclined linear springs. Acoustics Australia, Vol. 42, Issue 1, 2014, p. 8-13.
-
Zhou Jiaxi, Xu Daolin, Bishop Steven Torsion quasi-zero stiffness vibration isolator. Journal of Sound and Vibration, Vol. 338, 2015, p. 121-133.
-
Sun Xiuting, Jing Xingjian Multi-direction vibration isolation with quasi-zero stiffness by employing geometrical nonlinearity. Mechanical Systems and Signal Processing, Vol. 62, Issue 63, 2015, p. 149-163.
-
Lan Chao Chieh, Sheng Anyang, Wu Yi Syuan Design and experiment of compact quasi-zero-stiffness isolator capable of wide range of loads. Journal of Sound and Vibration, Vol. 333, 2014, p. 4843-4858.
-
Carrella A., Brennan M. J., Waters T. P. Static analysis of passive vibration isolator with quasi-zero-stiffness characteristic. Journal of Sound and Vibration, Vol. 301, 2007, p. 678-689.
-
Carrella A., Brennan M. J., Kovacic I., Waters T. P. On force transmissibility of vibration isolator with quasi-zero-stiffness. Journal of Sound and Vibration, Vol. 322, 2009, p. 707-717.
-
Le Thanh Danh, Ahn Kyoung Kwan Vibration isolation system in low frequency excitation region using negative stiffness structure for vehicle seat. Journal of Sound and Vibration, Vol. 330, 2011, p. 6311-6335.
-
Zhou Jiaxi, Wang Xinlong, Xu Daolin, Bishop Steve Nonlinear dynamic characteristics of quasi-zero stiffness vibration isolator with cam-roller-spring mechanisms. Journal of Sound and Vibration, Vol. 346, 2015, p. 53-69.
-
Xu Jian, Sun Xiuting. Multi-directional vibration isolator based on quasi-zero-stiffness structure and time-delayed active control. International Journal of Mechanical Sciences, Vol. 100, 2015, p. 126-135.
-
Hao Zhifeng, Cao Qingjie Isolation characteristics of archetypal dynamical model with stable-quasi-zero-stiffness. Journal of Sound and Vibration, Vol. 340, 2015, p. 61-79.
-
Shi Peicheng, Shi Peicheng, Nie Gaofa, Tang Ye, Pan Daoyuan Research on displacement transfer characteristics of new vibration-isolating platform based on parallel mechanism. Mathematical Problems in Engineering, Vol. 2017, 2017, p. 8743868.
-
Thayer D., Vagners J. Look at the pole/zero structure of Stewart platform using special coordinate basis. Proceedings of the American Control Conference, Philadelphia, USA, 1998, p. 1165-1169.
-
Ma Guangfu, Liu Yuhan, Sun Yanchao, Ma Jingjing Active vibration isolation for Stewart platformusing backstepping and NFTSM control. Proceedings of the Navigation and Control Conference, Nanjing, China, 2016, p. 1264-1269.
-
Ma L.-Z., Yin X.-Q., Xie J., Yang Q.-Z., Zhu Z. Analysis of combined elastic damping device on multiple DOF parallel mechanism. Chinese Journal of Mechanical Engineering, Vol. 40, Issue 1, 2004, p. 21-24.
-
Yin X., Yang Q., Xie J., Bao P. Vibration analysis of multi-DIM vibration absorber based on parallel mechanism. Proceedings of the 2nd International Conference on Mechanic Automation and Control Engineering, Hohhot, China, 2011, p. 1881-1884.
-
Gatti G., Kovacic I., Brennan M. J. On the response of harmonically excited two degree-of-freedom system consisting of linear and a nonlinear quasi-zero stiffness oscillator. Journal of Sound and Vibration, Vol. 329, Issue 10, 2010, p. 1823-1835.
-
Chiu J.-T., Fang C.-C. Soft computing technologies in design of fuzzy controller for active vibration isolation systems. Journal of Marine Science and Technology (Taiwan), Vol. 24, Issue 3, 2016, p. 519-529.
-
Sun J.-Y., Hua H.-X., Xiao F., Liu X.-T., Andx Huang C. Influence of nonlinear hysteretic damping on force transmissibility of a vibration isolation system. Journal of Vibration and Shock, Vol. 33, Issue 10, 2014, p. 131-136.
-
Carrella A., Brennan M. J., Waters T. P. Optimization of a quasi-zero-stiffness isolator. Journal of Mechanical Science and Technology, Vol. 21, Issue 6, 2007, p. 946-949.
About this article

The authors would like to thank the financial supports of the Natural Science Foundation of Anhui Province (Grant No. 1508085ME70), of the National Natural Science Foundation of China (Grant No. 51575001), of Anhui University Scientific Research Platform Innovation Team Building Projects (2016-2018), and of Young and Middle-Aged Top-Notch Talent Project of Anhui Polytechnic University (2016BJRC010).
Shi Peicheng finished the quasi-zero-stiffness (QZS) vibration isolation platform design and proposed the vibration isolation question in chaotic interval. Shi Peilei finished the physical model and dynamic equation of quasi-zero-stiffness (QZS) vibration isolation platform. Nie Gaofa finished the Amplitude-frequency characteristic and jumping frequency analysis of quasi-zero-stiffness (QZS) vibration isolation platform. Ye Tang finished the paper’s Section 5 by application of Von der Pol Plane. Pan Daoyuan finished the performance of quasi-zero-stiffness (QZS) vibration isolation platform in chaotic interval.
