Abstract
This paper investigates the whole aero-engine coupling vibration, as a rotor tester to be the research object. The rotor tester system is composed of two mountings, stator system, support structures and the rotor system. The modal experiment of the whole tester under the condition of mounting in the test room is carried out. The finite element (FE) model of the rotor tester is built, and the model was modified and validated according to the modal test results. A rotor-stator coupling factor and a section rotor-stator rubbing risk coefficient are proposed, the influence of the support stiffness values on the engine vibration characteristics, such as natural frequencies, modal shapes, rotor-stator coupling degree, and stator-rotor rubbing risk degree at compressor and turbine section is quantitative studied. Results show that the support stiffness contributes to the rigid body modal shapes greatly and to the rotor bending ones slightly. The factor and coefficient defined in this study are both reasonable, and they can reflect the corresponding characteristics exactly. Moreover, the effect of the supports stiffness values on the rotor-stator coupling degree and the rotor-stator rubbing risk degree is nonlinear. The rotor-stator coupling factor and the section stator-rotor rubbing risk coefficient proposed in this study provide a new way to quantitatively research the whole engine coupling vibration.
1. Introduction
Rotor supports structure is an important part of the aero-engine, which is an important factor in structural integrity design and safety evaluation. In recent years, in order to increase the thrust-weight ratio, reduce engine vibration and adjust the critical speed of the system, thin-walled casing and flexible support structures are widely used, which result in some changes in aero-engine dynamic characteristics, such as the stiffness of the support structures is decreased, the influence of the mass distribution of the stator structure on the dynamic characteristics of the whole machine is further increased, and the coupling vibration of the rotor and stator structure is strengthened. So, the bearing stiffness and the mass distribution characteristics must be taken into account in the design of the whole engine system. Reasonable design of the support stiffness is the overall design of the aircraft engine an important goal, which can ensure the good overall vibration characteristics, stator and rotor deformation coordination, radial/axial clearance coordination. It is very important to understand the influence of support stiffness on the vibration characteristics of aero-engine, especially the rotor and stator coupling characteristics.
Although there are lots of researches on the influence of support stiffness on the critical speed, the influence of the support stiffness on rotor-stator coupling vibration characteristics are relatively few. Wang M. et al. [5] studied the vibration characteristics of fan rotor system with flexible support structures. Zapoměl J. et al. [6] reduces the lateral vibration when a rotor-support system through critical speed by adjusting the bearing stiffness. Feng Z. et al. [7] analyzed the effective of the support stiffness to the dynamic characteristics of a dualrotor structure. Deng et al. [8-9] analyzed the influence of support stiffness and axial position on the critical speed of low pressure rotor of a small turbofan engine. Hong [10], Bai [11] studies the effective of the rotor bearing stiffness to critical speed and unbalanced response. Ma Y. et al. [12-14] proposed a series of evaluation parameters for the aero-engine structure efficiency. The aero-engines structure efficiency, such as the non-deformability of stator system and the mechanical environment adaptability of the structure are evaluated by evaluative parameters normalization of the rotor clearance variation, strain energy coefficient, sensitivity coefficient.
The support stiffness has important influence on the coupling vibration of aero-engine. However, the current research works lack the quantitative analysis and evaluation of its influence. In this study, an aero-engine rotor tester is taken as the research object. Considering the coupling effective of the mountings, stator system, supports and rotor system, the finite element model of the tester is established. And the FE model was modified and validated based on the results of the modal test. The rotor-stator coupling factor and the section rotor-stator rubbing risk coefficient are proposed to quantitatively evaluate the rotor-stator coupling degree and the rotor-stator rubbing risk degree in a certain section. The dynamic characteristics of the mounting-stator-bearing-rotor system are studied. The influence of the supporting stiffness values on the dynamic characteristics, the rotor-stator coupling degree and the sections rotor-stator deformation coordination ability are studied.
2. Rotor-bearing-stator tester
The rotor-bearing-stator tester of the aero engine is the research object, which was designed and manufactured by the Shenyang aero-engine research institute. The tester is similar to the core aero-engine of a certain aero-engine, the size is reduced to 1/3 of the original; the internal structure is simplified; the 0-2-0 support structure is used. The shaft is a solid, rigid shaft. The tester is driven by a motor, fixed on the bracket by front and rear mounting structures, which is a typical single-rotor engine system. Fig. 1(a) shows the actual image of the tester; Fig. 1(b) shows its profile.
Fig. 1Aero-engine rotor tester. 1 – compressor rotor, 2 – roller bearing, 3 – compressor stator, 4 – squirrel cage elastic support, 5 – shaft, 6 – turbo rotor, 7 – ball bearing, 8 – turbo stator
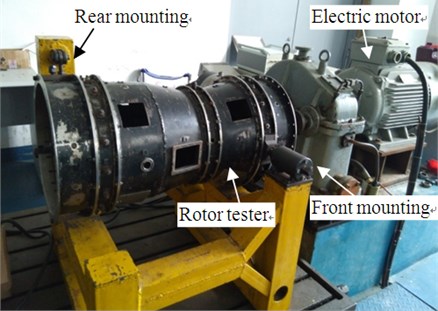
a) The actual aero-engine rotor tester
b) The profile of the rotor tester
3. Finite element modeling and experimental verification of the rotor tester
3.1. Modal test of the whole tester
3.1.1. Test scheme
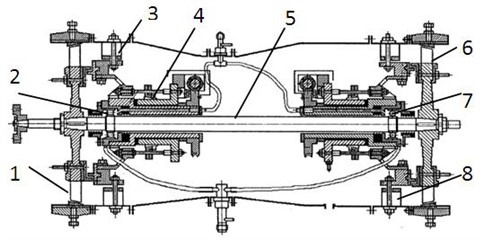
The single-point excitation and multi-point measurement methods are adopted in the experiment. 13 test points are selected on the tester (Fig. 2 shows the positions of the measuring points), 6 of the 13 points are located on the surface of the rotor and the remaining 7 points are located on the surface of the casing. In the test, the accelerations of the test points are measured using B&K4508ICP acceleration sensors. The sine excitation method is adopted in the experiment. Point 1 is the exciting point.
Fig. 2Test points positions schematic diagram of the whole tester modal experiment
3.1.2. Test results and analysis
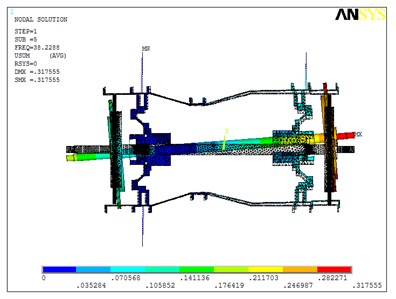
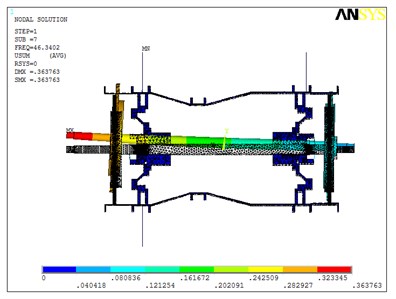
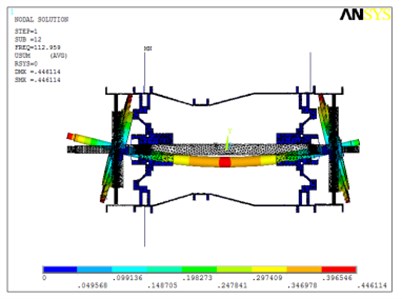
The first three modal parameters of the tester (listed in Table 1.) can be obtained using the vibration modal identification software. The genetic algorithm is used to identify the modal parameters in Table 1. The reciprocal of the difference between the theoretical expression values and the measured values (obtained by the modal test) of frequency response is set to the objective function. The first order natural frequency is 38.2 Hz, and the modal shape of the rotor and stator coupling exhibits a rigid body vibration, wherein both the rotor and stator exhibit pitching behavior. The second order natural frequency is 46.6 Hz, and the modal shape of the rotor exhibits a rigid body movement. The third order natural frequency is 113.3 Hz, and the modal shape of the rotor exhibits bending.
Table 1Experimental modal results
Order | 1st | 2nd | 3rd |
Natural frequency (Hz) | 38.20 | 46.57 | 113.42 |
Damping ratio | 0.0183 | 0.0167 | 0.0134 |
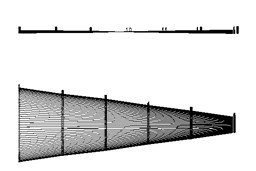
Fig. 3The first three order modal shapes of the rotor tester
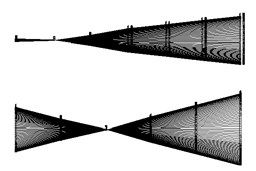
a) The 1st order
b) The 2ndorder
c) The 3rd order
Fig. 3 shows the first, second, and third order modal shapes. The modal shape of the stator is presented on the upper half of Fig. 4, and the lower half of the figure shows the modal shape of the rotor. Clearly, in the first three orders of tester modal shapes of the tester, only the modal shape of the first order shows the coupling vibration of the stator and rotor. In the second and third modal shapes, the vibration in the stator casing is considerably lower than the vibration in the rotor; hence, the coupling degree of the rotor and stator is low.
The stator-casing thickness of the rotor tester is 4 mm, which implies that the stiffness of the stator is high. The phenomenon of coupling vibration of the stator and rotor is not caused by their structures alone. The vibration in the stator in the horizontal direction is due to the mounting method. The rear mounting of the tester is a hanging hinge that lifts the tail of the tester, implying that the rear of the tester is not constrained in the horizontal direction. Hence, the rigid modal shape of the first order stator and rotor coupling is due to the mounting method of the tester.
3.2. Finite element modeling of the tester
The rotor tester is a complex structure comprising observation holes, incentive holes, bolts, keyways, and other small-size structures. These structures have little effect on the dynamic characteristics of the whole tester. However, these structures will increase the scale of the finite element model when meshing the geometrical model, which increases the computation steps. Hence, the structure is simplified for the modeling process, and some small-size structures are neglected. The rotor material is 30CrMnSiA, and the casing material is 1Cr18Ni9Ti. Table 2 lists the material parameters.
Table 2Material parameters of the tester model
Elastic modulus (Pa) | Density (kg/m3) | Poisson’s ratio () |
2.11×10¹¹ | 7800 | 0.3 |
Solid185 is selected to mesh the rotor and stator systems of the rotor tester, and Conbin14 is selected to simulate the bearings of the rotor tester. The stiffness values of the supports of the front and rear bearings are consistent with the true bearing stiffness. The bearings are isotropic in nature. The finite element model is updated based on the experimental results. Table 3 lists the stiffness values of the supports of the model, where and are the front support-stiffness values in the horizontal and vertical directions, respectively. and are the rear support stiffness values in the horizontal and vertical directions, respectively. The tester has designed the elastic support structure in two supporting positions. The , , and in the Table 3 are the series total stiffness of the elastic support structure and the bearing structure. and are the stiffness values of the front mounting in the horizontal and vertical directions, respectively. and are the stiffness values of the rear mounting in the horizontal and vertical directions, respectively.
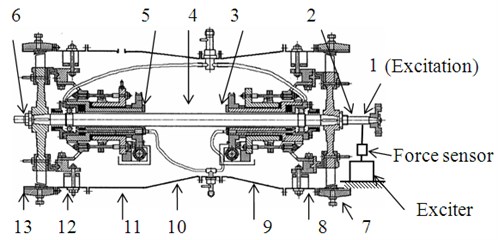
Fig. 4 shows the supports location of the whole tester. Fig. 5 shows the finite element model of the tester.
Fig. 4Location of the supports
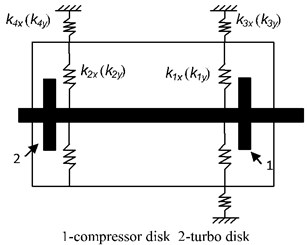
Fig. 5Finite element model of the rotor tester
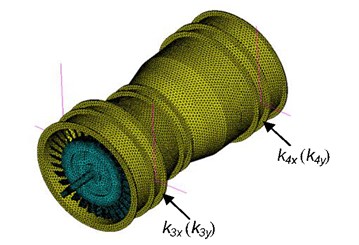
Table 3Support parameters of the rotor tester
Location | ||||
Stiffness/106 (N/m) | 1.1008 | 0.9408 | 1.1208 | 0.464 |
Location | ||||
Stiffness/106 (N/m) | 10 | 10 | 4.1031 | 6.0814 |
3.3. Verification of the finite element model
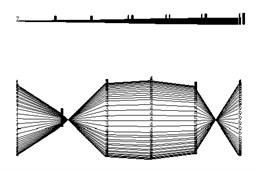
The finite element model is analyzed with the ANSYS software. Fig. 6 shows the first three order modes. Every order modal shape obtained by simulation is similar to the corresponding experimental modal shape.
Fig. 6The first three order modal shapes in the mounting condition in test room
a) The 1st order
b) The 2nd order
c) The 3rd order
The simulation results are compared with the experimental first three order natural frequencies. Table 4 lists the results. In the table, the relative error in the calculation is based on the test results.
Table 4The comparisons between the first three orders natural frequencies of simulation and that of experiment
1st order | 2nd order | 3rd order | |
Experimental results (Hz) | 38.20 | 46.57 | 113.42 |
Simulation results (Hz) | 38.23 | 45.34 | 112.96 |
Relative error (%) | –0.07 | –0.49 | -0.41 |
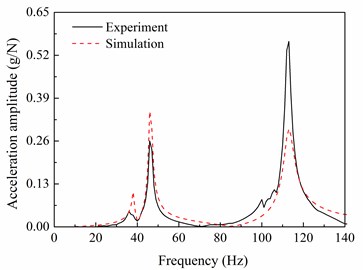
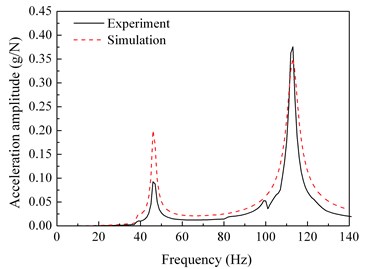
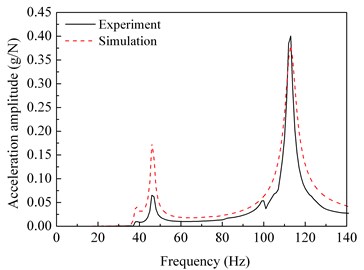
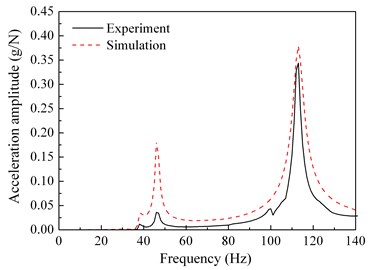
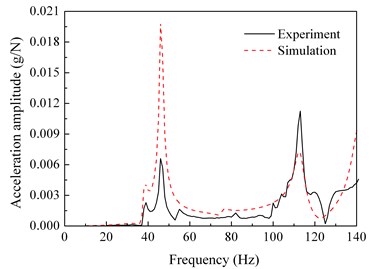
The harmonic response analysis of the simulation model is conducted. The points corresponding to the test points are selected in the finite element model. The acceleration frequency response functions of each selected point are calculated, and compared with the test results. Fig. 7 shows the frequency response curves of the test and the simulation for points 1, 3, 4, 5, 7, and 13, in which points 1, 3, 4, 5 are at the rotor, and points 7 and 13 are at the stator.
Fig. 7Comparisons between the frequency response functions of the experiment and the simulation
a) Test point 1 (rotor)
b) Test point 3 (rotor)
c) Test point 4 (rotor)
d) Test point 5 (rotor)
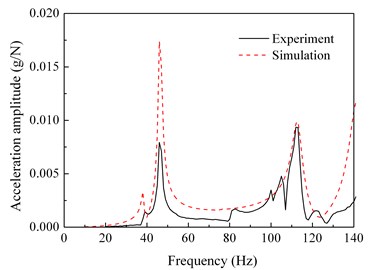
e) Test point 7 (stator)
f) Test point 13 (stator)
It can be seen from Fig. 3 and Fig. 6 that the first three order modal shapes obtained from the simulation and the experiment are similar. The first-order modal shapes both exhibit the rotor and stator coupling vibration, wherein both the rotor and stator exhibit pitching behavior. The second modal shapes of the rotor both exhibit rigid-body vibration. The third order modal shapes of the rotor both exhibit bending.
The Table 4 shows that the first three order natural frequencies of simulation are in good agreement with the experimental results. The maximal relative error between simulation and the test of the first three order natural frequencies is only –0.49 %.
It can be clearly seen form the Fig. 7 that the simulation acceleration-frequency response functions strongly coincide with the experimental ones at the points 1, 3, 4, 5, 7, and 13.
In summary, the finite element model developed in this study can reflect the dynamic characteristics of actual tester. The modeling method is appropriate, and the model is accurate. The model can be used to calculate and predict the characteristics of the real tester.
4. Influence analysis of supports stiffness on natural frequencies and mode shapes
4.1. Influence analysis of support stiffness on natural frequencies
Taking the front support stiffness () as an example, to study the influence of the single support stiffness value on the natural frequencies, the rear support and mountings stiffness values are fixed at their original values, and is changed from 2×10⁵N/m to 1×10⁷N/m, the first three natural frequencies of the rotor tester are calculated under different rear bearing stiffness. Fig. 8 shows the results.
Fig. 8The relationship between the first 3 orders natural frequencies and front support stiffness values
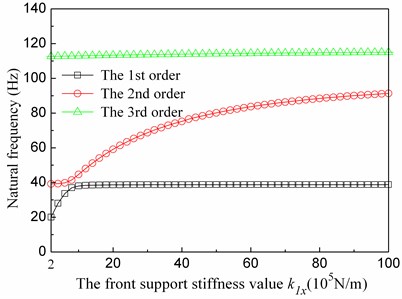
It can be seen from the Fig. 8 that the has a great effective to the first two order rigid modal natural frequencies, and has almost no influence on the third order bending modal natural frequencies. The first-order natural frequency of the tester increases gradually with , and when increases to 1×10⁶N/m, the first-order natural frequency is stable at 38.7 Hz. The second-order natural frequency increases greatly with . With increases, the third-order natural frequency has little changes.
4.2. Influence analysis of the supports stiffness on natural frequencies and mode shapes
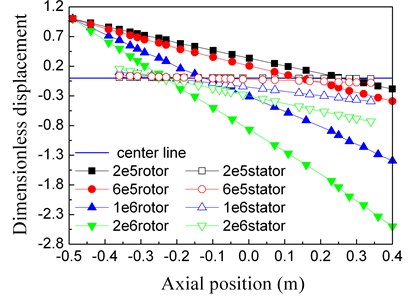
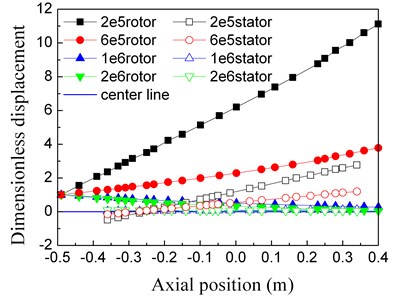
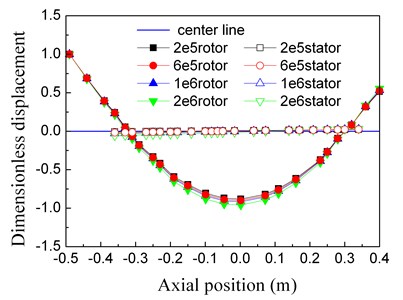
The first three natural frequencies of the tester change with changes, and what about the modal shapes? The first three order modal shapes under different are shown in Fig. 9. In order to compare the different modal shapes, the modal shapes are normalized. In Fig. 9 the first rotor point displacements of each modal shape are set to 1, i.e. all the displacements of each modal shape are divided by the corresponding compressor rotor displacements. And in every modal shape, the left is the compressor and the right is the turbo.
We can read from Fig. 9 that the first two modal shapes change greatly with , and the third ones just has little changes.
(1) In the first-order modal shapes, with increases, the turbo displacements both rotor and stator increase. The rotor pitches intensified, and also the stator. The coupling relationship between rotor and stator is changed. It’s mainly because the compressor vibration is limited with the front support stiffness enhancing, therefore the relative displacement of the turbine increases.
(2) In the second-order mode shapes, with increases, the second-order modal shape of rotor is transformed from pitch to translational motion. The turbo vibration displacements both of rotor and stator are decrease. When is more than 1×10⁶ N/m, the modal shapes are little changes, the rotor vibration turns to translational motion, and also the stator.
(3) The third-order modal shapes changes slightly with the increase of . In the modal shape, the rotor is bending vibration and the stator is almost not move.
In summary, natural frequencies and modal shapes of the rigid mode (the first two mode of the tester) are significant affected by , and the bending mode ones are little. For the rotor rigid mode, the transformation mainly focuses on the supports, so the rigid mode is affected by support stiffness greatly. The transformation of the rotor bending mode mainly focuses on rotor itself, so the bending mode is affected by support stiffness slightly.
Fig. 9The first 3 orders modal shapes in different front support stiffness values
a) The first order
b) The second order
c) The third order
5. Influence analysis of supports stiffness on the rotor-stator coupling vibration
5.1. Rotor-stator coupling factor
In order to quantitatively measure the degree of coupling vibration between the rotor and stator system, a new evaluation index is defined. The rotor-stator coupling factor of the th order mode is defined as:
Among them, and are the maximum absolute values of the whole rotor and stator modal displacements in the th order mode, respectively. The closer the is to 1, the higher rotor-stator coupling degree, when equals to 1, it means the coupling degree is highest.
5.2. Influence analysis of the supports stiffness on the rotor-stator coupling factor
Taking as an example, the rear support and mountings stiffness values are fixed at their original values, and is changed from 2×10⁵N/m to 1×10⁷N/m, the rotor-stator coupling factor of each mode shapes are computed under different values. The first-order mode results are shown in Fig. 10 and Fig. 11.
Fig. 10The relationship between the first modal maximum absolute displacements of the rotor and the stator system and the fore support stiffness values
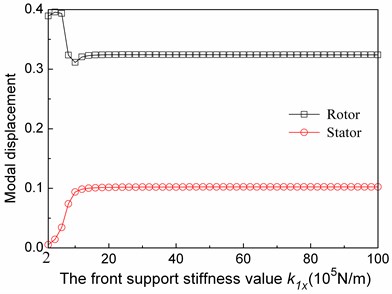
Fig. 11The relationship between the first modal coupling factors and the fore support stiffness values
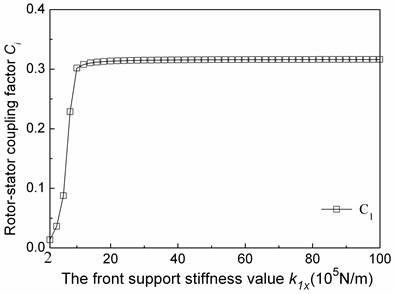
We can read those conclusions from Fig. 10 and Fig. 11:
The first-order rotor-stator coupling factor () first increases and then stabilizes, with . When is less than 1×10⁶ N/m, the maximum absolute rotor displacements reduce and the stator one’s increase, the rotor-stator coupling degree increases, the factor increases. It’s mainly because that the first-order mode shapes mainly includes rotor pitches and stator pitches, stator structure and rotor structure in-phase pitch, with the increases the stator and rotor pitch degree increase, so increases.
Under different supports stiffness, the degree of rotor-stator coupling of the first order mode of the tester changes to some extent. The influence of support stiffness on the degree of rotor-stator coupling is non-linear, and only affects in a certain range.
6. Influence analysis of supports stiffness on cross-section rubbing risk between rotor and stator
The stiffness values of the supports have a certain influence on vibration mode. The modal shapes change under different supports stiffness values. It can be seen that for the first two rotor rigid modes, there is blade-casing rubbing risk in the compressor section and turbo section, so the concordance of mode shapes between rotor and stator in the section of compressor and turbine become very important, especially when the engine go through the critical speed.
6.1. The section rubbing risk coefficient between rotor and stator
In order to study the coordination problem of cross-section vibration modal shape between rotor and stator, and do quantitative comparison of the rubbing risk of cross-section, the coefficient of cross-section rub-impact risk between rotor and stator at the section under the th order mode is defined as:
where and are the rotor and stator modal displacements at section of the th order modal shapes, respectively; is the maximum absolute value of ; is the maximum absolute value of .
Eq. (2) can be used to compare the risk level of blade-casing rub-impact in different conditions, including different sections, different stiffness values in the same section, and so on. When we design a structure, maybe we have several plans, we can calculate the sections rotor-stator rubbing risk coefficients of different projects, which can give some help to compare the plans in the rub-impact characteristics.
6.2. Influence analysis of the supports stiffness on the section rubbing risk coefficient
Taking the first-order vibration mode as an example, the influence of on the first-order mode rotor-stator rubbing risks at the compressor and turbo are studied. Fig. 12 shows the rotor and stator modal displacements at the compressor and turbo sections, which clearly describes each sections displacements variation with . Fig. 13 shows and under different , in which and are the compressor and turbine section rubbing risk coefficients in the first-order mode, respectively.
Fig. 12The relationship between the first modal absolute displacements of the rotor and the stator system in compressor section and turbo section and the fore support stiffness values
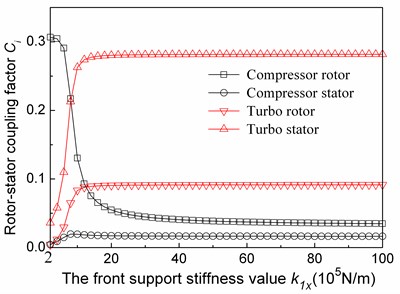
Fig. 13The relationship between the first modal rotor-stator rubbing risk coefficient of compressor and turbo sections and the fore support stiffness values
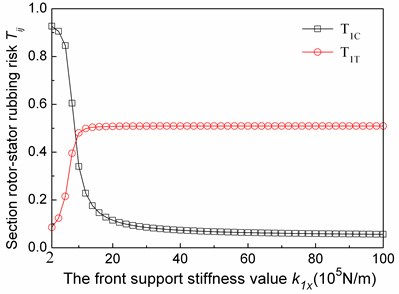
We can read those conclusions from Fig. 12 and Fig. 13:
(1) In the first-order vibration mode, first decreases and then stabilizes, with increases. When is less than 2×10⁶ N/m, the rotor displacements at the compressor section reduce and the stator displacements slightly increase, so the rubbing risk at this section is less, reduces. When is more than 2×10⁶N/m, the rotor and stator displacements at compressor section tends to be stable, so also also tends to be stable.
(2) In the first-order vibration mode, first increases and then stabilizes, with increases. When is less than 1.4×10⁶N/m, the rotor and stator displacements at the turbine section increase, but the stator displacement increases less than the rotor displacement increases. The rubbing risk between rotor and stator at the section increases, increases. When is more than 1×10⁶ N/m, the rotor and stator displacements at compressor section tends to be stable, so also also tends to be stable.
(3) In the first-order vibration mode, when is less than 1×10⁶ N/m, the compressor section has a higher rubbing risk than the turbine section.
The change of the supports stiffness causes the change of the modal shapes, which causes the change of the relative position of the rotor and the stator, so that the clearance characteristics of rotor and stator in cross-section will be changed, which can change the rubbing risk between rotor and stator. The influence of the supports stiffness on the clearance characteristics of rotor and stator in cross-section is non-linear, which will tend to be stable with the increase of the supports stiffness. Through analysis, it can be seen that the section rubbing risk coefficient proposed in this study can quantitatively reflect the risk of rub-impact between rotor and stator, the changes trend of the coefficient can reflect the risk changes of cross-section rub-impact.
7. Conclusions
In this study, a finite element model of an aero-engine rotor tester with casing is established, and the model was modified and verified by a modal test. The rotor-stator coupling factor and section rubbing risk coefficient are proposed, which can be used to quantitatively evaluate the coupling degree of rotor and stator and the blade-casing rubbing risk at sections. The influences of the supports stiffness on the natural frequencies and the mode shapes of the first three order modes are analyzed. And the influence of the supports stiffness on the rotor-stator coupling factor and section rubbing risk coefficient in the first-order mode are analyzed, too. The conclusions are as follows:
1) In this study, the first three natural frequencies and mode shapes of the finite element model of aero-engine are consistent with the whole engine modal test. The frequency responses of the rotor and the casing points are in good agreement with the experimental results. The finite element model of the whole aero-engine can truly reflect the dynamic characteristics of the tester.
2) The changes of support stiffness will lead to the changes of the natural frequencies and the modal shapes, and the supports stiffness has great influence on the natural frequency and modal shapes of the rigid body modes, and little influence on the ones of the bending modes
3) The influence of the support stiffness on the coupling degree of rotor and stator is non-linear and only has a great influence in a certain range. When the support stiffness exceeds the certain range, the coupling degree of rotor and stator does not change with the change of support stiffness. The change of supports stiffness will cause the change of the rubbing risk of sections. The influence of the supports stiffness on the risk of the section rubbing risk coefficient is non-linear and only affects in a certain range.
4) The factor and the coefficient proposed in this study are reasonable, they can reflect the corresponding characteristics, their changes trend can reflect corresponding characteristics changes. They will provide a new method to quantitatively evaluate the rotor-stator coupling vibration characteristics and could help to compare the vibration characteristics of the different structures.
References
-
Aero-engine Design Manual Committee. Aero-Engine Design Manual 19th Part: Rotor Dynamics and Whole-Engine Vibration. Aviation Industry Press, Beijing, 2000, (in Chinese).
-
Li Qihan, Wang Yanrong The Design Problem of Aero-Engine Structure Strength. Shanghai Jiao Tong University Press, 2014, (in Chinese).
-
Huang J., Zheng L., Mei Q. Design and optimization method of a two-disk rotor system. International Journal of Turbo and Jet-Engines, Vol. 33, Issue 1, 2015, p. 1-8.
-
Gnanasundaram G. Gtindia2015-1247 shape optimization of flexible supports for aero engines. ASME Gas Turbine India Conference, 2015.
-
Wang M., Han Q., Wen B., et al. Modal characteristics and unbalance responses of fan rotor system with flexible support structures in aero-engine. Proceedings of the Institution of Mechanical Engineers, Part G Journal of Aerospace Engineering, 2016.
-
Zapoměl J., Ferfecki P. A computational investigation on the reducing lateral vibration of rotors with rolling-element bearings passing through critical speeds by means of tuning the stiffness of the system supports. Mechanism and Machine Theory, 2011, Vol. 46, 5, p. 707-724.
-
Feng Z., Luo G. Analysis on the dynamic characteristics of the dualrotor structures of a certain aero-engine. Vibroengineering Procedia, Vol. 5, 2015, p. 469‑474.
-
Nie Weijian, Deng Wangqun, Xu Youliang, et al. Analysis on the changes of high-speed flexible rotor critical speeds with supporting stiffness and disk mass. Gas Turbine Experiment and Research, Vol. 3, 2015, p. 19-24, (in Chinese).
-
Deng Wangqun, Wang Yi, Nie Weijian, et al. Influence of supporting stiffness and axial location on critical speeds of a low-pressure rotor of a counter rotating engine. Aeroengine, Vol. 42, Issue 3, 2016, p. 7-11, (in Chinese).
-
Hong Jie, Wang Hua Xiao Dawei, et al. Effects of dynamic stiffness of rotor bearing on rotor dynamic characteristics. Aeroengine, Vol. 34, Issue 1, 2008, p. 23-27, (in Chinese).
-
Bai Zhongxiang, Wu Weiliang, Liu Hongzhao The effect of the stiffness of a rotor’s supporting system on its dynamic characteristics. Machine Design and Research, Vol. 28, Issue 4, 2012, p. 18-21, (in Chinese).
-
Ma Yanhong, Cao Chong, Li Xing, et al. Assessment method of structural efficiency on bearing system in aero-engine. Journal of Aerospace Power, Vol. 31, Issue 2, 2016, p. 274-281.
-
Xu Feng, Ma Yanhong, Zhang Li, et al. Non-deformability evaluation of aero-engine’s case. Journal of Aerospace Power, Vol. 31, Issue 8, 2016, p. 1921-1928.
-
Yu Pingchao, Ma Yanhong, Wang Cun, et al. Evaluation parameters and calculation methods of structural efficiency for whole aero-engine. Journal of Aerospace Power, Vol. 31, Issue 7, 2016, p. 1744-1753.
-
Zhao W. T. Research on the Whole Engine Vibration Modeling and Validation of Aero-engine considering the Dynamic Stiffness of the Tested Casing Bearing. Nanjing University of Aeronautics and Astronautics, 2012, (in Chinese).
About this article

We would like to thank the engineer G. Q. Feng of the Shenyang Aero-engine Institute for his valuable suggestions. In addition, we would like to thank the graduate students H. F. Wang, P. P. Song, B. B. Liu and W. G. Yu for their help in conducting the modal experiments. This work is supported by the National Natural Science Foundation of China (Grant No. 51675263), Funding of Jiangsu Innovation Program for Graduate Education (Grant No. KYLX16_0387) and Funding for Outstanding Doctoral Dissertation in NUAA (Grant No. BCXJ17-10).
