Abstract
Reported researches rarely focus on dynamic stress concentration factors (SCF) of tubular joints between the chord and brace, where the chord is a square pipe, and the brace is a circular pipe. Tubular joints between a square pipe and circular pipe are widely applied in spatial structures as a support structure. Therefore, tubular joints of welded steel pipes under axial loads were studied numerically for determination of dynamic stress concentration factors (SCF). Finite element models were setup for a total of 165 tubular joints with various configurations, obtaining dynamic stress distributions of each model along the joint. Dynamic stress concentration factors on the brace and the chord were extracted respectively. Relations between sizes of dynamic stress concentration factors between the joint and structural parameters were discussed. The computational model was finally validated by the experimental test. The experimental curve was basically consistent with the finite element at the elastic stage of loading, indicating that the computational model at the elastic stage was very accurate. The paper mainly studied dynamic stress distribution of the tubular joint of welded steel pipes under an excitation load at the elastic stage, so the finite element model could be used to replace experimental test. SCF was 180° symmetric under different parameters. This angle was located at the crown point of tubular joints, while the welded steel pipe structure was a symmetric structure relative to the longitudinal plane. In addition, the chord and brace had SCF peaks at the angles of 90° and 270° because the two points were located at the saddle point of the tubular joints. Under angles of 0° and 180°, the SCF had obvious valley values because the two points were located at crown points of tubular joints. Finally, the vibration performance of the tubular joint was also analyzed. Vibration displacement could be reduced obviously through reinforcement of tubular joints with the collar plates. Axial pre-tensile forces would increase vibration displacement on top and bottom positions of the chord pipe. This paper can provide an important reference for the improvement of the dynamic stress concentration of joints of welded steel pipes.
1. Introduction
Joint structures of welded steel pipes are a special form. A welded steel pipe structure is generally composed of welding between a chord with a large diameter and brace with a small diameter. In the pipe joint structure, the chord is straight and through; the brace is connected to the surface of the chord through welds; the joint is generally called as the tubular joint [1-3]. The welded steel pipe structure is advantageous in that: steel pipes are light, have higher strength, plasticity and toughness than other concrete structures and wood structures, and can be built into large-span spatial structures; as for forces, the steel pipe structure has a symmetric and sealed cross section, so it has high bending and torsion resistance; steel pipes can be processed easily, and are featured with concise shapes, recycling, and environment-friendly characteristics; besides being made into structures such as precast slab beams, steel pipe structures can also be directly transported to construction fields for construction, so the construction is simplified greatly. Because of the series of advantages, the welded steel pipe joint structure is applied more and more widely in large bridges, ocean platforms and large-span spatial structures during recent years [4-8].
In a traditional steel tube truss structure, the chord and brace are generally designed to have the same type of cross sections, namely both of them are circular pipes or square pipes. Scholars have made a lot of researches on force characteristics of joints with various forms, and obtained a relatively systematic computation method [9-14]. In order to obtain a computational formula of axial rigidity of a Y-shaped round steel tube joint, Zhao [15] established a semicircular arch model based on an annular model and relations between joint deformation and axial rigidity, and derived a theoretical formula for axial rigidity of the joint. In order to obtain a computational formula of forces of T and Y joints, Wang [16] conducted parameterized analysis of 528 joints, where reliability of the proposed formula was verified by applicability checking results. Yang [17] applied the finite element method to compare multiple groups of welding joints with different geometric characteristics, and studied impacts of main parameters of spatial joints on the joint force. In order to investigate force performance of welded steel pipe joints, Jiao [18] conducted finite element analysis on pipe joints. Through experimental researches on extreme forces of the X joint under axial pressure, in-planar bending moment, and out-planar bending moment, Huang [19] analyzed stress development process and displacement changes during joint loading. Aiming at the circular steel pipe joints in actual engineering, Shu [20] established a finite element model of joints based on ANSYS and studied stress and damage of welding joints. Acevedo [21] has investigated the influence of welding tensile residual stresses on fatigue crack growth in bridge tubular K-joints through experimental testing of large-scale specimens. Lesani [22] presented the failure pattern, ultimate static strength and detailed behavior of steel tubular T-joints strengthened by fiber reinforced polymer (FRP) obtained from numerical investigations under an axial brace compressive loading.
Researches rarely focus on dynamic stress concentration factors (SCF) of joints between the chord and brace, where the chord is a square pipe, and the brace is a circular pipe. Tubular joints between a square pipe and circular pipe are widely applied in spatial structures as a support structure. In these structures, the brace is generally welded on the surface of the chord directly. At the welded joints, dynamic stress distribution is very complicated, and obvious stress concentration phenomena are here and seriously affect fatigue life of the joints. Therefore, it is very necessary to analyze dynamic stress concentration factors of tubular joints. Tong [23] has studied stress concentration factors of tubular joints of welded steel pipes, but he did not analyze impacts of those structural parameters on dynamic stress concentration factors completely and the computational model was not validated by experimental test. Dynamic stress distribution at the tubular joint between a square pipe and circular pipe is very complicated, so it is difficult to conduct accurate analysis with theoretical models. Experimental research is the most direct and reliable method, but the experimental method needs a lot of time and effort. With in-depth development of the finite element method, the research on dynamic stress concentration factors of tubular joints between a square pipe and circular pipe under forces based on the finite element method becomes the main method, and plays an important role in guiding design of fatigue performance of tubular joints. Therefore, based on accurate simulation of the tubular joint between a square pipe and circular pipe, the paper applied the finite element software ABAQUS to conduct a systematic analysis on 165 groups of joint models, obtaining dynamic stress distributions of each model along the joint. Dynamic stress concentration factors on the brace and the chord were extracted respectively. Relations between sizes of dynamic stress concentration factors of the tubular joint and structural parameters were discussed. Finally, the vibration performance of the tubular joint was also analyzed.
2. Description of the typical tubular joint model
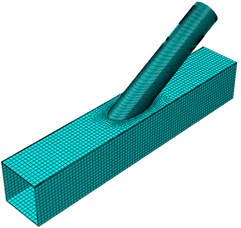
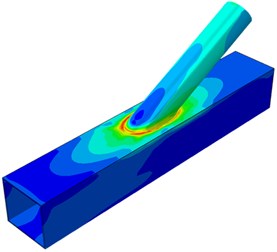
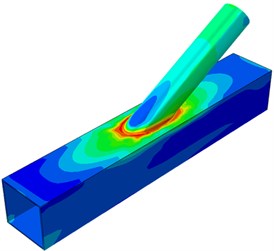
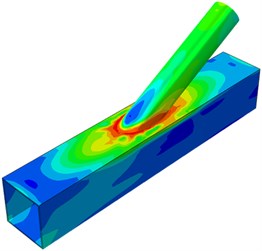
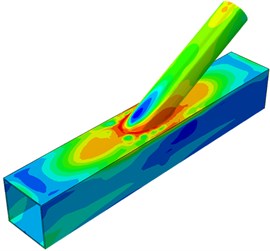
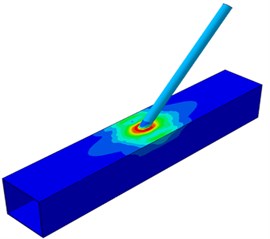
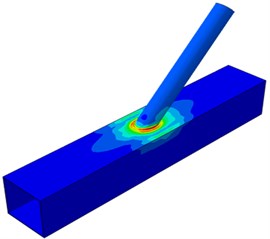
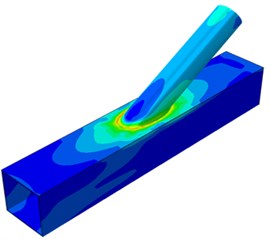
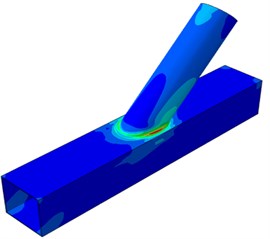
A typical model of joints of welded steel pipes is shown in Fig. 1. The brace with a circular pipe is welded on a square hollow steel pipe. Performance of the steel pipe joint is generally described by dimensionless parameters , , , and . Definition of each parameter is shown in Fig. 1. is length-width ratio, is width ratio, is width-thickness ratio, is thickness ratio, is inclination angle. In actual engineering structures, these parameters should be defined within a certain scope in general: 0.2 0.8, 6 20, 0.2 0.8, 30° 90°, 6 24. Therein, when is smaller than 12, performance of joints could be affected obviously in general. The finite element software ABAQUS was used to conduct systematic analysis on 165 groups of joint models, obtaining stress distributions of each model along the welding joint. Stress concentration factors on the brace and chord were extracted respectively. Relations between sizes of stress concentration factors and each parameter were discussed. In order to present model characteristics under different parameters, four models with different inclination angles were extracted, as shown in Fig. 2.
Fig. 1Parameters of welded joints of the steel pipe
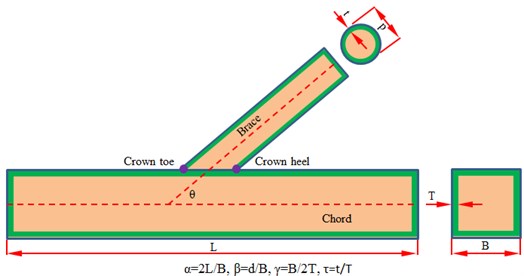
Fig. 2Welded steel pipe models with different inclination angles
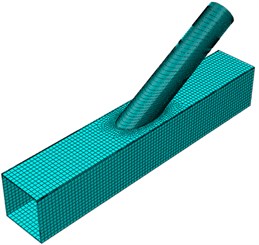
a) 30°
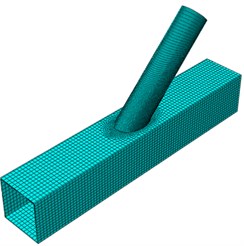
b)45°
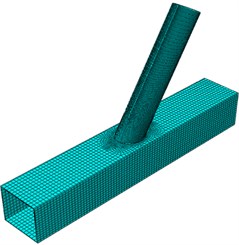
c) 60°
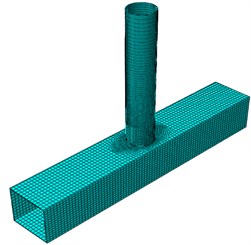
d) 90°
3. Finite element model of tubular joints and experimental verification
3.1. Finite element model of tubular joints
In fact, a tubular joint is formed through welding between a square pipe and circular pipe, where the tubular line between the brace and chord is a complicated three-dimensional curve. In previous researches, impacts of sizes of welds on stress concentration factors were neglected, so the finite element analysis results were very different from actual joints or experimental results. At present, there are three kinds of methods for tubular joint modeling of steel pipes: (1) both the welded joint and steel pipe adopt shell elements; (2) both the welded joint and steel pipe adopt solid elements; (3) welded joint adopts solid elements, and steel pipes adopt shell elements. In general, both the welded joint and the steel pipe adopt solid elements, which is also more similar to actual situations. In order to overcome defects in simulating welded joints, based on researches, a method of three-dimensional secondary solid elements was proposed to simulate welded joints. In the research, the three-dimensional solid elements of C3D20R were used to simulate the tubular joint between a square pipe and circular pipe.
Fig. 3Finite element model of tubular joints of welded steel pipes
a) Complete model
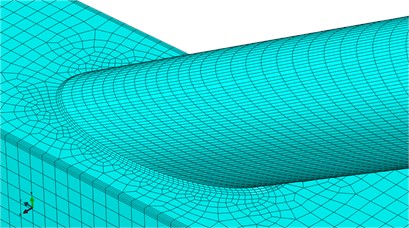
b) Joint model
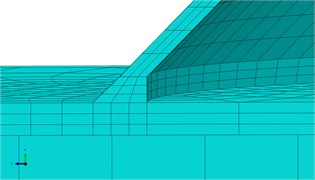
c) Crown toe
d) Crown heel
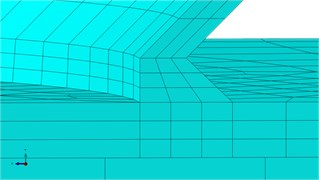
To a great extent, accuracy of numerical results depends on quality and quantity of elements in the applied finite element mesh. Therefore, the tubular joint is divided into different regions. Mesh division is conducted on each region separately. Stress concentration is located at the welded joint and the stress concentration is very serious in the region, so mesh division at the welded joint should be finer and elements with higher quality are required. In regions far from the welded joints, impacts on stress concentration of the joint are slight, so rough meshes could be adopted for these regions and thus computational time can be reduced. After comparative analysis on values obtained by the finite element method, if the region along the pipe wall thickness direction is divided into 2 layers, the software running speed would be high, but only rough values could be obtained; if the region is divided into 4 layers along the pipe wall thickness direction, accurate values will be obtained, but the computational speed would be very low. Based on comprehensive consideration, the region was divided into 3 layers during joint simulation, so computational time could be saved, and accurate values could be obtained. During simulation of the steel pipe with ABAQUS, the Q235 steel material was selected, namely the material with Young modulus is 206 GPa and Poisson’s ratio is 0.33. In order to simplify the finite element model, the welded joint was deemed to have similar properties of the steel pipe material. Therefore, during simulating welded joints in the finite element, setting of the welded joint material was also determined according to material parameters of Q235 steel material. Finally, the finite element model of the tubular joint of welded steel pipe was obtained, as shown in Fig. 3.
In the finite element model, boundary constraints were applied on joints of elements. According to the characteristic that each joint of the element had 6 degrees of freedom, constraints of 6 directions were applied on edge joints located on two ends of the chord in order to simulate a fixed support of the computation model. A rigid joint was established at the center of the brace. The joint was used to control forces on the end face of the brace. Forces borne by the brace was applied on the joint. Dynamically axial tensile forces were applied on one section of the brace. The force changes within 0 kN-450 kN.
3.2. Experimental verification of the finite element model of dynamic stress
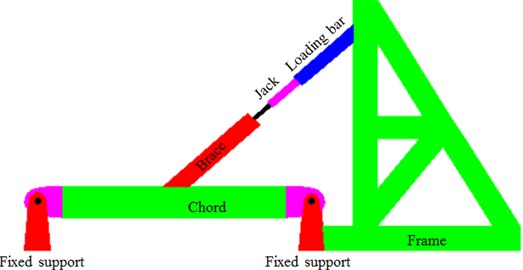
The dynamic stress computation model of the tubular joint of welded steel pipes is very complicated, so it is necessary to verify the correctness by experimental test. Fig. 4 shows a dynamic experimental loading process of the welded steel pipe, where a strain gage was arranged at the tubular joint and loading of the brace was achieved by a jack and a loading rod. The loading device was installed on a counter force frame. Ground beams were set on two sides of pillar legs of the counter force frame and connected to lab ground grooves by ground anchors. In order to ensure that the frame pillar legs would not be moved during the experiment, the top beams were set on outer sides of the two pillar legs, and the top beams were tensioned by 4 high-strength steel pull rods. Two ends of the chord were constrained by fixed supporting, so boundary conditions could be consistent with those in the numerical simulation. The strain gage was connected to a data collection instrument and then the data was transmitted to a computer for processing. Finally, experimental results were compared with numerical simulation results, as shown in Fig. 5.
Fig. 4Dynamic experiment loading process of welded steel pipes
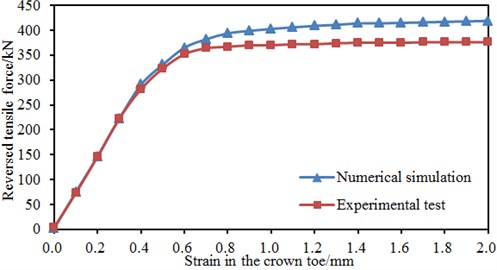
It is shown in Fig. 5 that the experimental curve was basically consistent with the finite element at the elastic stage of loading, indicating that the simulation at the elastic stage was very accurate; after the elastic-plastic stage was presented, the finite element values were obvious larger than experimental values. The error was mainly caused by the following reasons: 1) constitutive relations of the steel material adopted during finite element analysis were different from actual situations to a certain extent; 2) the finite element simulation did not consider manufacture errors of experimental specimens, as well as impacts of residual stress generated by cutting and welding. Some errors were between the finite element and experimental test due to different reasons, but the trends of two curves were roughly consistent, and the simulation was ideal at the initial elastic stage of curve. The paper mainly studied dynamic stress distribution of the tubular joint of welded steel pipes under an excitation load at the elastic stage, so the finite element model could be used to replace experimental test. In this way, the computational time could be increased effectively, and studied cost could be reduced.
Fig. 5Comparison between experimental test and numerical simulation results
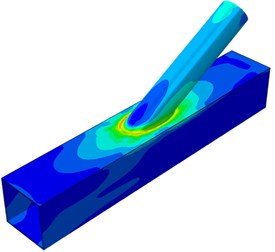
The dynamic stress distribution contours of the welded steel pipe during dynamic loading were extracted, as shown in Fig. 6. It is shown in Fig. 5 that when the applied load reached 300 kN, the welded steel pipe started entering the plastic stage. In Fig. 6(a) and Fig. 6(b), the applied loads were 100 kN and 200 kN respectively. The tubular joint stayed at an elastic state. Stress concentration of a small scope was near the tubular line of the pulled brace. When the applied load reached 300 kN, some elements at the brace root entered a plastic stage and tended to be expanded upwards, where the phenomenon was obvious on the pulled brace. When the applied load reached 350 kN, the plasticity scope at the brace root was expanded. However, at this moment, loading could be continued as the deformation was not obvious. When the applied load kept on increasing to 400 kN, the plastic region at the brace root kept on expanding, while the plastic region of the chord also expanded around. When the applied load reached 410 kN, due to obvious strain on the chord surface and the brace root, the plastic stage reached the extreme point. At this moment, serious crack would appear at the tubular joint region. Loading could not be continued.
Fig. 6Contours of stress distribution of welded steel pipes during dynamic loading
a) 100 kN
b) 200 kN
c) 300 kN
d) 350 kN
e) 400 kN
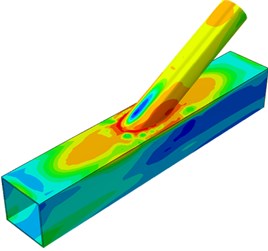
b) 410 kN
4. Impacts of parameters on circumferential dynamic stress of tubular joints
The paper only studied characteristics of dynamic stress distribution at the elastic stage. Therefore, a numerical simulation model could replace experimental technologies to analyze impacts of different parameters on dynamic stress concentration factors (SCF) of the tubular joint of the welded steel pipe. Models under all the parameters were established on an original model. Parameters of the original model: 12, 0.6, 10, 0.4, 30°. Dynamic stress distribution of the model is shown in Fig. 7. It is shown in Fig. 7 that positions with large dynamic stress at the tubular joint were mainly distributed at the crown and saddle points. Similarly, sizes of crown points and saddle points were similar at the tubular joint. The welded steel pipe was symmetric relative to the longitudinal plane. Therefore, its dynamic stress distribution was symmetrical in Fig. 7(b). Dynamic stress was distributed uniformly on the brace.
Fig. 7Dynamic stress distribution of tubular joints of welded steel pipes
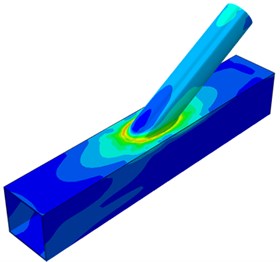
a) Complete model
b) Horizontal section
c) Crown toe
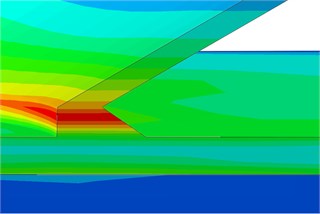
d) Crown heel
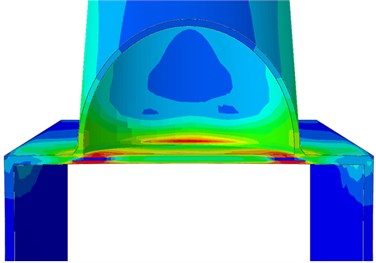
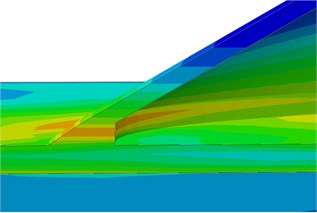
The paper mainly studied impacts of five parameters including , , , and on dynamic stress distribution of the tubular joint. Due to the limited article length, only dynamic stress distribution contours under two parameters and were extracted, as shown in Fig. 8 and Fig. 9. The two parameters would generate obvious impacts on the shape of welded steel pipes, so they have obvious representativeness. It is shown in Fig. 8 that in the model, the joint had obvious stress concentration in crown and saddle point regions located at the tubular connection part, and dynamic stress on the brace was small. Dynamic stress concentration was most serious at the saddle point of the tubular joint, indicating that that peak stress was located at the saddle point. In other words, when axial tensile force was borne, the welded steel pipe would firstly generate a fatigue crack trend at the saddle point. In addition, with the increased inclination angle, the dynamic stress concentration phenomenon became more and more serious at the saddle point, while dynamic stress concentration at the crown point did not change obviously. Dynamic stress distribution regions of the chord of the welded steel pipe with 30° inclination angle were obviously larger than that with other inclination angles. In addition, dynamic stress distribution on the brace was obviously deteriorated compared with other angles. Dynamic stress distribution regions of the chord and brace with the inclination angle of 30° were large, but dynamic stress concentration was not very obvious at the crown and saddle points.
Fig. 8Model of welded steel pipes with different inclination angles θ

a)30°
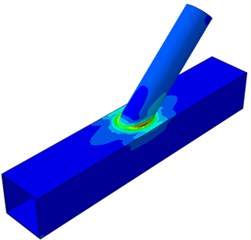
b)45°
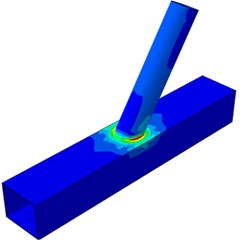
c)60°
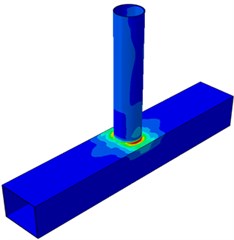
d)90°
Fig. 9Model of welded steel pipes with different width ratios β
a)0.2
b)0.4
c)0.6
d)0.8
Under the angle, the possibility in damage of the tubular joint was lowest. Under a small inclination angle, tensile force on the brace would generate horizontal separation in the chord direction, so large dynamic stress distribution regions would appear on the chord; tensile force on the brace would generate small component force in the vertical direction. With the increased inclination angle, the vertical component force gradually increased. Therefore, serious dynamic stress concentration was generated at the tubular joint. Fig. 9 shows dynamic stress distribution of the welded steel pipe under different width ratios. It is shown in the figure that with the increased width ratio, the dynamic stress concentration of tubular joints became increasingly weaker. Due to the increased width ratio, namely the increase of the brace diameter, the connection region between the brace and chord would increase and the connection stiffness of the tubular joint would increase.
4.1. Impacts of width ratio on dynamic stress of tubular joints
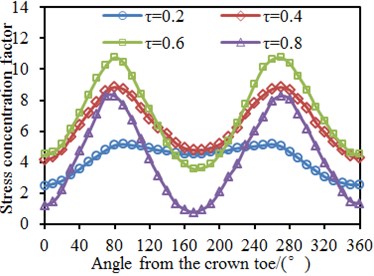
The tubular joint between a square pipe and circular pipe bore tension loads. SCF of the brace presented different changing rules under different geometric parameters. Parameters 15, 0.4, 30° and 6 were kept unchanged. The width ratio was changed within the scope of 0.2-0.8, with the step length of 0.2. Circumferential SCF of the chord and brace at the tubular joint under different width ratios was computed, as shown in Fig. 10. It is shown in the figure that the SCF was 180° symmetric under different width ratios. This angle was located at the crown point of tubular joints, while the welded steel pipe structure was a symmetric structure relative to the longitudinal plane. In addition, the chord and brace had SCF peaks at the angles of 90° and 270° because the two points were located at the saddle point of the tubular joints. It is shown in the stress distribution contour that the stress was the maximum. Under angles of 0° and 180°, the SCF had obvious valley values because the two points were located at crown points of tubular joints. In addition, the SCF on the brace gradually decreased with the increased width ratio. However, when was 0.2 and 0.4, the SCF did not change very obviously. When increased from 0.4 to 0.6, the SCF showed obvious changes. However, the SCF of the chord did not decrease with the increased all the time. Under 0.2-0.6, the SCF curve had an obvious valley value at the angle of 180°. When 0.8, SCF curves of the chord and brace were smooth and did not show obvious valley values or peak values.
Fig. 10SCF of tubular joints with different width ratios β
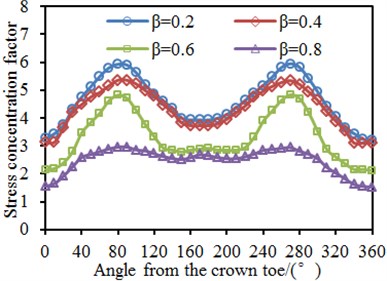
a) Brace
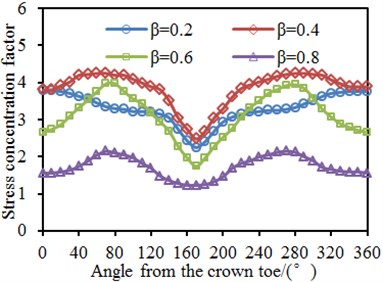
b) Chord
4.2. Impacts of width-thickness ratio γ on dynamic stress of tubular joints
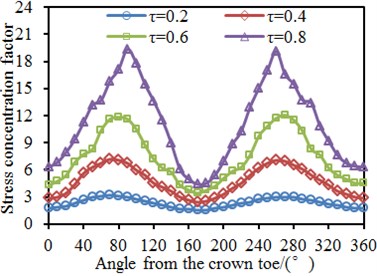
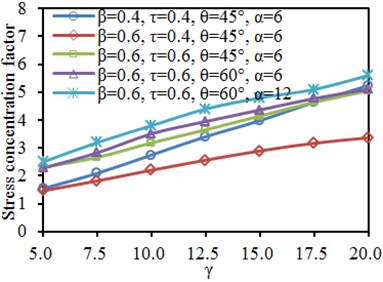
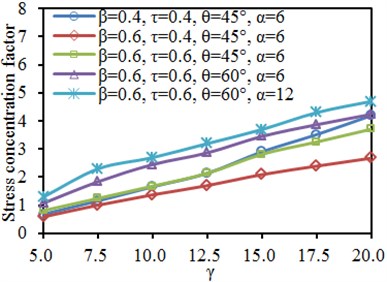
0.6, 0.4, 30° and 6 were kept unchanged. The width-thickness ratio was changed from 5 to 20 with the step length of 5. Circumferential SCFs of the chord and brace at the tubular joint under different width-thickness ratios were computed, as shown in Fig. 11. It is shown in the figure that the SCF was 180° symmetric under different width-thickness ratios. This angle was located at the crown point of tubular joints, while the welded steel pipe structure was a symmetric structure relative to the longitudinal plane. In addition, the chord and brace had SCF peaks at the angles of 90° and 270° because the two points were located at the saddle point of the tubular joint. It is shown in the stress distribution contour that the stress was the maximum. Under angles of 0° and 180°, the SCF had obvious valley values because the two points were located at crown points of the tubular joint. In addition, the SCF on the chord and brace gradually increased with the increased . Increase of would cause decrease of the chord thickness, so rigidity of the chord could be reduced; connection rigidity at the tubular joint would be weakened; and stress concentration would be more obvious. When was large, the SCF curves of both the chord and brace had obvious valley values and peak values. However, when was small, the SCF curves were relatively smooth.
Fig. 11SCF of tubular joints with different width-thickness ratios γ
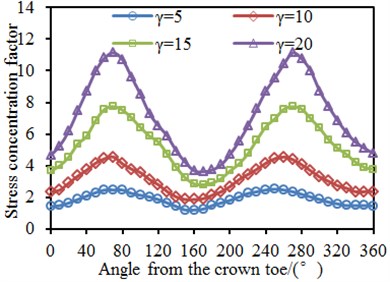
a) Brace
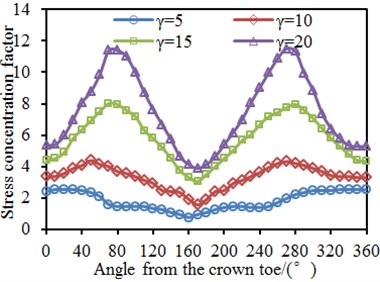
b) Chord
4.3. Impacts of thickness ratio on dynamic stress of tubular joints
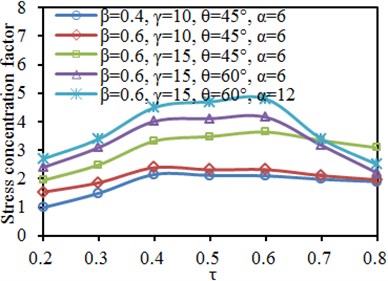
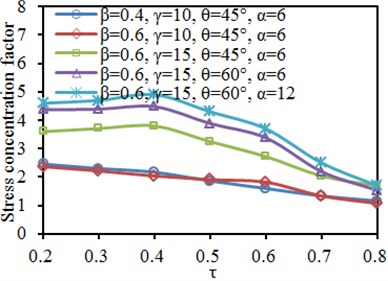
0.6, 15, 30° and 6 were kept unchanged. The thickness ratio was changed from 0.2 to 0.8 with the step length of 0.2. Circumferential SCFs of the chord and brace at the tubular joint under different thickness ratios were computed, as shown in Fig. 12. It is shown in the figure that the SCF was 180° symmetric under different thickness ratios. This angle was located at the crown point of tubular joints, while the welded steel pipe structure was a symmetric structure relative to the longitudinal plane. In addition, the chord and brace had SCF peaks at the angles of 90° and 270° because the two points were located at the saddle point of the tubular joint, and it is shown in the stress distribution contour that the stress was the maximum. Under angles of 0° and 180°, the SCF had obvious valley values because the two points were located at crown points of the tubular joint. The SCF of the chord gradually increased with the increased . Increase of would increase the thickness of the brace, so connection rigidity of the tubular joint could be improved. However, the SCF of the brace did not increase gradually with the increased all the time. When 0.8, the SCF of the brace showed different changing trends, which might be caused by special tubular joint positions. Only when 0.2, the SCF curve was relatively smooth. The thickness of the brace was small, but the thickness of the chord was unchanged. The axial load in the brace transmitted to the chord will be smaller. Therefore, the stress concentration in the chord will be smaller and the stress will be also uniform in the tubular joint. Reflected on the curve, it will be smoother. Under other working conditions, the SCF curve had obvious peak values and valley values.
4.4. Impacts of inclination angle on dynamic stress of tubular joints
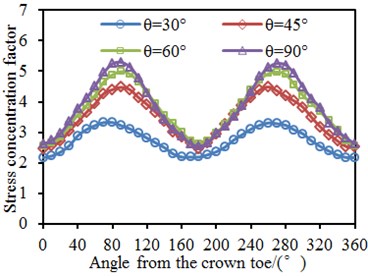
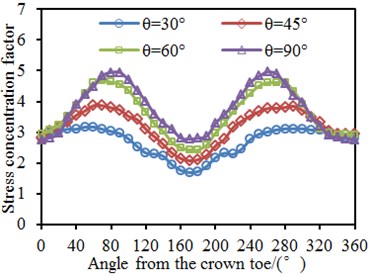
0.4, 10, 0.4 and 6 were kept unchanged. Circumferential SCFs of the chord and brace at the tubular joint under inclination angles of 30°, 45°, 60° and 90° were computed respectively, as shown in Fig. 13. It is shown in the figure that the SCF was 180° symmetric under different inclination angles. This angle was located at the crown point of tubular joints, while the welded steel pipe structure was a symmetric structure relative to the longitudinal plane. In addition, the chord and brace had SCF peaks at the angles of 90° and 270° because the two points were located at the saddle point of the tubular joint, and it is shown in the stress distribution contour that the stress was the maximum. Under angles of 0° and 180°, the SCF had obvious valley values because the two points were located at crown points of the tubular joint. In addition, the SCF on the chord and brace gradually increased with the increased . Increase of would lead to increase of vertical component force borne by the brace, so stress concentration at the tubular joint would be more obvious, as shown in Fig. 8. In addition, when was changed from 30° to 45°, the SCF curve of the brace increased obviously. However, with continuous increase of , the SCF curve only showed obvious changes at peaks, namely the saddle point. This result was consistent with results in Fig. 8.
Fig. 12SCF of tubular joints with different thickness ratios τ
a) Brace
b) Chord
Fig. 13SCF of tubular joints with different inclination angles θ
a) Brace
b) Chord
4.5. Impacts of length-width ratio on dynamic stress of tubular joints
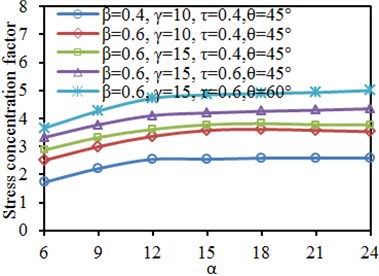
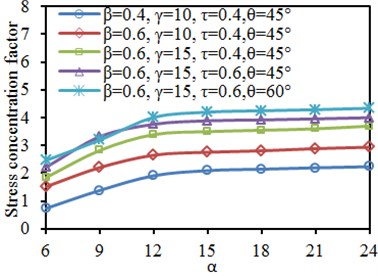
0.4, 10, 0.4 and 30° were kept unchanged. The length-width ratio was changed from 6 to 12 with the step length of 6. Circumferential SCFs of the chord and brace at the tubular joint under different length-width ratios were computed, as shown in Fig. 14. It is shown in the figure that the SCF was 180° symmetric under different length-width ratios. This angle was located at the crown point of tubular joints, while the welded steel pipe structure was a symmetric structure relative to the longitudinal plane. In addition, the chord and brace had SCF peaks at the angles of 90° and 270° because the two points were located at the saddle point of the tubular joint, and it is shown in the stress distribution contour that the stress was the maximum. Under angles of 0° and 180°, the SCF had obvious valley values because the two points were located at crown points of the tubular joint. In addition, SCF on the chord and brace increased gradually with the increased . Increase of would lead to increase of the chord length, so the equivalent rigidity would decrease, and the stress concentration at the tubular joint would be more obvious. In addition, when was changed from 6 to 12, the SCF curves of the chord and brace increased obviously. However, with continuous increase of , the SCF curves did not change obviously as many researches showed that when the length-width ratio was more than 12, the parameter only had very small impacts on stress concentration of the tubular joint.
Fig. 14SCF of tubular joints with different length-width ratio α
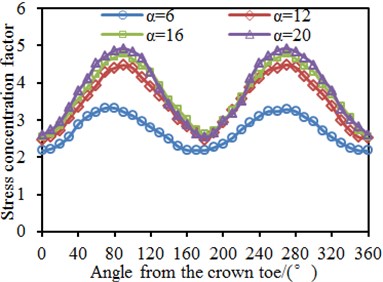
a) Brace
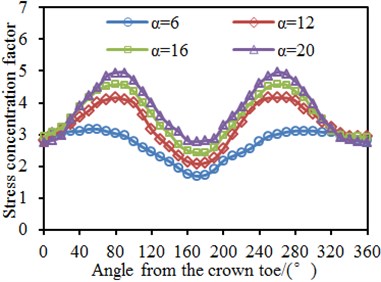
b) Chord
Fig. 15Impacts of width ratio β on SCF of characteristic positions
a) Brace: crown toe
b) Brace: crown heel
c) Chord: crown toe
d) Chord: crown heel
5. Impacts of parameters on dynamic stress of characteristic positions of tubular joints
As mentioned, impacts of different parameters on SCF of the tubular joint were analyzed. Here, impacts of different parameters on characteristic positions, namely crown toe and crown heel of the tubular joint are further researched.
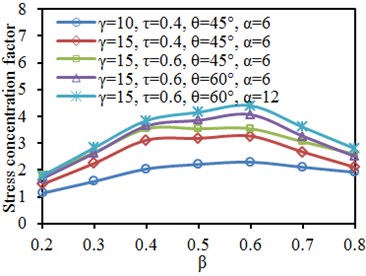
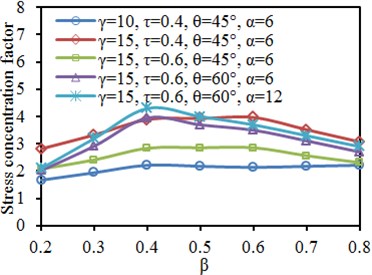
5.1. Impacts of width ratio on dynamic stress of characteristic positions
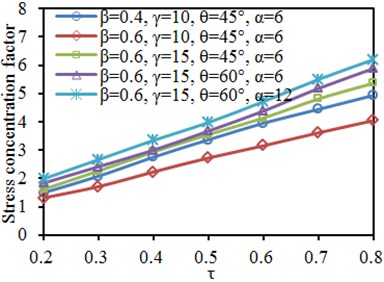
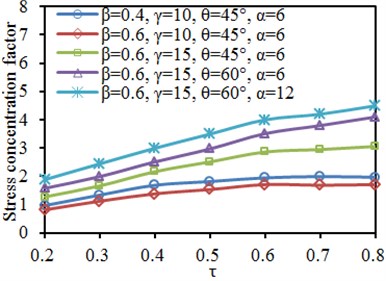
Fig. 15 shows SCF curves at the characteristic positions of tubular joints under different width ratios . It is shown in the figure that when other parameters were unchanged, the SCF at the characteristic positions of the chord and brace would increase after changing one parameter. At the crown heel of the brace, when the analyzed working condition was 15, 0.4, 45° and 6, the SCF curve showed different changing rules, which might be caused by low model accuracy under the parameters. In addition, the SCF curves at crown toe and crown heel of the chord and brace increased firstly and decreased then with the increased . The SCF curve of the chord at the crown toe and crown heel has the consistent changing trends.
5.2. Impacts of width-thickness ratio on dynamic stress of characteristic positions
Fig. 16 shows the SCF curves at characteristic positions of the tubular joint under different width-thickness ratios . It is shown in the figure that the SCF of the chord and brace did not show obvious rules with the changes of parameters. However, when other parameters were unchanged, the SCF at each characteristic position increased with the increased length-width ratio . The SCF curve at the crown toe and crown heel of the chord and brace increased linearly with the increased . The increased would cause decrease of thickness of the chord, so the connection rigidity at the tubular joint would decrease, and the stress concentration would be more obvious.
Fig. 16Impacts of width-thickness ratio γ on SCF of characteristic positions
a) Brace: crown toe
b) Brace: crown heel
c) Chord: crown toe
d) Chord: crown heel
5.3. Impacts of thickness ratio on dynamic stress of characteristic positions
Fig. 17 shows the SCF curves of characteristic positions of the tubular joint under different thickness ratios . It is shown in the figure that the SCF of the chord and brace did not show obvious rules with the changes of parameters. The SCF curves at crown toe and crown heel of the chord increased linearly with the increased . The increased would increase thickness of the brace, so connection rigidity of the tubular joint would be improved, and stress concentration would be weakened. However, SCF of the brace increased firstly and decreased then with the increased , and did not show any linear increase phenomenon.
Fig. 17Impacts of thickness ratio τ on SCF of characteristic positions
a) Brace: crown toe
b) Brace: crown heel
c) Chord: crown toe
d) Chord: crown heel
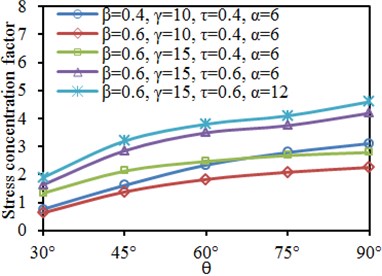
5.4. Impacts of inclination angle on dynamic stress of characteristic positions
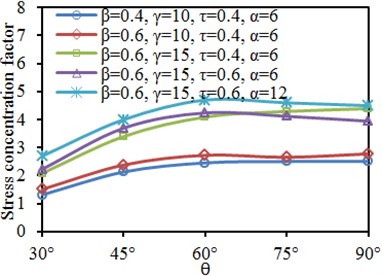
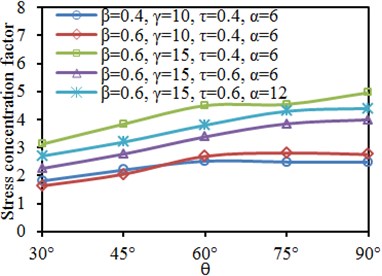
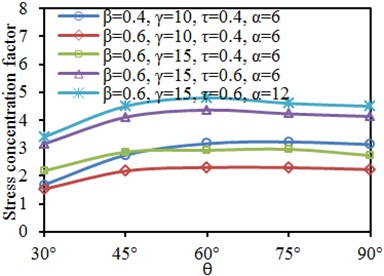
Fig. 18 shows SCF curves of characteristic positions of the tubular joint under different inclination angles . It is shown in the figure that the SCF of the chord and brace did not show obvious rules with changes of each parameter. SCF of crown toe and crown heel of the chord and brace gradually increased at first with the increased . When increased to a certain value, the SCF basically reached a stable value. It is shown in Fig. 8 and Fig. 13 that effects on SCF were slight when was large.
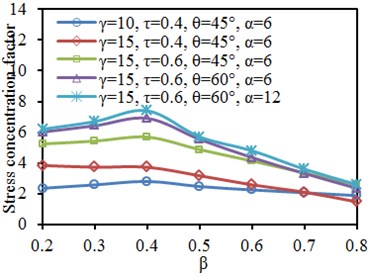
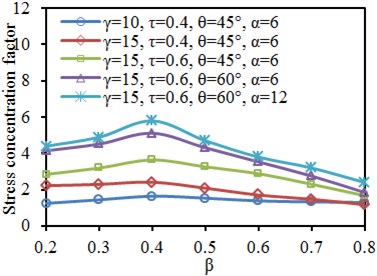
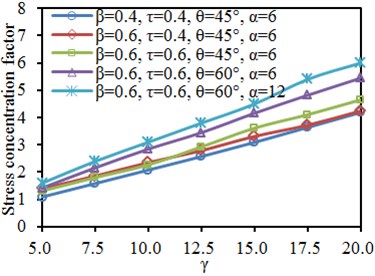
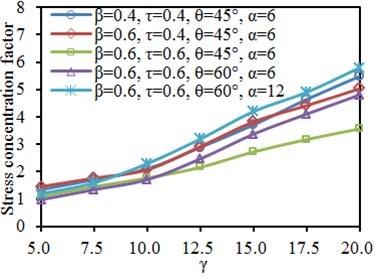
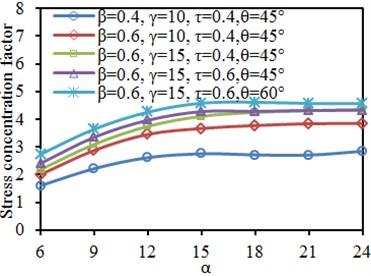
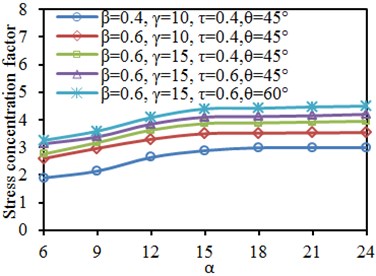
5.5. Effects of length-width ratio on dynamic stress of characteristic positions
Fig. 19 shows SCF curves of characteristic positions of tubular joint under different length-width ratio . It is shown in the diagram that when the length-width ratio was unchanged, the SCF of main tube and branch tube increased gradually with the increase of each parameter. In addition, the SCF at crown toe and crown heel of the main tube and branch tube gradually increased at first with the increase of . When increased to 12, SCF at all the positions basically reached a stable value. The result was similar to results mentioned in Section 4.5.
Fig. 18Effects of inclination angle θ on SCF of characteristic positions
a) Brace: crown toe
b) Brace: crown heel
c) Chord: crown toe
d) Chord: crown heel
Fig. 19Impacts of length-width ratio α on SCF of characteristic positions
a) Brace: crown toe
b) Brace: crown heel
c) Chord: crown toe
d) Chord: crown heel
6. Vibration analysis on welded steel pipes with considering axial pre-tensile forces
The mentioned researches studied dynamic stress distribution during applying tensile forces to a steel pipe structure, but the studied results showed that the structural vibration was very weak. With application of steel pipe structures and increasing growth of structural collision damage events, steel pipe structures presented an obvious vibration performance under impact forces, which also draw attention of many scholars. During application of steel pipes, due to structural weight and equipment loads, the steel pipe structures would bear axial tensile forces. When the steel pipe structures bear impact loads, failure of the impacted parts would cause decrease of structural stiffness, bearing ability and stability, which would finally cause overall failure of the structure. Therefore, it was important to study and predict vibration performance of steel pipe structures under the impact force.
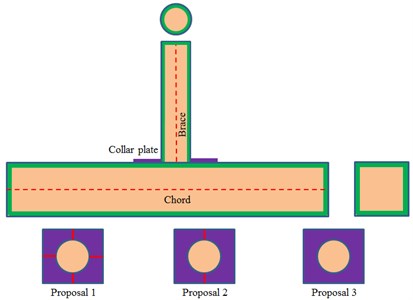
It was shown in above analysis that different steel pipes in a steel tube structure are assembled together through welding. Stiffness at welding parts was always not continuous, and thus stress concentration was obvious, which was also verified in the above analysis. Impact toughness of steel materials was reduced by welding joint defects, so the dynamic bearing ability of structures was reduced. Tubular joints were a key position in the steel pipe structure, so its design inevitably became the design key of steel pipe structures. In engineering practices, tubular joints were always broken due to welding joint fractures, bending of chord pipe upper surface, chord pipe buckling, etc. In order to improve bearing and fatigue performance of joints, connection forms were generally improved to strengthen tubular joints. Tubular joints were mainly reinforced by pipe wall thickening, internal setting of insertion plates, cushion plates and collar plates, etc. During reinforcement with collar plates, a brace pipe was directly welded to a chord pipe at first. Based on original non-reinforced joints, the collar plate was welded to the brace pipe and chord pipe, as shown in Fig. 20. In general, collar plates could be classified into three types: one piece, two pieces and four pieces, as shown in Fig. 20. Choo [24] studied static strength of steel pipe joints using collar plate as reinforcement under planar bending moment. Results showed that: relative to cushion plate reinforcement, bearing forces of joints could be improved more effectively using collar plates as reinforcement. Therefore, collar plate reinforcement was also applied to the welded steel pipe in this paper.
Fig. 20Reinforcement forms of welded steel pipes
The mentioned researches focused on dynamic stress distribution of the welded steel pipe under axial tensile forces of 100 kN. Therefore, in this section, the axial tensile force of 100 kN was applied to the tail end of the brace pipe. In addition, the brace pipe joint also bore the drop hammer impact effects under initial speed of 6.65 m/s and weight of 590 kg. In the finite element model, pre-tensile forces and impact loads were applied step by step. At the first stage, static analysis was used to simulate the initial force states of tubular joints. At the second stage, dynamic display analysis was used to simulate working performance of the tubular joints under coupling between axial forces and impact loads. Dynamic analysis was adopted and displayed in the model and time integration was conducted. Therefore, it would need some duration to reach an impact speed through gravity action, and the duration would far more than the impact action time. Therefore, a lot of computer resources would be wasted. Therefore, in the finite element model, the drop hammer was placed above the component, where its axis coincided with the brace pipe axis. The translation initial speed along the brace pipe axis was defined for it. In order to ensure that axial force was completed before the drop hammer hit the joint, the duration for axial force application should be shorter than the falling time of the drop hammer.
Fig. 21Time-history curves of impact forces of four kinds of models
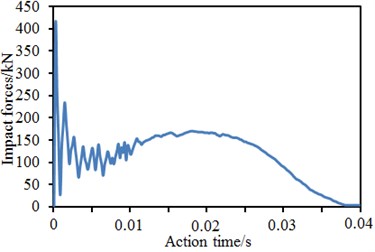
a) Original model
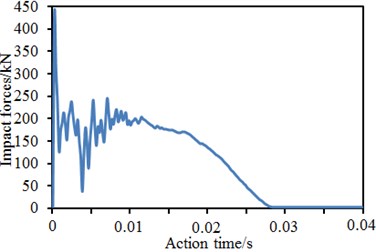
b) Reinforcement proposal 1
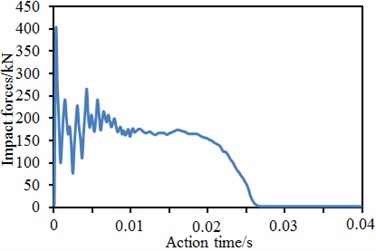
c) Reinforcement proposal 2
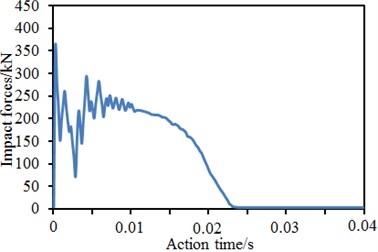
d) Reinforcement proposal 3
In the paper, vibration characteristics of three kinds of reinforcement proposals and the original model under impact forces were computed, respectively. Fig. 21 showed the impact force time-history curves of four kinds of models under the impact forces. It was shown in the figure that curves in the whole process could roughly be divided into five stages: (1) rapid growth stage, which started from the contact moment between drop hammer and brace pipe till the moment when the impact force reached a peak value; (2) oscillation decrease stage, which lasted from oscillation of impact force peak to the valley value; (3) growth and development stage, which lasted from oscillation rise of impact force valley value to the oscillation ending; (4) steady development stage, which lasted from the ending of impact force oscillation till the moment when the displacement reached the maximum value; (5) unloading stage, where the steady development of impact forces ended, and the stage lasted since the impact force unloading till the moment when the impact force decreased to zero. At the first stage, the impact force reached the peak value instantly because direct collision between the drop hammer and brace pipe happened at an instant. Such duration was very short, so the contact could be deemed as their elastic collision. While colliding with the brace pipe, the drop hammer formed axial stamping to the brace pipe. Axial stiffness of the brace pipe was more than horizontal stiffness of the chord pipe, so the peak value was closely correlated with axial bearing force of the brace pipe, but was not closely related with joint bearing force. Stiffness at tubular line parts of chord and brace pipes was not continuous, so the stress concentration state could appear easily. Cross section bending moment was large near the tubular line. Therefore, the saddle point or the crown point of welded steel pipes would reach the yield strength at first. Then, the yield strength would be gradually expanded, causing buckling of chord pipe around the tubular line, as well as violent vibration and rapid decrease of impact forces. After that, the third stage began, and the impact force oscillation increased. On one hand, the deformation rate was large, so the material strain rate increased and the material yield strength was also strengthened, so that resistance of the welded pipe was improved; on the other hand, under the drop hammer impact, the brace pipe compressed the chord pipe to get sunken and deformed, so that the pipe wall would generate tension forces and especially the tension force generated in the chord pipe annular direction would seriously affect the impact force. Under impact effects, the welded pipe vibrated violently, leading to violent fluctuation of impact forces. Compared with the original model, stiffness of the welded pipe was improved by the collar plates, so that the joint impact force had larger vibration amplitude. With weakening of the vibration, the impact entered the fourth stage. At this stage, the displacement on the chord pipe top position kept on increasing till reaching the maximum value. Displacement on the pipe bottom increased slowly or stayed unchanged. The anti-bending stiffness of cross section near the tubular line was weakened continuously. Due to strain rate effects, the impact force was increased or reduced slightly, or kept stable.
Fig. 22Time-history curves of vibration displacement of four kinds of models
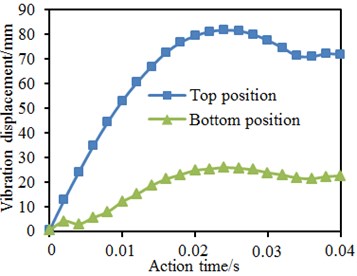
a) Original model
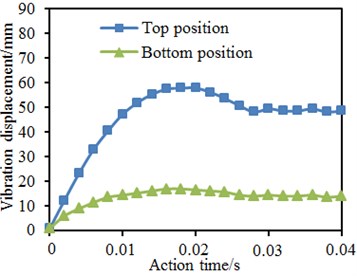
b) Reinforcement proposal 1
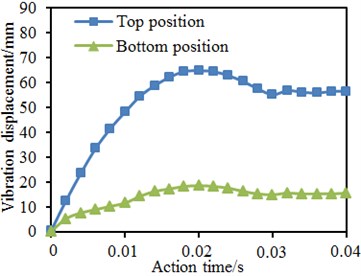
c) Reinforcement proposal 2
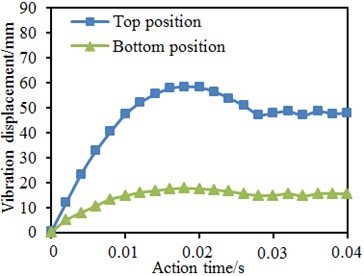
d) Reinforcement proposal 3
Basically, impact forces of the original model kept on increasing; impact forces of the model with collar plate reinforcement kept horizontal development or showed a slight decrease tendency. In addition, reinforcement proposals of three kinds of reinforcement models were different. Therefore, under the same impact condition, the changing tendencies of impact forces were slightly different. When the impact force entered the unloading stage, the deformation of welded pipes reached the maximum value at this moment. After that, the elastic deformation of the welded pipe started recovery, the drop hammer also began moving upwards, and the contact force between drop hammer and welded pipe gradually decreased till zero. At this stage, decrease of the impact force was not attributed to the welded pipe loss of bearing ability. Instead, it was caused by that the welded pipe still had enough stiffness and could get great spring-back. Therefore, impact forces decreased continuously at this stage, but the welded pipe still had subsequent bearing forces.
Time-history curves of vibration displacement reflected changes of displacement of key positions of the welded pipe. Fig. 22 presented time-history curves of vibration displacement of some key positions at tubular joints with pre-tensile forces under impact forces. In combination with five stages of the impact force time-history curve, the displacement time-history curve can also be divided at corresponding time points: (1) starting stage of deformation; (2)-(3) rapid growth stage; (4) continuous development stage; (5) elastic recovery stage. At the first stage, the welded pipe basically did not generate vibration displacement as the impact hammer did not get contact with the brace pipe at this moment. From the second stage to the third stage, the displacement increased most quickly, namely the chord pipe wall in the tubular line region of the welded pipe got buckling and the buckling effect was expanded continuously. Regarding the original model, the displacement was firstly slowed down, then accelerated and finally slowed down. The displacement of the model with collar plate reinforcement increased linearly at first and was then slowed down. At the fourth stage, the displacement of the welded pipe slowly increased to the maximum value. The displacement growth range of the original model was large, and the growth range of the model with collar plate reinforcement was small. At the fifth stage, the welded pipe got spring-back, the elastic deformation was recovered and the displacement fell. In addition, it was shown in the figure that vibration displacement could be reduced obviously through reinforcement of tubular joints with the collar plates. In addition, the maximum vibration displacement using proposal 1 and proposal 3 was smaller than that of the proposal 2.
Fig. 23Impacts of axial pre-tensile forces on vibration displacement
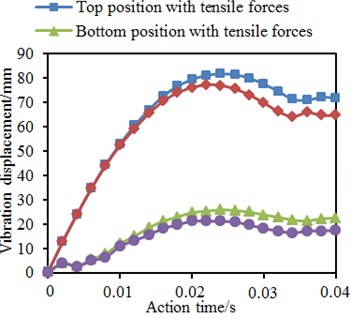
a) Original model
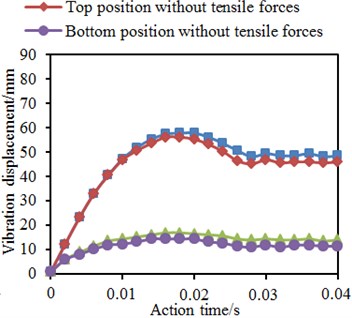
b) Reinforcement proposal 1
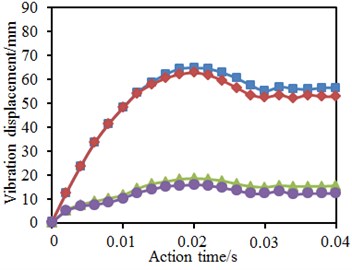
c) Reinforcement proposal 2
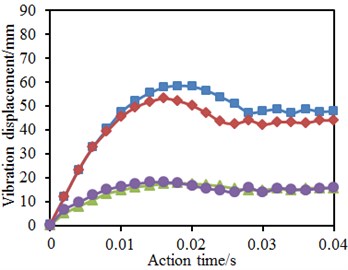
d) Reinforcement proposal 3
In the mentioned researches, the tubular joints contained axial pre-tensile forces. It was necessary to further study the impacts of axial pre-tensile forces on vibration performance of tubular joints under impact forces. Therefore, without considering axial pre-tensile forces, the vibration displacement of tubular joints under the impact force was computed again. Fig. 23 shows time-history curves of vibration displacements on top and bottom positions of the chord pipe in each model. It was shown in the figure: axial pre-tensile forces would increase vibration displacement on top and bottom positions of the chord pipe; before the vibration displacement on the top position reached the maximum value, the axial pre-tensile force did not cause obvious impacts; with the increased vibration displacement, the additional bending moment increased, and the axial force impact began appearing. Relative to vibration displacement on the pipe top position, impacts of the axial pre-tensile force on the vibration displacement of the pipe bottom began appearing at the impact starting stage. With increase of the vibration displacement, the additional bending moment of axial pre-tensile forces increased, and the bottom displacement increment also increased. After that, with the elastic deformation recovery of the model, the additional bending moment tended to decrease.
7. Conclusions
Tubular joints of welded steel pipes under axial loads were studied numerically for determination of dynamic stress concentration factors (SCF). Finite element models were setup for a total of 165 tubular joints with various configurations, obtaining dynamic stress distributions of each model along the joint. Stress concentration factors on the brace and the chord were extracted respectively. Relations between sizes of stress concentration factors of the joint and structural parameters were discussed. Finally, the vibration performance of the joint was analyzed. The detailed conclusions can be obtained:
1) The experimental curve was basically consistent with the finite element at the elastic stage of loading, indicating that the simulation at the elastic stage was very accurate. The paper mainly studied stress distribution of the tubular joint of welded steel pipes under an excitation load at the elastic stage, so the finite element model could be used to replace experimental test. In this way, the computational time could be increased effectively, and studied cost could be reduced.
2) Positions with large stress at the tubular joint were mainly distributed at the crown and saddle points. Sizes of crown points and saddle points were similar at the tubular joint. The welded steel pipe was symmetric relative to the longitudinal plane. Therefore, its stress distribution was symmetrical.
3) The paper mainly studied impacts of five parameters including , , , and on stress distribution of the tubular joint. SCF was 180° symmetric under different parameters. This angle was located at the crown point of tubular joints, while the welded steel pipe structure was a symmetric structure relative to the longitudinal plane. In addition, the chord and brace had SCF peaks at the angles of 90° and 270° because the two points were located at the saddle point of the tubular joints. It is shown in the stress distribution contour that the stress was the maximum. Under angles of 0° and 180°, the SCF had obvious valley values because the two points were located at crown points of tubular joints.
4) When was changed from 6 to 12, the SCF curves of the chord and brace increased obviously. However, with continuous increase of , the SCF curves did not change obviously as many researches showed that when the length-width ratio was more than 12, the parameter only had very small impacts on stress concentration of the tubular joint.
5) Impacts of different parameters including , , , and on characteristic positions, namely crown toe and crown heel of the tubular joint are further researched, but these parameters did not cause an obvious changing rule for the stress of characteristic positions.
6) Vibration displacement could be reduced obviously through reinforcement of tubular joints with the collar plates. Axial pre-tensile forces would increase vibration displacement on top and bottom positions of the chord pipe; before the vibration displacement on the top position reached the maximum value, the axial pre-tensile force did not cause obvious impacts.
References
-
Lesani M., Bahaari M. R., Shokrieh M. M. FRP wrapping for the rehabilitation of Circular Hollow Section (CHS) tubular steel connections. Thin-Walled Structures, Vol. 90, 2015, p. 216-234.
-
Xu F., Chen J., Jin W. Punching shear failure of concrete-filled steel tubular CHS connections. Journal of Constructional Steel Research, Vol. 124, 2016, p. 113-121.
-
Sabbagh A. B., Chan T. M., Mottram J. T. Detailing of I-beam-to-CHS column joints with external diaphragm plates for seismic actions. Journal of Constructional Steel Research, Vol. 88, 2013, p. 21-33.
-
Wang K., Tong L. W., Zhu J., et al. Fatigue behavior of welded T-joints with a CHS brace and CFCHS chord under axial loading in the brace. Journal of Bridge Engineering, Vol. 18, Issue 2, 2011, p. 142-152.
-
Lipp A., Ummenhofer T. Influence of tensile chord stresses on the strength of circular hollow section joints. Steel Construction, Vol. 7, Issue 2, 2014, p. 126-132.
-
Nguyen M. P., Tan K. H., Fung T. C. Numerical models and parametric study on ultimate strength of CHS T-joints subjected to brace axial compression under fire condition. Tubular Structures XIII, Hong Kong, 2010, p. 733-740.
-
Ozyurt E., Wang Y. C., Tan K. H. Elevated temperature resistance of welded tubular joints under axial load in the brace member. Engineering Structures, Vol. 59, 2014, p. 574-586.
-
Lee C. K., Chiew S. P., Lie S. T., et al. Comparison of fatigue performances of gapped and partially overlapped CHS K-joints. Engineering Structures, Vol. 33, Issue 1, 2011, p. 44-52.
-
Kim W. B., Shin K. J., Lee H. D., et al. Strength equations of longitudinal plate-to-circular hollow section (CHS) joints. International Journal of Steel Structures, Vol. 2, Issue 15, 2015, p. 499-505.
-
Wu L., Li Z., Han Q. Experimental study on static behavior of plate reinforced tubular N-joints. Jianzhu Jiegou Xuebao (Journal of Building Structures), Vol. 31, Issue 10, 2010, p. 83-88.
-
Ahmadi H., Lotfollahi Yaghin M.-A., Aminfar M. H. Distribution of weld toe stress concentration factors on the central brace in two-planar CHS DKT-connections of steel offshore structures. Thin-Walled Structures, Vol. 49, Issue 10, 2011, p. 1225-1236.
-
Chen Y., Chen D. Ultimate capacities formulae of collar and doubler plates reinforced SHS X-joints under in-plane bending. Thin-Walled Structures, Vol. 99, 2016, p. 21-34.
-
Borges L., Chiew S. P., Nussbaumer A., et al. Advanced numerical modeling of cracked tubular K joints: BEM and FEM comparison. Journal of Bridge Engineering, Vol. 17, Issue 3, 2011, p. 432-442.
-
Lee S. H., Shin K. J., Lee H. D., et al. Test and analysis on the longitudinal gusset plate connection to circular hollow section (CHS) of high strength. Journal of Korean Society of Steel Construction, Vol. 24, Issue 1, 2012, p. 35-46.
-
Zhao B. D., Liu C. Q., Zhang S. Y., Zhang J. S. Calculation model for axial rigidity of CHS Y-type Joints. Journal of Southwest Jiaotong University, Vol. 50, Issue 5, 2015, p. 872-878.
-
Wang F., Chen Z. J., Liu D. D., Luo M., Ning X. Calculation method for bearing capacities of internal ring-stiffened tubular T-and Y-joints. Journal of Southeast University (Natural Science Edition), Vol. 44, Issue 4, 2014, p. 811-816.
-
Yang W. G., Wang Y. F., Duan Y. H., Zou Q. Influence of geometric characteristic on ultimate bearing capacity of circular tubular joints. Journal of Jiangsu University (Natural Science Edition), Vol. 32, Issue 5, 2011, p. 591-596.
-
Jiao J. F., Ma X., Lei H. G. Finite element analysis on behavior of the complex spatial welded steel tubular intersecting joints. Journal of Taiyuan University of Technology, Vol. 47, Issue 1, 2016, p. 21-26.
-
Huang B. S., Shao Q. J., Mei L., Ma Q. L., Liang Z. N., Guo F., Qian Y. A. Full-scale experimental research on ultimate capacity for X-joints. Industrial Construction, Vol. 46, Issue 3, 2016, p. 119-123.
-
Shu X. J. Finite element analysis of complex circular tubular joints in a practical project. Spatial Structures, Vol. 21, Issue 2, 2015, p. 85-90.
-
Acevedo C., Nussbaumer A. Effect of tensile residual stresses on fatigue crack growth and S–N curves in tubular joints loaded in compression. International Journal of Fatigue, Vol. 36, Issue 1, 2012, p. 171-180.
-
Lesani M., Bahaari M. R., Shokrieh M. M. Numerical investigation of FRP-strengthened tubular T-joints under axial compressive loads. Composite Structures, Vol. 100, 2013, p. 71-78.
-
Tong L. W., Zheng H. Z., Mashiri F. R., et al. Stress-concentration factors in circular hollow section and square hollow section T-connections: experiments, finite-element analysis, and formulas. Journal of Structural Engineering, Vol. 139, Issue 11, 2012, p. 1866-1881.
-
Choo Y. S., Liang J. X., Van Der Vegte G. J., et al. Static strength of collar plate reinforced CHS X-joints loaded by in-plane bending. Journal of Constructional Steel Research, Vol. 60, Issue 12, 2004, p. 1745-1760.
About this article

