Abstract
A catastrophic accident may be caused for nearby spacecraft due to the damage occurred in C/SiC thermal protection structure. Therefore, it is significant to analyze the damage feature of the ceramic composite structure. Acoustic emission (AE) is an effective non-destructive testing method which is widely used in aerospace industry. However, some key problems should be solved when the AE technology applied to the engineering field. In this paper some propagation characteristics of AE waves in C/SiC plate were investigated based on the finite element method. Firstly, two kinds of AE sources were established by combining plate wave theory and finite element method. Secondly, a novel simulation model was established which included the mechanical characters of C/SiC composite. Then to simulate the AE source, a stepped load and a dipole force is applied to generate the release of power loss. Additionally, the results of simulation are validated through the AE experiment with the analysis method of Choi-Williams transformation. Finally, the attenuation of AE signals propagation in C/SiC plate is discussed. The results of this research work demonstrated that the simulation method of AE waves in C/SiC structure proposed in this paper can be effectively used to study the wave propagation phenomenon
1. Introduction
Carbon fiber rein-forced silicon carbide (C/SiC) composite materials are favorable for thermo structural components due to their excellent specific mechanical properties, high thermal conductivity and thermo shock resistance. They have been made into several high-temperature (>1300 °C) aerospace applications, such as hot turbine engine components, leading edge applications for hypersonic vehicles, and load-bearing TPS structures for re-entry [1-5]. One obvious characteristic of the ceramic matrix composites such as C/SiC ceramics, is their brittleness, leading to the structures having almost no energy absorbing capacity. As a result, sudden damage may take place when the C/SiC composite is subjected to external loads even the minor surface cracks or internal defects including micro-cracks and holes. The most typical case is the space shuttle Columbia in February 2003, which broke apart during reentry resulting in loss of 7 crewmembers and the craft. The cause was a breach in the left wing leading edge reinforced carbon-carbon (RCC) thermal protection system initiated by the impact of thermal insulating foam that had separated from the orbiters external fuel tank 81 seconds into the mission’s launch [8, 9].
The proper implementation of C/SiC composite materials in structural applications requires understanding the nature of the various damage mechanisms that are involved and their relation to life expectancy. Therefore, it is necessary to adopt appropriate non-destructive testing method to ensure the safety of spacecraft. Numerous health monitoring techniques have been used for this purpose [10, 11]. The acoustic emission (AE for short) technology is widely used among the structural health monitoring industry. AE is a transient wave resulting from the sudden release of stored energy during a damage process. In composite materials, matrix cracking, fiber failure, interfacial debonding and sliding are possible sources of AE [12-16]. AE differs from other techniques in that it is based on the analysis of elastic waves that are generated by material damage. The AE technique seems to be a very appropriate tool to detect in situ information about the occurring damage. In the recent past the AE approach has been successfully applied in order to locate and monitor damage evolution in several ceramic matrix composite materials and has proven to correlate individual AE events to specific damage sources [17-19]. One of the main current challenges in health monitoring of composites is the use of AE in order to identify damage modes [20-23]. This is based on the assumption that different damage modes generate AE signals with specific features. Because of the highly-dispersive nature of composites, AE signal properties in the time domain are greatly affected by propagation. Current developments thus focus on the use of AE signal frequency content to characterize damage modes. Numerous publications have proposed methods for the identification of damage modes in composites using acoustic emission but they fail to address the effects of propagation characteristic such as energy attenuation on AE signal features and how those may affect the ability to differentiate between damage modes. Additionally, the propagation characteristics of AE wave in C/SiC composite is considerably complex because of the anisotropy and internal structure, which is a main drawback of the AE technique in composite structures damage detection [24-27].
The objective of this paper is to characterize the effects of micro structure of plain wave C/SiC composite on AE signal features and to identify the limitations of damage mode identification based on AE signal frequency content. To study the AE propagation in C/SiC composite, the finite element method was used. Firstly, the AE sources are established based on the theory of finite element method and composite. Secondly, the AE wave propagation characters are discussed by using this model, which can reduce the contributions of reflections from the specimen boundaries. Then the attenuation of AE signals propagation in C/SiC plate is discussed. It is showed that the microscopic elastic properties of the AE source have significant influence on the excitation of distinct AE wave modes. The results demonstrate that the application of these methods help support in-flight as well as post-flight impact analysis by identifying failure modes and breakage of fibers from flexural and/or extensional mode AE signals in TPS.
2. Finite element modeling
Lots of classical elastic wave theory can be found to explain the AE wave propagation characters in composite structures, such as publication contributed by Thompson and Haskell [28, 29]. But some problems of the numerical simulation should be overcome. In reference [30, 31] those research results can be obtained. Besides, Kundu used the finite element to predict the AE wave propagation in composite [31]. The finite element method owns some advantages when it is compared to the numerical approach. With the review of the theory of finite element method, the AE wave propagation can be calculated by the strain-stress relationship. Some finite element software package such as ABAQUS can be well used to simulate AE wave propagation based on the theory of virtual work [38-42].
2.1. FE model of the planar C/SiC composites
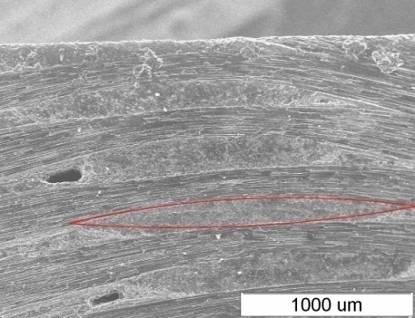
Typical microstructure of a woven C/SiC composite is shown in Fig. 1, where one of the cross-sectional profile of the warp approximately parallel to the weft direction in the interwoven region has been highlighted. A lenticular-shaped cross-section of the fiber tow is observed, which is a prominent feature. According to the conclusions of reference [1], the ratio of the major axis to the minor axis of the tow cross section of the C/SiC composites with 1K yarn is approximately 10:1. In order to establish the finite element (FE) model of the two-dimensional woven laminated composite, following assumptions and simplifications should be proposed. (1) The cross-section of the yarn can be considered as a double-sided convex lens with two arc-shaped lenticulars according to the microstructure shown in Fig. 1. (2) The two orthogonal yarns are formed as interwoven structure, where the fiber is simulated by a straight segment combined with an arc. Specifically, the section of the fiber contacted with the matrix is modeled as arc, while other sections are modeled by lines which are tangent to the previous arcs. Fig. 1 clearly shows the microstructure of the C/SiC material, which can be used to guide the work of finite element modeling.
Fig. 1Typical microstructure of a C/SiC composite
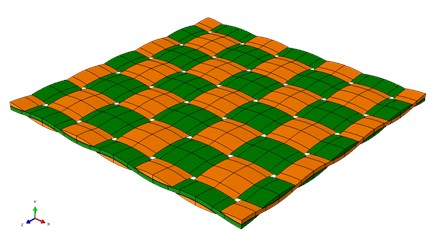
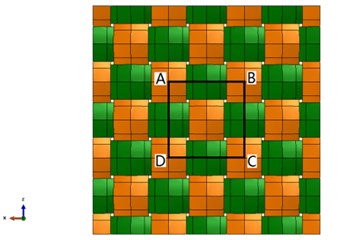
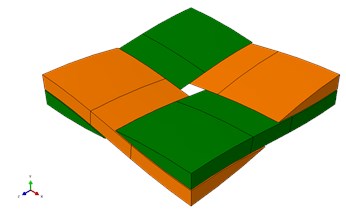
Based on the above assumptions and simplifications, the two-dimensional woven laminated composite structure can be obtained, as shown in Fig. 2. The fibers are arranged in accordance with the structure in Fig. 1, green and yellow fibers are weaved alternately to form a microstructure. The plain woven structure obviously presents periodicity in all directions. Taking the smallest repeatable unit, which is the area marked as A-B-C-D area as shown in Fig. 3 as a single cell, the representative volume element (RVE) of the C/SiC can be established in the ABAQUS software. Firstly, the quarter section of the yarn in the RVE is established, as shown in Fig. 3(a). Then, the whole yarn model in the RVE is obtained by two mirroring operations as shown in Fig. 3(b). The matrix model shown in Fig. 3(c) can be obtained through boolean operations. Finally, the required RVE mode can be obtained by assembling a yarn and the matrix, which is shown in Fig. 3(d).
Fig. 2Two-dimensional woven laminated composite structure
a) FE mode
b) Projection in - plane
2.2. Establishment of AE source model
Modeling of AE wave generation and propagation in plate is discussed in the following sections. Various types of input sources can generate wave propagation in a structure. Some of these are, wave propagation due to crack growth, wave propagation due to the excitation by an actuator to study and compare baseline and damaged signals, wave propagation due to a foreign object impact like a bird or a torpedo hit etc. These are step input/impulse input, impact input and a harmonic input of a specific frequency. Step input models an AE titled as a Hsu-Nielsen AE source in a laboratory environment.
Fig. 3Establishment of the two-dimensional woven laminated composite structure
a) Quarter section of the yarn
b) Yarn model
c) Matrix model
d) The assembling model
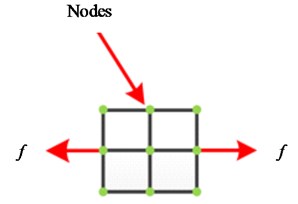
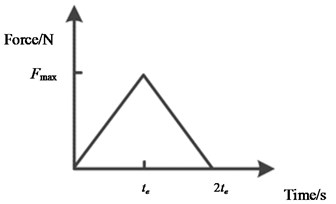
To model impact, delamination, or crack propagation, a transient excitation such as a delta or step function is needed. In order to excite an AE signal in the present study, a delta force function is applied (Fig. 4). In this configuration, a distance of 1 mm was introduced between the two points at each of which a dipole source is embedded. Each of them is capable of generating a force of 1 N. The two points will be located at the appropriate nodes when the FE mesh is generated:
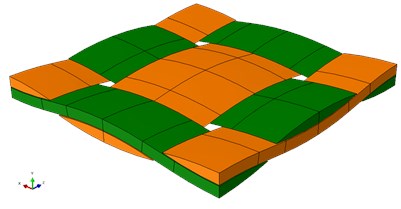
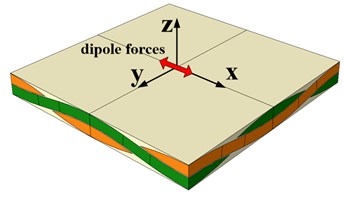
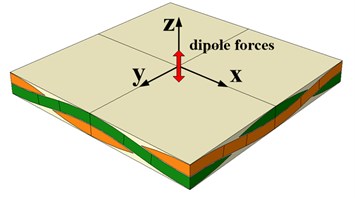
For simulation of different AE sources of the C/SiC composite plates shown in Fig. 5, the cartesian coordinate system is consistent with the model. Two typical kinds of damage are considered in the simulation work including the breakage of fiber and matrix respectively.
Fig. 4Numerical simulation model of AE source
a)
b)
Fig. 6 shows the AE wave propagation described by the contour of displacement in -plane when the excitation time is set as 50 μs. The direction of the excitation force was presented by the arrows, and the value of the force is 1 N, and the excitation time is 2.5 μs.
Fig. 6 summarized the results of AE wave propagation in C/SiC when two different kinds of damages modes were considered. It can be found that the main propagation path is along the fiber layers when the fiber is cracked.
Fig. 5AE source model of C/SiC: a) along the fiber, b) perpendicular to the fiber
a)
b)
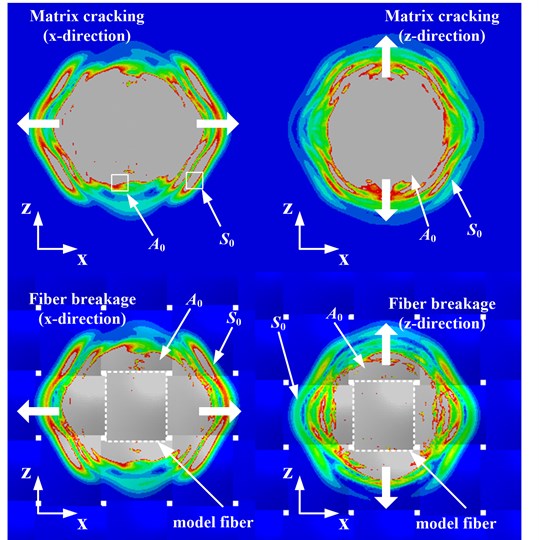
Fig. 6Two types of AE source in the simulation
2.3. Position of the AE sources and sensors
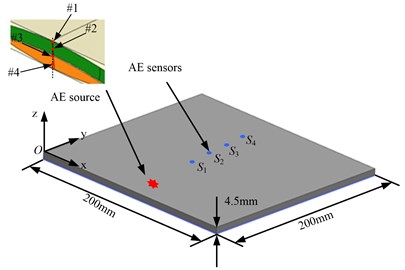
The present simulations were performed for rectangular plate specimens with 200 mm×200 mm edge length and 4.5 mm thickness as shown in Fig. 7. In order to investigate the influence of AE source position on the wave propagation characteristic, different locations in the thickness direction of the plate are used to generate the AE sources. Additionally, in order to gain a better understanding the attenuation effect of the composite material on the wave, four different AE sensors are arranged in a straight line to receive the signals from a same source. The AE sources are distributed in typical positions of the cross-section of the plate in thickness direction, which are the top surface of the matrix, middle section of the upper fiber, surface of the middle matrix and middle section of the bottom fiber.
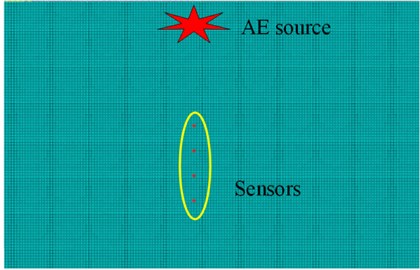
Fig. 7 shows a schematic diagram of the measuring points and acoustic emission sources. The cross point of the - and -axis is assigned as the origin of coordinates. To comprehensively study the performance of this method, four AE sources are excited in different position of the plate. The locations of these AE sources are respectively marked with #1 (100, 50, 0), #2 (100, 50, –1), #3 (100, 50, –2), #4 (100, 50, –3), while the AE sensors are located as s1 (50, 75, 0), s2 (50, 100, 0), #3 (50, 125, 0), #4 (100, 150, 0). The FEM model of the AE wave simulation was shown in the bottom section of Fig. 7.
Fig. 7Simulation of AE-wave propagation in SiC plates
a)
b)
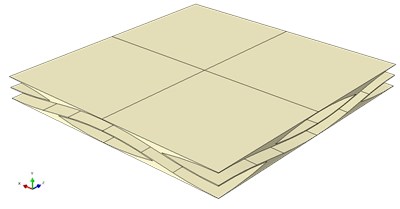
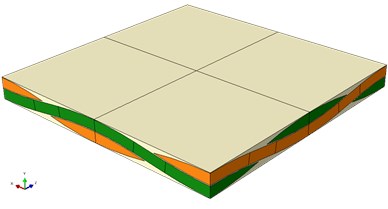
Fig. 8 shows the AE wave propagation when is 2.5 μs and the excitation force is 1 N. When the simulation was done, the waveform of the AE signals can be displayed in the form of displacement field. The displacement in direction is the dominant component of the whole result. Besides, it can be found that the energy of wave is higher than wave. To understand this phenomenon more detail, Fig. 8 shows the waveform which contains lots of information. The simulation times are taken as 5 μs, 10 μs, 20 μs, 30 μs, 40 μs, and 60 μs respectively. To the knowledge of the author, the velocity of S0 mode wave is higher than A0 mode wave, which was verified by Fig. 9 and Fig. 10. This phenomenon can also be found in the publication work written by Hamstad [43].
Fig. 8Gradually propagation of the AE waves generated by matrix cracking
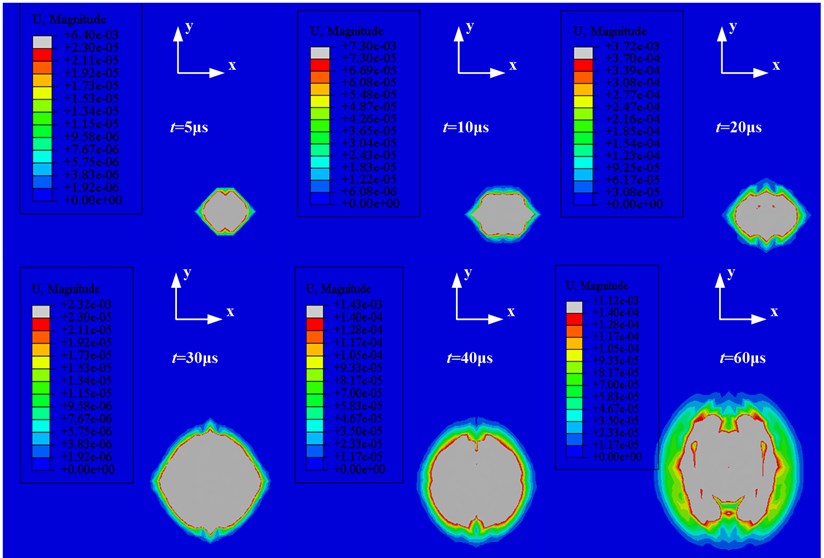
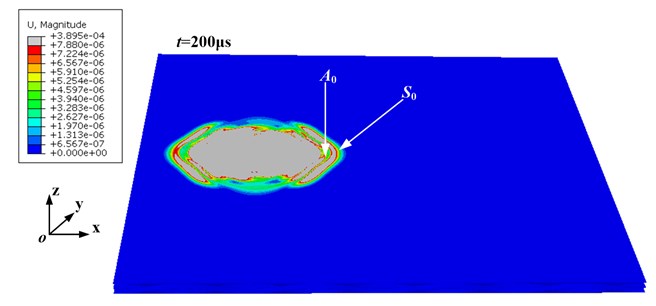
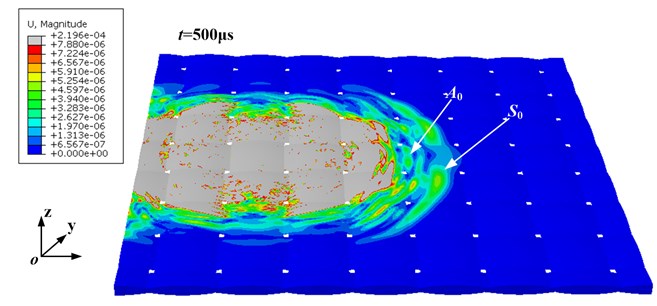
Fig. 9Displacement field of AE wave propagation in the matrix. The excitation times are 200 μs, 400 μs and 500 μs respectively
a)
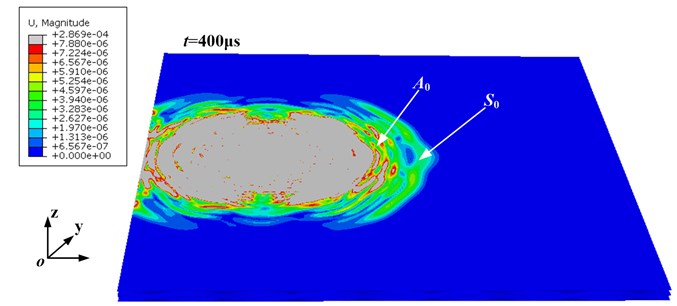
b)
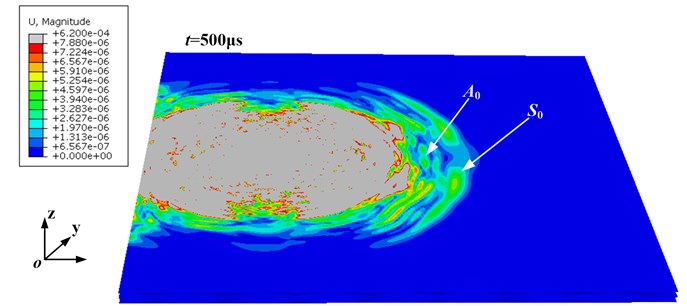
c)
Several significant conclusions can be drawn by analyzing the AE wave scenes in above. (1) The typically C/SiC composite microstructure proposed in this paper can be effective used for the research of AE wave propagation. Abundant information about the AE characteristic can be obtained by carrying out the AE simulation. (2) For the C/SiC composite the behaviors of AE wave in the matrix is much the same as the wave propagating in the fiber. And there are a variety of mode are contained in the AE waves. (3) The AE wave can be well propagating in the woven fibrous structure without gaps in the whole wave field. Besides, the propagation way is not affected by the geometry section of the fiber and the contacting area between the fiber and matrix. (4) The mode contained in the AE wave propagates in the C/SiC composite with a much higher velocity than the mode.
Fig. 10Displacement field of AE wave propagation in the fiber. The excitation times are 200 μs, 400 μs and 500 μs respectively.
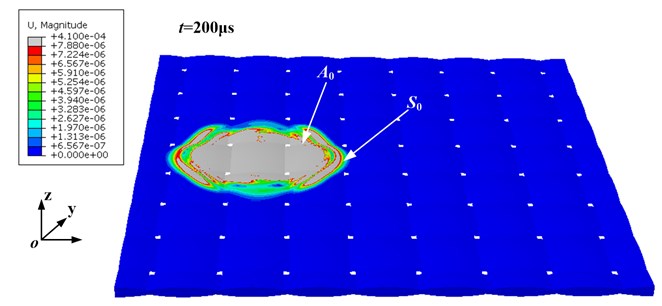
a)
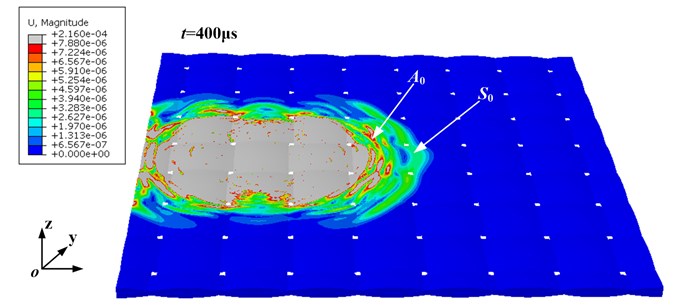
b)
c)
3. Experiment on C/SiC plate
To validate the AE simulation, we performed AE tests on a 5 mm thick specimen of C/SiC. One AE sensor was placed on the plate. The pencil lead breaking (PLB) experiment was carried out on a C/SiC plate with the size of 30 mm wide, 150 mm length and 5 mm thick. Signals are recorded by full-waveform AE apparatus of type DS5, which is provided by Beijing Softland Co., Ltd. The sampling frequency in tests is 10 MHz. The pencil lead was broken on the top surface of the C/SiC plate, and the AE signals are generated. The AE sensor is used to pick up the AE signal propagating in the structure. And then the AE signals are amplified by the preamplifier. One computer is used to record those AE signals. With the help of signal processing software, you can display the total AE signal.
During the pencil lead breakage of the experiment, the crackage point was 100 mm away from the detection position. The simulation is carried out with the same configuration which used in the experiment. And the pencil lead breaking experiment was followed the reference [34]. Due to the reason of the excitation mode, the energy of mode wave is much higher than S0 mode, which was decided by the character of the monopole source. The mode wave can be seen clearly in the simulation signals, which was displayed in Fig. 11. However, the mode wave was not clear in the experiment signals which were caused by the noise, which was shown in Fig. 11. This phenomenon of AE wave propagation in composite obtained by experiment and finite element method can be seen in some references such as [34, 35, 39].
Fig. 11AE signals obtained by simulation and experiment
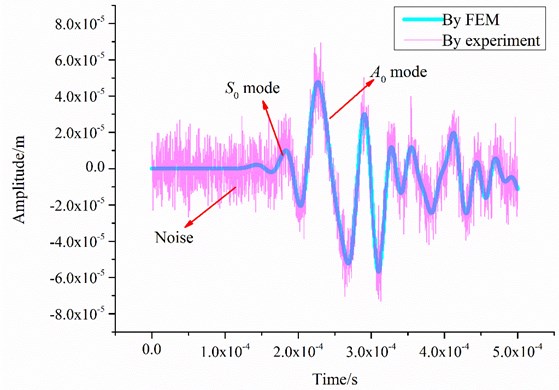
Therefore, the AE wave behavior can be well investigated by finite element method. Besides, by comparing these two AE signals in time domain, it can be found that some noise was contained in the signals obtained by experiment. However, these two waveforms are similar. Modeling of AE displacement signals can conveniently provide high signal-to-noise ratio modeled data that can be used to develop useful advanced signal processing and analysis techniques, which one could apply to real AE data. This modeling approach compared to working with real AE signals has the huge advantage that for each AE event the researcher knows exactly the source location, source type, source orientation, and source time history of the AE signal. Therefore, the noise was not removed for the original AE signals obtained from the experiment. And also, the role of noise is to illustrate the importance of FEM in AE research field.
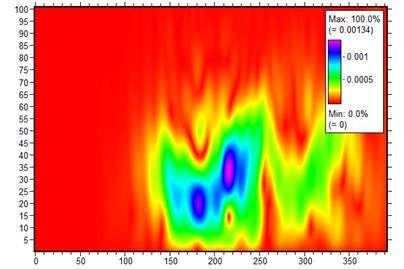
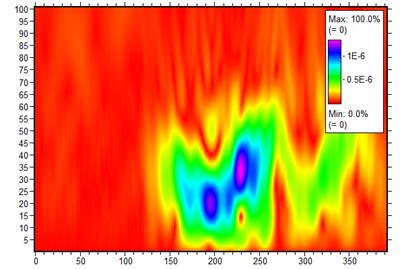
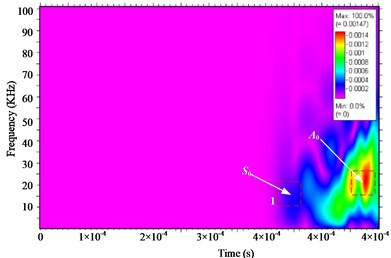
Additionally, to visualize the modal composition of the AE signals the Choi-Williams transformation is calculated using the software package AGU-Vallen Wavelet [26]. The signals obtained through FE simulation are transformed and the result is shown in Fig. 12(a), while the signals of pencil lead broken test is shown in Fig. 12(b). From these two figures it can be found that at low frequencies the dominance of the asymmetric mode on the surface of the plate is higher when compared to the symmetric mode.
From Fig. 12(a) we can see that the AE signal has trailing train of pulse. Upon analysis of the AE signal, we found that these AE signals consist of two main bands of frequencies, around 20 kHz and 35 kHz (Fig. 12(b)).
Fig. 12WT results for an isotropic plate: a) simulation; b) experiment
a)
b)
4. Attenuation of AE signals propagation in C/SiC plate
To further understand the AE signal propagation characteristic in C/SiC plate, this section aims to analyze the attenuation of AE signals. Four different test points are arranged in the matrix, which are used to obtain the AE signals. Fig. 13 shows the waveforms in time domain of the AE signals tested by the four AE sensors. It can be found that there are time differences among the four sensors since the distance between AE source and the sensors are not the same.
Fig. 13AE signals with variation distance between sensor and source
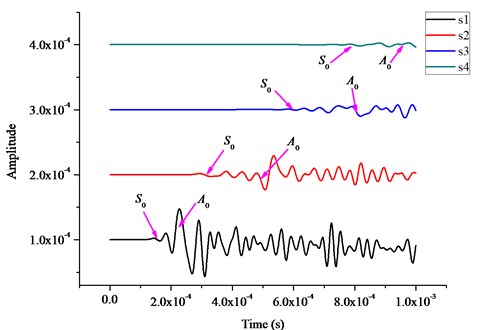
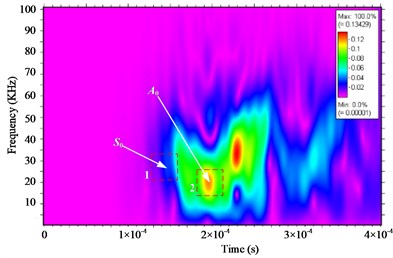
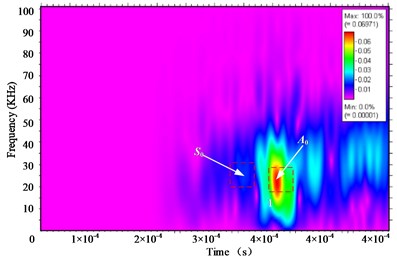
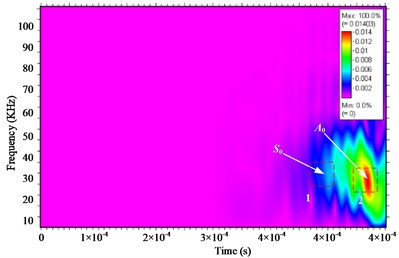
In addition, you can clearly see that the amplitude of four acoustic emission signal increases as the propagation distance increases. Fig. 14 displays the energy distribution of the AE signals shown in Fig. 13. Table 1 shows the comparison area, region 2 intensity, discovery zones 1, 2 energy regions with increasing propagation distance decreases, but the ratio between the two is substantially constant. To make the attention of AE signals propagation in C/SiC plate clearer, the energy ratio results are summarized in Fig. 15.
As shown in Fig. 15, the intensity ratio of the two AE sources is attenuated with increasing distance. Besides, the intensity ratio of the AE source in -axis direction is higher than the -axis direction. For the characteristic of attenuation principle, the intensity ratio of the attenuation is substantially the same for both the AE source in -axis direction and -axis direction. But from 100 mm to 140 mm the intensity attenuation ratio of AE signals generated along the -axis is larger than the -axis. The analysis result shows that this phenomenon is caused due to difference between the energy radiation field of AE source along the axis and -axis, which resulting in the sharply attenuation of the energy in region 2 when the propagation distance increases. The results show that although the intensity ratio of these two types of AE sources are all decreased with increasing distance, these apparent differences in the propagation can be used to distinguish different types of AE sources.
Fig. 14Energy of the AE signals with variation distance
a)
b)
c)
d)
Fig. 15Influence of the propagation distance on AE signals
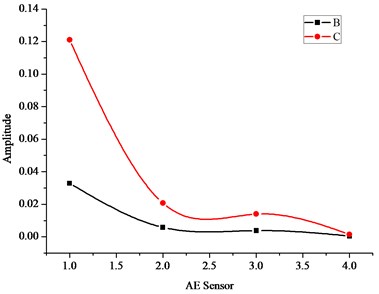
Table 1Energy of two zones for the four AE sensors
Section 1 | Section 2 | Ratio | |
s1 | 0.0329 | 0.121 | 0.272 |
s2 | 0.00579 | 0.0207 | 0.279 |
s3 | 0.00372 | 0.0139 | 0.268 |
s4 | 0.000434 | 0.00146 | 0.297 |
5. Conclusions
By analyzing the simulation results of AE wave propagation in C/SiC composite, some conclusions are drawn as following.
1) The typically C/SiC composite microstructure proposed in this paper can be effectively used for the research investigation of AE wave propagation. Abundant information about the AE characteristics can be obtained by carrying out the AE simulation. For the C/SiC composite the behaviors of AE wave in the matrix is much the same as the wave propagating in the fiber. And there are is a variety of modes are contained in the AE waves. The AE wave can be well propagating in the woven fibrous structure without gaps in the whole wave field. Besides, the propagation way is not affected by the geometric section of the fiber and the contacting area between the fiber and matrix. The mode contained in the AE wave propagates in the C/SiC composite with a much higher velocity than the mode does.
2) The AE wave can be well propagating in the woven fibrous structure without gaps in the whole wave field. Besides, the propagation is not affected by the geometric section of the fiber and the contacting area between the fiber and matrix. The mode contained in the AE wave propagates in the C/SiC composite with a much higher velocity than the mode does.
3) The AE signals can be well used to present the failure mechanisms of C/SiC composite. Some significant factors should be considered, such as the excitation times, force direction and force magnitudes. Besides, a systematic variation of the employed model source results in significant changes in the frequency distribution, especially in the case of fiber breakage. Nevertheless, the frequency spectra obtained are dominated by the type of microscopic failure and can be classified accordingly by appropriate frequency based parameters.
References
-
Breede F., Koch D., Maillet E., et al. Modal acoustic emission of damage accumulation in C/C-SiC composites with different fiber architectures. Ceramics International, Vol. 41, Issue 9, 2015, p. 12087-12098.
-
Schmidt S., Beyer S., Immich H., et al. Ceramic matrix composites: a challenge in space-propulsion technology applications. International Journal of Applied Ceramics Technology, Vol. 2, Issue 2, 2005, p. 85-96.
-
Breede F., Jemmali R., Voggenreiter H., et al. Design and testing of a C/C-SiC nozzle extension manufactured via filament winding technique and liquid silicon infiltration. Design, Development, and Applications of Structural Ceramics, Composites, and Nanomaterials: Ceramic Transactions, Vol. 244, 2014, p. 1-14.
-
Rivers H., Glass D. Advances in hot structure development. Thermal Protection Systems and Hot Structures, 2006.
-
Corso J. D., Cheatwood B., et al. Advanced high-temperature flexible TPS for inflatable aerodynamic decelerators. AIAA Aerodynamic Decelerator Systems Technology Conference and Seminar, Reston, 2011, p. 139-161.
-
Brewer Amy R. Edgewise Compression Testing of STIPS-0 (Structurally Integrated Thermal Protection System). Technical Report, NASA/CR-2011-217161, 2011.
-
Zhu D., Halbig M., Jaskowiak M., et al. Property evaluation and damage evolution of environmental barrier coatings and environmental barrier coated SiC/SiC ceramic matrix composite sub-elements. 38th Annual Conference on Composites, Materials and Structures, 2014.
-
Melis M., Carney K., Gabrys J., et al. A summary of the space shuttle Columbia tragedy and the use of ls dyna in the accident investigation and return to flight efforts. 8th International LS-DYNA Users Conference, 2004.
-
Gehman H. W., et al. Columbia Accident Investigation Board, Report Volume 1. U. S. Government Printing Office, Washington, DC, 2003.
-
Chang F., Markmiller J., Yang J., et al. Structural health monitoring. System Health Management: With Aerospace Applications, 2001, p. 419-428.
-
Smith C., Morscher G., Xia Z. Electrical resistance of SiC/SiC ceramic matrix composites for damage detection and life-prediction. 33rd International Conference on Advanced Ceramics and Composites, 2009.
-
Wells R., Hamstad M., Mukherjee A. On the origin of the first peak of acoustic emission in 7075 aluminum alloy. Journal of Material Science, Vol. 18, 1983, p. 1015-1020.
-
Sause M., Horn S. Simulation of lamb wave excitation for different elastic properties and acoustic emission source geometries. Journal of Acoustic. Emission, Vol. 28, 2010, p. 142-154.
-
Lin L., Chu F. HHT-based AE characteristics of natural fatigue cracks in rotating shafts. Mechanical Systems and Signal Processing, Vol. 26, 2012, p. 181-189.
-
Wang Q., Chu F. Experimental determination of the rubbing location by means of acoustic emission and wavelet transform. Journal of Sound and Vibration, Vol. 248, Issue 1, 2001, p. 91-103.
-
Kundu T., Das S., Martin S. A., et al. Locating point of impact in anisotropic fiber reinforced composite plates. Ultrasonics, Vol. 48, Issue 3, 2008, p. 193-201.
-
William P., Michael G., Eric M. Acoustic Emission Detection of Impact Damage on Space Shuttle Structures. Langley Research Center Report for NASA, 20040171467, 2004.
-
Waller J. M., Nichols C. T., Wentzel D. J., et al. Use of modal acoustic emission to monitor damage progression in carbon fiber/epoxy and implications for composite structures. AIP Conference, American Institute of Physics, 2011, p. 919-926.
-
Rosa I., Santulli C., Sarasini F. Acoustic emission for monitoring the mechanical behaviour of natural fibre composites: a literature review. Composites Part A, Vol. 40, Issue 2, 2009, p. 1456-1469.
-
Appleby M., Morscher G., Zhu D. Damage characterization of EBC-SiC ceramic matrix composites under imposed thermal gradient testing. 38th International Conference and Exposition on Advanced Ceramics and Composites, 2014.
-
Morscher G., Gyekenyesi A. The velocity and attenuation of acoustic emission waves in SiC/SiC composites loaded in tension. Composites Science and Technology, Vol. 62, Issue 9, 2002, p. 1171-1180.
-
Groot P., Wijnen P., Janssen R. Real-time frequency determination of acoustic emission for different fracture mechanisms in carbon/epoxy composites. Composites Science and Technology, Vol. 55, Issue 4, 1995, p. 405-412.
-
Yuris A. D., Qian J. Analysis of microdamage evolution histories in composites. International Journal Solids and Structures, Vol. 38, Issues 10-13, 2001, p. 1831-1854.
-
Morscher G. Modal acoustic emission of damage accumulation in a woven SiC/SiC composite. Composites Science and Technology, Vol. 59, Issue 5, 1999, p. 687-697.
-
Maillet E., Godin N., R’mili M., et al. Analysis of Acoustic Emission energy release during static fatigue tests at intermediate temperatures on ceramic matrix composites: towards rupture time prediction. Composites Science and Technology, Vol. 72, Issue 9, 2012, p. 1001-1007.
-
Maillet E., Baker C., Morscher G., et al. Feasibility and limitations of damage identification in composite materials using acoustic emission. Composites Part A, Vol. 75, 2015, p. 77-83.
-
Maillet E., Morscher G. Waveform-based selection of acoustic emission events generated by damage in composite materials. Mechanical Systems and Signal Processing, Vols. 52- 53, 2015, p. 217-227.
-
Thomson W. Transmission of elastic waves through a stratified solid medium. Journal of Applied Physics, Vol. 21, Issue 2, 1950, p. 89-93.
-
Haskell N. The dispersion of surface waves on multilayered media. Bulletin of the Seismological Society of America, Vol. 42, Issue 4, 1953, p. 86-103.
-
Lowe M. Matrix techniques for modeling ultrasonic waves in multilayered media. IEEE Transactions on Ultrasonics Ferroelectrics and Frequency Control, Vol. 42, Issue 4, 1995, p. 525-542.
-
Kundu T., Mal A. Elastic waves in a multilayered solid due to a point source. Wave Motion, Vol. 7, Issue 5, 1995, p. 459-471.
-
Moser F., Jacobs L., Qu J. Modeling elastic wave propagation in waveguides with the finite element method. NDT&E International, Vol. 32, Issue 4, 1999, p. 225-234.
-
Fan Z., Lowe M., Castaings M., et al. Torsional waves propagation along a waveguide of arbitrary cross section immersed in a perfect fluid. Journal of the Acoustical Society of America, Vol. 124, 2002, p. 4-2008.
-
Sause M., Hamstad M., Horn S. Finite element modeling of lamb wave propagation in anisotropic hybrid materials. Composites Part B: Engineering, Vol. 53, Issue 7, 2013, p. 249-257.
-
Sause M., Hamstad M., Horn S. Finite element modeling of conical acoustic emission sensors and corresponding experiments. Sensors and Actuators A Physical, Vol. 184, Issue 1, 2012, p. 64-71.
-
Ahmad Z. A. B., Gabbert U. Simulation of lamb wave reflections at plate edges using the semi-analytical finite element method. Ultrasonics, Vol. 52, 2012, p. 815-820.
-
Mickael B. Efficient Finite Element Modeling of Ultrasound Waves in Elastic Media. Ph.D. Thesis, Imperial College London, 2004.
-
ABAQUS v6.11-1. Analysis User’s Manual, 2010.
-
Sause M., Horn S. Simulation of acoustic emission in planar carbon fiber reinforced plastic specimens. Journal of Nondestructive Evaluation, Vol. 29, Issue 2, 2010, p. 123-142.
-
Sause M., Horn S. Simulation of lamb wave excitation for different elastic properties and acoustic emission source geometries. Journal of Acoustic Emission, Vol. 28, Issue 1, 2010, p. 109-121.
-
Bartoli I., Scalea F., Fateh M., et al. Modeling guided wave propagation with application to the long-range defect detection in railroad tracks. NDT and E International, Vol. 38, Issue 5, 2010, p. 325-334.
-
Xiao D., He T., Pan Q., et al. A novel acoustic emission beamforming method with two uniform linear arrays on plate-like structures. Ultrasonics, Vol. 54, Issue 2, 2014, p. 737-745.
-
Hamstad M., O’gallagher A., Gary J. Effects of lateral plate dimensions on acoustic emission signals from dipole sources. Journal of Acoustic Emission, Vol. 19, 2001, p. 258-274.
-
Xiao D., He T., Wang H., et al. Numerical prediction of temperature effect on propagation of rubbing acoustic emission waves in a thin-walled cylinder structure. Journal of Vibroengineering, Vol. 17, Issue 6, 2015, p. 3354-3368.
-
Xiao D., He T., Liu X., et al. Efficient simulation of acoustic emission with reflections removal based on infinite element and Rayleigh damping. International Mechanical Engineering Congress and Exposition. American Society of Mechanical Engineers, 2013.
-
Vallen Systeme GmbH (Munich, Germany). Aoyama Gakuin University, AGU-Vallen Wavelet, 2010.
-
Hamstad M., Gary J. A wavelet transform applied to acoustic emission signals: Part 1: Source identification. Journal of Acoustic Emission, Vol. 20, 2014, p. 62-82.
About this article

This work was finically supported by the National Science Foundation of China (Grant No. 51605459). We thank Professor Shuguang Li from University of Nottingham for lots of valuable discussions.
