Abstract
In this work, three types of measures, i.e., 1) adding the damping adhesive, 2) changing the local beads and 3) utilizing the dynamic vibration absorber (DVA), are performed to investigate and improve the acoustic quality of the minivan’s interior noise. For adding the damping adhesive, the difference of the adhesive location directly affects the mode of minivan’s roof. For changing the local beads, eight cases of beads are selected. The results indicate that the change trend of the first natural frequency is parabolic as the number of beads increases. For adding the 33 Hz DVA, the results show that the sound pressure levels (SPLs) of the minivan’s response points located at the front, middle and rear seat in the critical frequency are approximately reduced by 2.1 dB, 1.5 dB and 1.1 dB in the minivan’s simulation, and by 2.6 dB(A), 1.4 dB(A) and 2.7 dB(A) in the minivan’s road experiment, respectively. By contrast, the DVA with a certain frequency should be chosen if the reduction of sound pressure level (SPL) is only considered. Furthermore, if the SPL’s reduction and the additional mass are taken into account at the same time, the measure with local flatted beads should be selected. The obtained results could provide a certain practical guiding significance for improving the mode and interior noise of minivan’s roof.
1. Introduction
The noise of the automotive in the audible range of 30-300 Hz frequency is primarily derived from the resonances of engine and body [1]. Generally, the passenger compartment made out of thin sheet is extracted as the interior cavity. The excitation from engine and road would be introduced into the interior cavity through the chassis and body panels, thus the noise and vibration would be formed. In addition, the interior noise and vibration of automobile may be determined by either the excitation resources or body panels’ vibration radiation. Therefore, the study of body panels’ vibration performance is very meaningful to reduce the noise and vibration of interior body structure. Compared with the sedan [2-16], the minivan is generally consisted of engine and passenger compartment without the trunk compartment. Since the longitudinal dimension of minivan’s roof is larger, the interior noise of the cavity area is obviously affected by the roof. Therefore, the minivan’s roof should be analyzed as the typical component to reduce the interior noise.
The research point of the published literatures about the roof focused mainly on the crush countermeasure [15], mode [12, 18], vibration [19-21], aerodynamic [22, 23] and noise frequency response [9, 10], and so on. Zheng et al. [12] compared the modal datum of flat panel and bead-stiffened flat panel. It was found that the natural frequency of the simplified roof increased with the increase of bead width and height. However, it did not pay more attention to the relationship between the mode and the number of the beads. The parameters affecting the roof performance contained the roof curvatures [24], the stiffening ribs [12, 27] and the additional damping material [2, 6, 9, 16]. Fusano et al. [27] proposed a simple methodology to design an optimal layout of reinforcement ribs in the presence of technological constraints. In terms of the types of vehicle’s roof, mostly research mainly focused on the sedan and the train, and even some simple structures such as the cylinder, the box and the simplified plate. However, few works are carried out about interior noise of the minivan’s roof [28].
On the basis of the above literatures, the improvement measures to reduce the interior noise of the minivan such as flatting the local bead, adding damping adhesive or dynamic vibration absorber (DVA), are not described apparently. To solve the problem, the finite element method (FEM) is firstly applied to analyze the mode of the roof assembly and the roof part models. And the corresponding natural frequencies and mode shapes are generated. Secondly, the modal rule of the roof model is obtained by contrasting the changing of bead, local flatted bead, damping adhesive, and dynamic vibration absorber (DVA). It would present some reasonable improvement measures. Finally, the proposed measures are proved to be effective through the road tests of the minivan.
2. Problem description
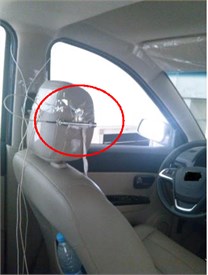
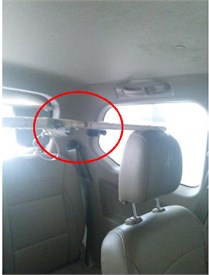
In order to obtain the sound pressure levels (SPLs) of minivan’s interior noise, the experiment is implemented based on the noise transfer function (NTF) method. The three microphones are installed at the driver’s right ear position, the middle positions of middle seat and rear seat, respectively. They would be as the response frequency points (see Fig. 1). The test road is an asphalt road under the condition of calm wind, standard friction coefficient and silent circumstance. The exterior noise effects on the test results are also controlled. Table 1 and Fig. 2 show the main experimental devices.
Fig. 1The microphones’ positions for the minivan noise test
a)
b)
c)
Table 1Main experimental devices
No. | Devices’ name |
1 | Data acquisition devices |
2 | power supply devices |
3 | Microphones |
4 | Sound level calibrator |
Since there are four cylinders in the minivan’s engine, the contribution of the second order SPLs is greatest to the SPLs of frequency response points. The rotate speeds (900 rpm-1200 rpm) of the engine could be converted to excitation frequency values (30 Hz-40 Hz) with Eq. (1):
where is the engine speed, and is the corresponding frequency.
The SPLs at three frequency response points are measured and shown in Fig. 3. Obviously, there are different critical frequencies for different frequency response points at third gear. However, the values generally locate between 30 Hz and 40 Hz, which affects the comfort of the driver and passengers. Therefore, it is necessary that the interior noise should be controlled in this range. Note that the SPL is as a specific unified evaluation index [3, 24], and A-weighting sound level is applied in the SPLs of frequency response points.
Fig. 2Main experimental devices

a) Data acquisition devices

b) Power supply devices
c) Sound level calibrator
Fig. 3Minivan’s benchmark SPLs at third gear
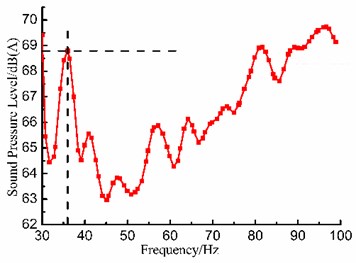
a) Front seat
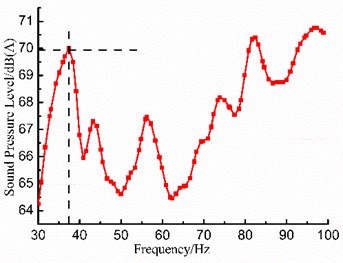
b) Middle seat
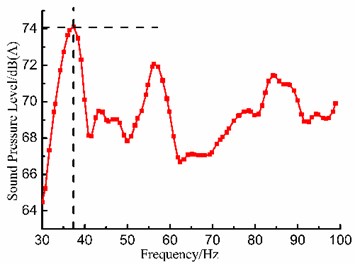
c) Rear seat
3. Boundary condition
The standard air properties contain the density ( 1.255 kg/m3) and the speed ( 340 m/s). By means of the above data, the equivalent properties of the relevant modeling parameters are shown in Table 2.
Table 2Equivalent properties of the parameters (ρ0, ν0 – standard air properties)
Item | (MPa) | / | / | ||
Panel | 210.000 | 0.3 | 6.047 | – | – |
Damping adhesive | 1.400 | 0.49 | 1.047 | 0.3 | – |
According to the modal experiment of body-in-white (BIW) in Fig. 4, the natural frequencies can be obtained. Table 3 shows modal experiment data of the minivan’s BIW. The second and third modes of minivan’s BIW are the first and second modes of the roof part. The corresponding natural frequencies are 32.39 Hz and 38.99 Hz, respectively. Therefore, the two frequencies should be paid more attention to in the following modal analysis of the roof assembly and the roof part.
Fig. 4Modal experiment of BIW
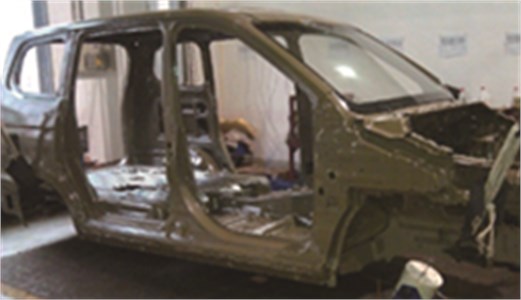
Table 3Modal experiment data of the minivan’s BIW
Modal order | Natural frequency / Hz | Description |
1 | 28.78 | Rhombic deformation in the tail gate |
2 | 32.39 | First mode in the roof |
3 | 38.99 | Second mode in the roof |
4 | 42.96 | BIW torsional mode |
5 | 51.56 | local deformation in the left side panel |
The minivan model contains the trimmed body, chassis and cavity in Fig. 5(a). It has 3096 1-D elements, 1101497 2-D elements, 560509 3-D elements and 71375 connections. The element number of minivan’s model is so large that the simulation time is very long. Therefore, at the engineering analysis process, the roof assembly model is generally extracted from the BIW model to enhance the efficiency of modal analysis. If the analysis strategy of the roof assembly model is effective for improving the mode, it would be further applied into the body model. Fig. 5(b) gives the roof assembly model which is cut directly from the BIW model. Thus, it mainly contains roof, roof cross beams, and the cut-off part of A-pillar, B-pillar, C-pillar, and D-pillar. Specially, three factors should be emphasized at the cutting process. Firstly, the incomplete weld points should be eliminated when the roof model is cut off. Secondly, the six freedoms of the cut-off positions for A-D pillars should be constrained. Thirdly, the modal results would be defined in the former 20 orders. For the numerical model of the roof assembly, there are 91877 2-D elements, 2095 3-D elements, 8230 connections. In this work, the roof part Fig. 5(c) is also extracted from the BIW model to implement the modal analysis. The roof part model has 28992 2-D elements. Based on the workstation computing capacity of 6 core and 12 threads CPU, and 48 G RAM, the computation times of the minivan, the roof assembly model and the roof part model are approximately 2 hours, 2 min and 25 seconds, respectively.
Fig. 5The finite element model
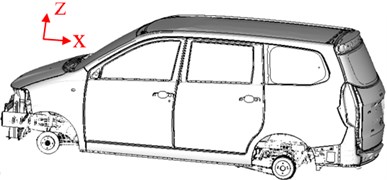
a) Minivan
b) Roof assembly
c) Roof part
The benchmark models of the roof assembly and the roof part all have 5 beads and 4 pieces of damping adhesive. In order to obtain the change trend of the roof mode, they are modeled and simulated with different number of the roof beads (0-7) based on the modal analysis. To reduce the SPLs of the minivan’s interior noise near the critical frequencies, three improvement measures, including the local flatted beads, the damping adhesive, and the DVA, are performed and compared by using of the above roof models Table 4.
Table 4Multi-parameters setup on the roof beads (yes-Y, no-N)
Case | Bead number | Damping adhesive | Local flatted beads | DVA |
1 | 0 | Y/N | Y/N | Y/N |
2 | 1 | Y/N | Y/N | Y/N |
3 | 2 | Y/N | Y/N | Y/N |
4 | 3 | Y/N | Y/N | Y/N |
5 | 4 | Y/N | Y/N | Y/N |
6 | 5 | Y/N | Y/N | Y/N |
7 | 6 | Y/N | Y/N | Y/N |
8 | 7 | Y/N | Y/N | Y/N |
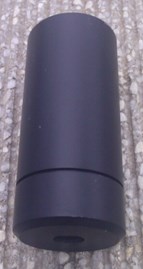
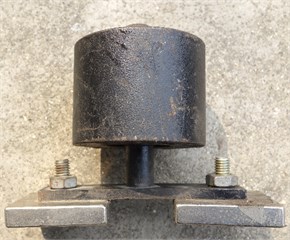
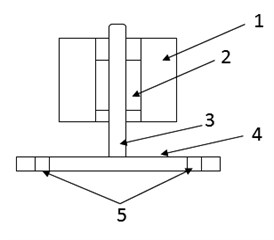
Fig. 6DVA: a) entity, b) sketch map: 1 – mass box, 2 – damping spring, 3 – connective stick, 4 – pedestal, 5 – installing holes
a)
b)
In particular, the capital letter Y means that one of the improvement measures would be applied to the model, but the capital letter N means the opposite condition. For purpose of changing the energy distribution of the roof, three improvement measures are performed through changing the beads’ geometry structure, adjusting the local roof damping, and absorbing the local roof vibration, respectively. The DVA geometry structure is specially designed and manufactured like Fig. 6(a), and its dimension is 125 mm×45 mm×95 mm. Fig. 6(b) shows that the main components of the DVA are mass box, damping spring, connective stick, pedestal and installing holes, respectively. The DVA could be expressed as a mass-spring model in the simulation analysis. The main parameters of DVA are listed in Table 5.
Table 5DVA parameters
DVA types | Mass / kg | Hardness / HD | Material | Dynamic stiffness / N/m |
33 Hz | 1 | 37 | EPDM | 43 |
48 Hz | 1 | 50 | EPDM | 91 |
55 Hz | 1 | 55 | EPDM | 120 |
4. Modal analysis results
The modal analysis of the minivan is simulated, and the main vibration panels are obtained and listed in Fig. 7 based on the mode shape of 33 Hz natural frequency. Fig. 7 shows that the engine hood, front door inner panel and roof are the most significant factor to cause the vibration of the minivan in the 33 Hz natural frequency. Among the three types of panels, the engine hood is not the panel to form the interior cavity. The roof is much larger than the front door inner panel, and is easy to be tested in the road experiment of the minivan. Therefore, the roof is chosen as the research object of this work to reduce the interior noise of the minivan.
Fig. 7The mode shape plot
a) Engine hood
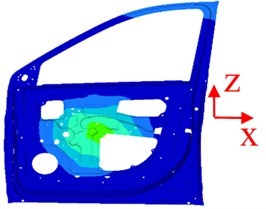
b) Front door inner panel
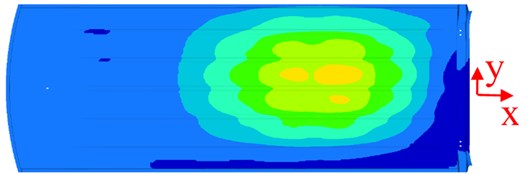
c) Roof
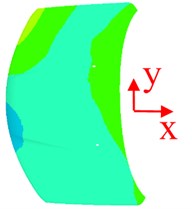
The first mode of a structure is the main mode, and it determines the modal distribution of the structure. Therefore, the first mode of a structure is greatly significant in the modal analysis. Fig. 8 shows the mode shape of first natural frequencies (36.53 Hz and 23.63 Hz) for the roof assembly and the roof part, respectively. The reason of the generated discrepancy lies in that the roof assembly is connected by the cross beams and the body frames, but the roof part is only limited by the boundary constraints (see Fig. 5). Since the curvature of the rear part is much smaller than that of the front part, the maximum displacements appear near the fifth cross beam. Therefore, the location of the fifth cross beam would be very important for analyzing the model and reducing the interior noise.
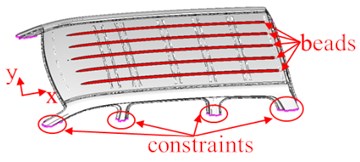
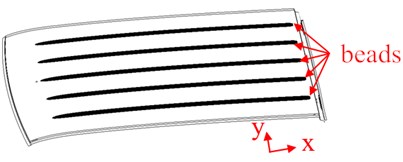
Fig. 9 shows the improvement measures implemented on the roof assembly and the roof part models. According to Fig. 9(a), the damping adhesives with 240 mm×306 mm are added on the four different positions (a, b, c, and d) near the fifth cross beam. In addition, the flatted beads whose width is 80 mm along the -direction of the roof are located near the fifth cross beam Fig. 9(b). Besides, Fig. 9(c) also provides the different types of DVA added on the maximum vibration area near the fifth cross beam. Note that the DVA could be equivalent with a mass-spring model based on Fig. 6. Especially, the dimension of the mass-spring model is 125 mm×45 mm×95 mm, and the relevant parameters are shown in Table 5.
Fig. 8The mode shape plot
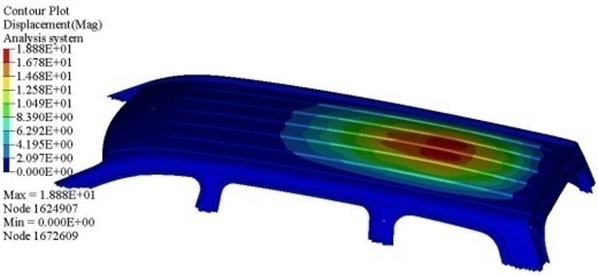
a) Roof assembly
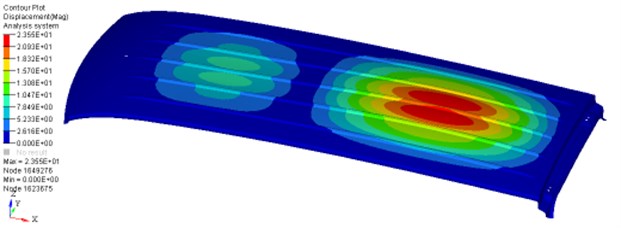
b) Roof part
Fig. 9The improvement measures on the roof
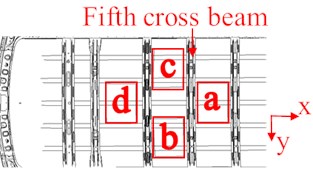
a) The damping adhesive
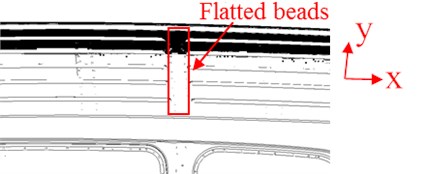
b) The local flatted beads
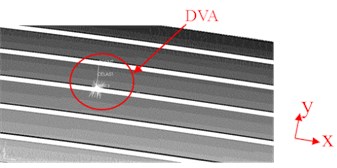
c) The DVA
The different position cases of damping adhesives added near the fifth cross beam of the roof are simulated and compared about the natural frequencies. The corresponding results are summarized in Table 6 and Fig. 10(a). The results show that the natural frequencies decrease with the increasing of the beads number. Then, there is an inflection point until five beads regardless of the number of the damping adhesives. Furthermore, it is shown that the case with 4 position adhesives is better than other cases (see Fig. 10(b)) when the five beads are performed. The reason is that the case of 4 position adhesives provides the much higher local stiffness than others.
Table 6The cases explanation
Cases | Fort short | Cases | Fort short |
no adhesive | no_ad | c position adhesive | c_pos |
a position adhesive | a_pos | d position adhesive | d_pos |
b position adhesive | b_pos | 4 positions (a, b, c and d) adhesive | 4_pos |
Fig. 10Natural frequency with different position damping adhesives
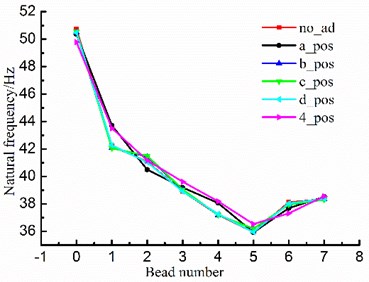
a) Integrated curves
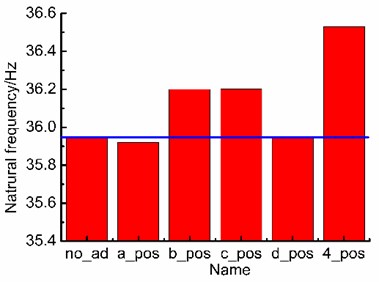
b) Bar graph with five beads
4.1. Effects of the damping adhesive and local flatted beads
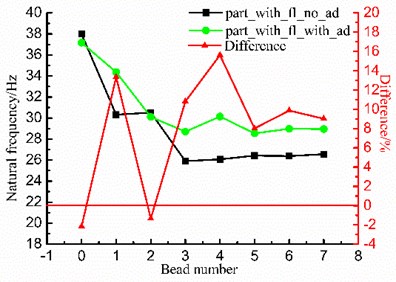
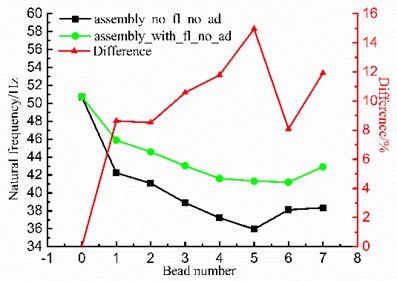
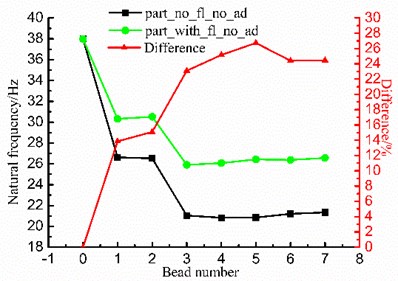
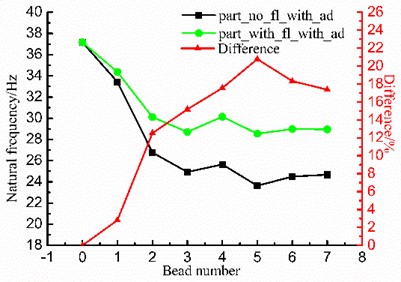
Based on different boundary conditions of the local flatted beads and the damping adhesives, four cases are considered herein, i.e., no local flatted beads and no damping adhesive, no local flatted beads and with 4 damping adhesives, with local flatted beads and no damping adhesive, with local flatted beads and with 4 damping adhesives. Fig. 11 illustrates the first natural frequencies of the four groups decrease with an increase of the beads until the 5 or 6 beads appear. The main reason is that the increasing of the beads would decrease the global stiffness. However, when the number of the beads is up to the critical value, the global stiffness would increase again and subsequently cause an increase of the natural frequency. In addition, it is shown in Fig. 11(a) that the measure of flatting the local beads could obviously increase the natural frequencies of the roof assembly. Meanwhile, the measure of adding the damping adhesive can also enhance the natural frequencies, but its increasing amplitudes are smaller than the former’s.
To clearly show the change trend and compare the differences, Fig. 11 would be separated into four detailed plots (Figs. 12-15). The results of the difference are calculated through Eq. (2) as follows:
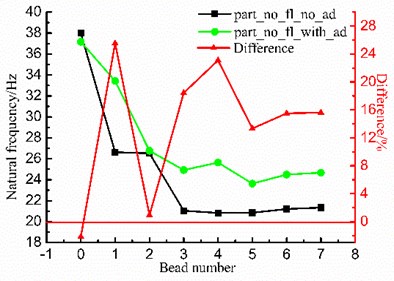
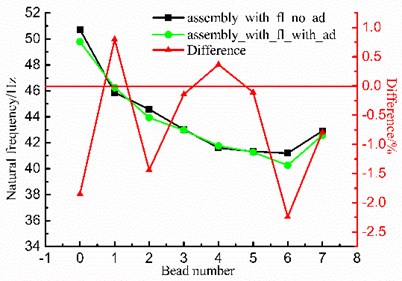
Figs. 12-13 show that it is a little useful to promote the first natural frequencies through adding the damping adhesives like Fig. 9(a) for the roof assembly and the roof part. The Fig. 12(a) shows that the parameters “difference” have six positive and two negative values. It indicates that the measure of adding the damping adhesives is effective in most cases. Since the damping adhesives added on the maximum vibration areas could change the local damping and vibration. According to Figs. 14-15, it is found that the measures by flatting the local beads like Fig. 9(b) could increase the first natural frequencies of the roof. The first reason is that the differences by flatting the local beads are all positive, but some of the differences are negative for the measures by adding the damping adhesives. Therefore, the improvement measure by flatting the local beads is better than that by adding the damping adhesives. Furthermore, another reason is that the local flatted beads could disrupt the original beads continuity, and it is an equivalence to be ribbed oppositely.
Fig. 11First natural frequency of different cases
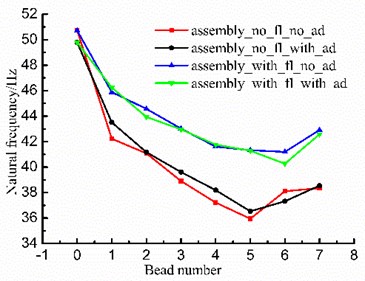
a) Roof assembly
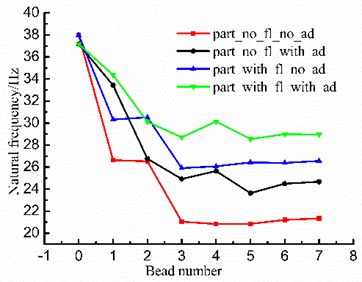
b) Roof part
Fig. 12First natural frequency and difference without the local flatted beads and with the damping adhesive or not
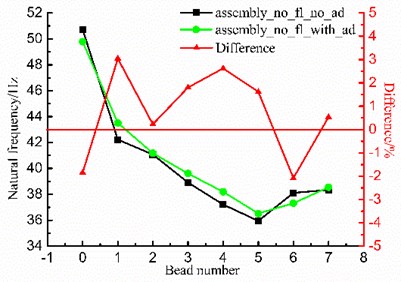
a) Roof assembly
b) Roof part
Fig. 13First natural frequency and difference with the local flatted beads and with the damping adhesive or not
a) Roof assembly
b) Roof part
Fig. 14First natural frequency and difference with the local flatted beads or not and without the damping adhesive
a) Roof assembly
b) Roof part
Fig. 15First natural frequency and difference with the local flatted beads or not and with the damping adhesive
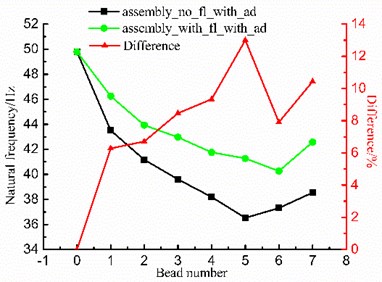
a) Roof assembly
b) Roof part
Table 7The cases explanation
Cases | Fort short | Local flatted beads | Damping adhesive |
No local flatted beads, and no damping adhesive | no_fl_no_ad | 0 | 0 |
No local flatted beads, and with 4 damping adhesives | no_fl_with_ad | 0 | 1 |
With local flatted beads, and no damping adhesive | with_fl_no_ad | 1 | 0 |
With local flatted beads, and with 4 damping adhesives | with_fl_with_ad | 1 | 1 |
4.2. Effects of the DVAs
Three types of DVAs with 33 Hz, 48 Hz and 55 Hz are considered herein. According to Fig. 16, the DVA with 33 Hz is better than the DVAs with 48 Hz and 55 Hz for reducing the first natural frequencies of the roof assembly and the roof part under the conditions of different beads number. The reason is that the frequency differences between the 33 Hz DVA measure and the benchmark measure are the largest ones. Therefore, it is beneficial to absorb the roof vibration and avoid the resonance between the roof and the interior cavity.
To sum up, the first natural frequencies decrease with an increase of the beads number until up to 5 or 6 beads. The first mode could be promoted by adding the damping adhesives and flatting the local beads near the maximum vibration areas. Meanwhile, the first mode would be reduced by adding the DVAs. Therefore, the abovementioned improvement measures are helpful to change the mode of the roof and reduce the interior noise of the minivan.
Fig. 16First natural frequency of different cases
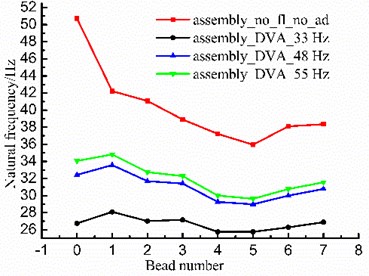
a) Roof assembly
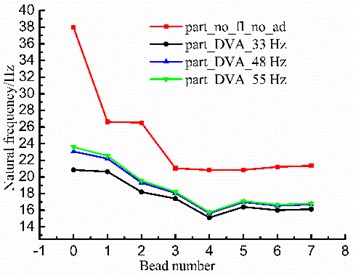
b) Roof part
5. Simulation and experiment validation
In order to validate the effectiveness of the above mentioned improvement measures, the simulation and experiment of minivan are implemented.
Fig. 17The SPLs of minivan model
a) Front seat
b) Middle seat
c) Rear seat
5.1. Simulation validation
When the DVAs (33 Hz, 48 Hz and 55 Hz) and the flatted beads are applied on the minivan’s model, the SPLs of front, middle and rear seat are simulated with the NTF method. The simulation time is about 3.5 hours with the above workstation. The SPLs’ reduction of front, middle and rear seat are listed in Figs. 17, 18 and Table 8.
Table 8The SPLs decreasing amplitudes of the critical frequencies between the benchmark and the improvement measures in the range of 30 Hz to 40 Hz for the minivan model
No. | Measures | Front seat | Middle seat | Rear seat |
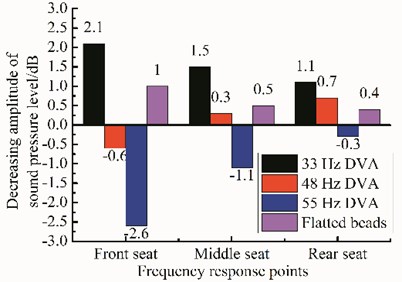
1 | 33 Hz DVA | 2.1 | 1.5 | 1.1 |
2 | 48 Hz DVA | –0.6 | 0.3 | 0.7 |
3 | 55 Hz DVA | –2.6 | –1.1 | –0.3 |
4 | Flatted beads | 1.0 | 0.5 | 0.4 |
The results indicate that the measures of the 33 Hz DVA and flatted beads are effective to reduce the interior noise of the minivan. Since the decreasing amplitudes of front, middle and rear seat SPLs are 2.1 dB, 1.5 dB and 1.1 dB respectively in the condition of the measure of the 33 Hz DVA, and those of front, middle and rear seat SPLs are 1.0 dB, 0.5 dB and 0.4 dB respectively in the condition of the measure of the flatted beads. However, the measures of the 48 Hz and 55 Hz DVAs are not applicable. The reason is that the negative decreasing amplitudes of SPLs appear. For example, the decreasing amplitudes of front seat in the condition of the measures of the 48 Hz and 55 Hz DVAs are –0.6 dB and –2.6 dB, respectively.
Fig. 18Decreasing amplitudes of SPLs on different frequency response points
5.2. Experiment validation
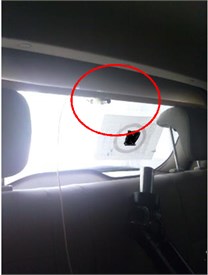
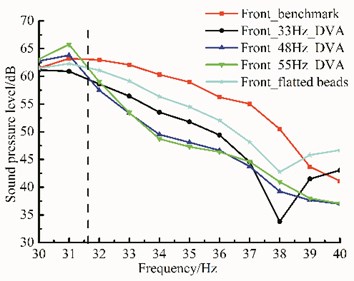
The SPLs of the minivan’s road experiments are further performed to demonstrate the effectiveness of the above NTF simulation analysis process. Herein, the improvement measures with the DVAs and the local flatted beads near the fifth cross beam of the roof are checked (Fig. 19). In particular, their dimensions are approximately 125 mm×45 mm×95 mm and 80 mm×36 mm×18 mm, respectively. Based on the benchmark in Fig. 3, the SPLs results could be compared in Fig. 20 through minivan’s road experiment.
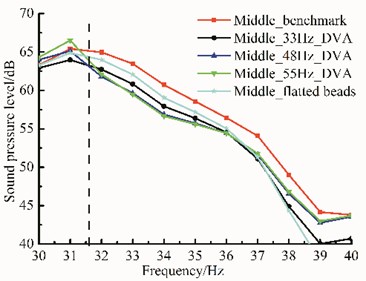
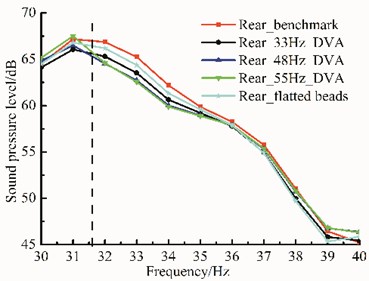
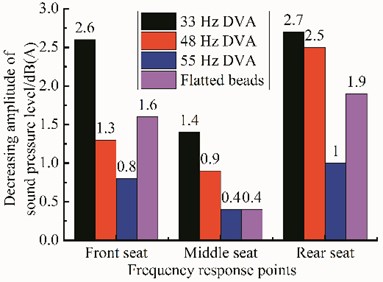
Additionally, the decreasing amplitudes between the benchmark and the improvement measures are also compared in Table 9 and Figs. 20-21. The comparison results show that the decreasing amplitudes of SPLs, for the frequency response points of front seat, middle seat, and rear seat, are 2.6 dB(A), 1.4 dB(A) and 2.7 dB(A) with 33 Hz DVA, 1.3 dB(A), 2.2 dB(A) and 2.9 dB(A) with 48 Hz DVA, and 0.8 dB(A), 0.4 dB(A) and 1.0 dB(A) with 55 Hz DVA, respectively. Therefore, the effects of the DVA with 33 Hz are better than those of the DVAs with 48 Hz and 55 Hz. The reason is that the frequency of 33 Hz DVA is much closer to the critical frequency than 48 Hz and 55 Hz DVAs. Moreover, for the measure of the local flatted beads, the SPLs of front seat, middle seat and rear seat are reduced by 1.6 dB(A), 0.4 dB(A), and 1.9 dB(A), respectively. It indicates that the measure of the local flatted beads is also effective. The main reason may be that the local flatted beads disrupt the original beads continuity and redistribute the energy of the roof.
Fig. 19The position of the DVA and the local flatted beads in the minivan’s road experiment
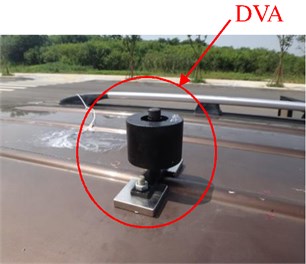
a) DVA
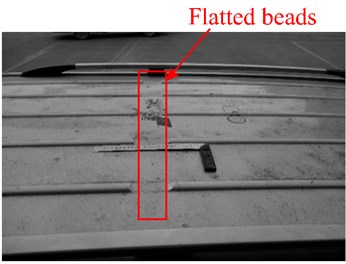
b) Local flatted beads
Fig. 20The SPLs of minivan’s road experiment
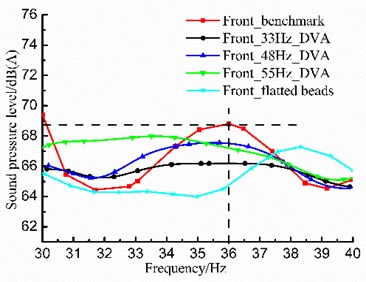
a) Front seat
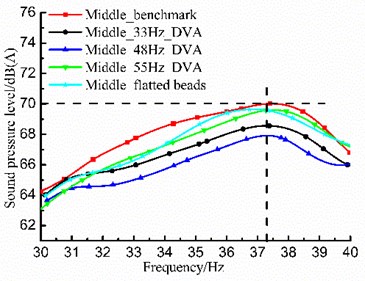
b) Middle seat
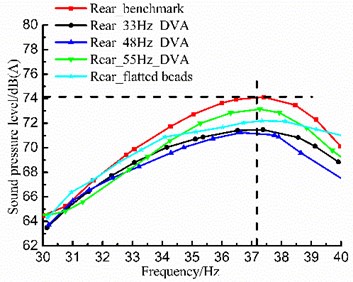
c) Rear seat
Table 9The SPLs decreasing amplitudes of the critical frequencies between the benchmark and the improvement measures in the range of 30 Hz to 40 Hz for the minivan’s road experiment
No. | Cases | Front seat | Middle seat | Rear seat |
1 | 33 Hz DVA | 2.6 | 1.4 | 2.7 |
2 | 48 Hz DVA | 1.3 | 2.2 | 2.9 |
3 | 55 Hz DVA | 0.8 | 0.4 | 1.0 |
4 | Flatted beads | 1.6 | 0.4 | 1.9 |
Based on the above minivan’s simulation and experiment results, the measures of the 33 Hz DVA and the local flatted beads are better than those of the 48 Hz and 55 Hz DVAs. Specifically, the SPLs’ reductions of the front, middle and rear seat with the 33 Hz DVA measure are larger than others in the critical frequency points. However, the additional mass of the 33 Hz DVA is also much larger than that of the local flatted beads. Therefore, the 33 Hz DVA measure should be chosen if the SPLs’ reduction is firstly considered. Furthermore, the local flatted beads measure should be selected if the SPL’s reduction and the additional mass are taken into account at the same time.
Fig. 21Decreasing amplitudes of SPLs on different frequency response points
6. Conclusions
In this work, the interior low frequency noise of a minivan is investigated and controlled by using the modal analysis and NTF methods. The roof, as one of the important panels to affect the critical frequency, is chosen to investigate the modal characteristics with the modal analysis. The following conclusions could be drawn from the work:
1) The finite element model of roof assembly and roof part is extracted from that of the minivan, and the modes of the above three models are simulated. Based on the numerical models, three types of measures, i.e., adding the damping adhesive, changing the local beads, and utilizing the DVA, are performed to investigate and improve the acoustic quality of the minivan’s interior noise. The SPLs’ results of the latter two measures are validated through minivan’s simulations and road experiments.
2) For adding the damping adhesive, the difference of the adhesive location directly affects the mode of minivan’s roof. In addition, with the measure of changing the local beads, eight cases of beads are selected. The results indicate that the change trend of the first natural frequency is parabolic as the number of beads increases.
3) For utilizing the 33 Hz DVA, the results show that the SPLs of the minivan’s response points located at the front, middle and rear seat in the critical frequency are approximately reduced by 2.1 dB, 1.5 dB and 1.1 dB in the minivan’s simulation, and 2.6 dB(A), 1.4 dB(A) and 2.7 dB(A) in the minivan’s road experiment, respectively. By comparison, the DVA with a certain frequency should be chosen if the reduction of SPL is only considered. Furthermore, if the SPL’s reduction and the additional mass are taken into account at the same time, the measure with local flatted beads should be selected. The obtained results could provide a certain practical guiding significance for improving the mode and interior noise of minivan’s roof.
References
-
Jha S. K. Characteristics and sources of noise and vibration and their control in motor cars. Journal of Sound and Vibration, Vol. 47, Issue 4, 1976, p. 543-558.
-
Botkin M. E. Modelling and optimal design of a carbon fibre reinforced composite automotive roof. Engineering with Computers, Vol. 16, Issue 1, 2000, p. 16-23.
-
Kang S. W., Lee J. M., Kim S. H. Structural-acoustic coupling analysis of the vehicle passenger compartment with the roof, air-gap, and trim boundary. Journal of Vibration and Acoustic, Vol. 122, Issue 3, 2000, p. 196-202.
-
Yang C., Adams D. E., Yoo S. W. Diagnosing Vibration Problems with Embedded Sensitivity Functions. Sound and Vibration, Vol. 37, Issue 4, 2003, p. 12-16.
-
Yang C., Adams D. E., Yoo S. W., et al. An embedded sensitivity approach for diagnosing system-level vibration problems. Journal of Sound and Vibration, Vol. 269, 2004, p. 1063-1081.
-
Lee J. K., Kim C. M., Sa J. S. An experimental study on placements and thickness of damping material for vibration control of automotive roof. Transactions of the Korean Society of Automotive Engineers, Vol. 13, Issue 6, 2005, p. 31-37.
-
Han S. S. FE analysis for application of isotropic steel sheet on auto-roof panel. Transactions of Materials Processing, Vol. 15, Issue 3, 2006, p. 241-246.
-
Low L., Langley R., Breden R., et al. Planar roof mounted automotive antenna. Loughborough Antennas and Propagation Conference, 2007, p. 109-112.
-
Reis D. B., Nicoletti R. Positioning of Deadeners Using Embedded Sensitivity. SAE Technical Papers, 2008-36-0133.
-
Zheng H., Yan F. W., Lu C. H., et al. Optimization design of valve spring for abnormal noise control in single-cylinder gasoline engine. Proceedings of the Institution of Mechanical Engineers, Part D: Journal of Automobile Engineering, Vol. 231, Issue 2, 2017, p. 204-213.
-
Bekaryan A., Song H. J., Hsu H. P., et al. Parametric study of roof geometry and roof rack crossbar effects on the performance of multi-band vehicle antennas. IEEE 70th Vehicular Technology Conference, 2009, p. 1-3.
-
Zheng W., Weng J. S. Modal analysis and comparison of vehicle ceiling with finite element method. Journal of Chongqing Institute of Technology (Natural Science), Vol. 23, Issue 4, 2009, p. 7-10.
-
Cameron J. C., Wennhage P., Göransson P. Prediction of NVH behaviour of trimmed body components in the frequency range 100-500 Hz. Applied Acoustics, Vol. 71, Issue 8, 2010, p. 708-721.
-
Kassem M., Soize C., et al. Structural partitioning of complex structures in the medium-frequency range. An application to an automotive vehicle. Journal of Sound and vibration, Vol. 330, 2011, p. 937-946.
-
Kulkarni S. C., Marks M. Thermoplastic Roof Crush Countermeasure Design for Improved Roof Crush Resistant to Meet FMVSS-216. SAE Technical Papers, 2011-01-1119.
-
Kim J. S., Hwang J. H., Chung H. G. Study on micro deformation of automobile roof with mastic sealer after oven process. International Journal of Precision Engineering and Manufacturing, Vol. 15, Issue 4, 2014, p. 649-654.
-
Liu J. S., Hollaway L. Design optimisation of composite panel structures with stiffening ribs under multiple loading cases. Computers and Structures, Vol. 78, 2000, p. 637-647.
-
Gao Y. K., Feng H. X., Ma F. W., et al. Acoustic-structure coupled modal test based on PolyMax. Journal of Vibration and Shock, Vol. 32, Issue 2, 2013, p. 158-163.
-
Rousounelos A., Walsh S. J., Krylov V. V. Radiation efficiency of finite plates with beam stiffeners. Proceedings of the Institute of Acoustics, Vol. 30, Issue 2, 2008, p. 124-131.
-
Rousounelos A., Walsh S. J., Kryolov V. V. Radiation efficiency of natural modes of plates with beam stiffeners. Proceedings of the International Conference Acoustics, 2008, p. 703-708.
-
Hemmatnezhad M., Rahimi G. H., Ansari R. On the free vibrations of grid-stiffened composite cylindrical shells. Acta Mechanica, Vol. 225, Issue 2, 2014, p. 609-623.
-
Holt J., Garry K., Velikov S. A wind tunnel investigation into the effects of roof curvature on the aerodynamic drag experienced by a light goods vehicle. International Journal of Vehicle Design, Vol. 67, Issue 1, 2015, p. 45-62.
-
Miao X. J., Gao G. J. Influence of ribs on train aerodynamic performances. Journal of Central South University, Vol. 22, 2015, p. 1986-1993.
-
Kociecki M., Adeli H. Two-phase genetic algorithm for topology optimization of free-form steel space-frame roof structures with complex curvatures. Engineering Applications of Artificial Intelligence, Vol. 32, 2014, p. 218-227.
-
Chen J. M., Huang Y. Y., Zheng G. W. Vibration and acoustic radiation from orthogonally stiffened infinite circular cylindrical shells in water. China Ocean Engineering, Vol. 16, Issue 4, 2002, p. 437-452.
-
Carfagni M., Citti P., Governi L., et al. Vibroacoustic optimization of stiffening ribs and damping material distribution on sheet metal parts. Shock and Vibration, Vol. 11, 2004, p. 271-280.
-
Fusano L., Priarone P. C., Avalle M., et al. Sheet metal plate design a structured approach to product optimization in the presence of technological constraints. International Journal of Advanced Manufacturing Technology, Vol. 56, 2011, p. 31-45.
-
Kassem M., Soize C., Gagliardini L. Energy-density field approach for low-and medium-frequency vibroacoustic analysis of complex structures using a statistical computational model. Journal of Sound and vibration, Vol. 323, 2009, p. 849-863.
About this article

This work is funded by the National Natural Science Foundation of China (U1564202 and Grant No. 51605353), and the Innovative Research Team Development Program of Ministry of Education of China (IRT13087).
