Abstract
This paper presents image processing methods for visualization and classification of medial meniscus tears. The first method uses watershed with a threshold segmentation approach. The algorithm was tested on a number of images of the knee obtained with a use of the magnetic resonance imaging technique (MR). Images of the knee were collected from healthy subjects and patients with a clinically diagnosed meniscal pathology. Then, watershed technique was compared with other popular methods of image segmentation, i.e. simple thresholding and region growing. For this purpose, the execution speed and the efficiency of the methods were analyzed. Additionally, an automatic detection of the meniscus based on MRI of the knee joint was developed. The solutions were implemented using classical image processing methods in the MATLAB environment with an application of the Image Processing Toolbox and MVtec Halcon vision libraries. The presented methods will have a practical value for the referring physicians and the diagnostic imaging specialists.
1. Introduction
Knee joint is among the musculoskeletal system one of the most commonly injured structures in the body. Lesions in the knee joint are frequently visible both in athletes (amateurs and professionals) as well as other patients active in sports whose joints suffered from degeneration due to maladjustment of joint surfaces [1, 2]. Recent advances in medical imaging technology have made it possible for specialists to visualize anatomical structures and physiological processes occurring inside the human body.
Among the available techniques of diagnostic imaging, only MR gives a possibility of visualization of both soft tissue elements as well as bone and cartilage of the joint. Therefore, the technique is superior to Computed Tomography (CT) or ultrasound (US) radiological modalities dedicated to the assessment of the bone elements and soft tissues respectively. If one suspects that intra-articular structures are injured, MR is considered to be the gold standard for visualization techniques. In studies carried out on the knee structures - evaluation of the medial meniscus using a standard protocol verified intraoperatively achieves the sensitivity and specificity reaching 89 % and 84 % (respectively) [3]. MRI examination is not painful and noninvasive procedure.
In the case of properly carried out studies, the factor limiting the effectiveness of diagnosis may be a lack of vigilance on the part of a doctor. Fatigue, haste and poor imaging conditions are limiting factors reducing the quality of interpreting MR images and affect radiological reports [4]. Therefore, the ability to create a computer program that automatically detects and localizes an injury or lesion might be a valuable aid for the physician.
Computer based program dedicated to analysis and interpretation of visual information is potentially useful tool which helps to make the right diagnosis, i.e. the confirmation, identification and evaluation of injuries or lesions, as well as the planning of a possible therapy. Successful diagnostic imaging depends both on the methods of acquisition, reconstruction and presentation of the images but also the efficiency of diagnostic process [5, 6]. At the level of evaluation of the diagnostic images, interpretation depends on the knowledge and the experience of the radiologist, although physician can be assisted by automatized detection module. It is especially important during the evaluation of the musculoskeletal system where structures are very small and oriented in longitudinal fashion where error rate is potentially high [7].
Based on the literature, first attempts of MR images segmentation dates back to the previous century [8]. Watershed segmentation has been widely used in many fields of image processing including segmentation of medical images [9, 10]. It is a simple, intuitive and fast method, the result of which is a segmentation of images even in the case of low contrast. Watershed technique has become a popular method of extracting many anatomical structures based on the images obtained from magnetic resonance imaging (MRI), computer tomography (CT), mammography, or ultrasound (US). In recent years, successful attempts with an implementation of the watershed algorithm was made on samples of different anatomical structures evaluated with a use of MR. In this field of studies, an evaluation of the bone erosions of the hand [11, 12], brain amyloid plaques [13] and even breast lesions [14] were presented. There are a few publications present image processing algorithms dedicated to the knee joint, but directed to evaluate cartilage [15] on weight bearing parts. Semi-automated and automated segmentation techniques of menisci on high field system are already described in two works [16, 17]. But none with a use of techniques proposed in our study. Review of the present literature indicates that up to date only a few attempts were made to evaluate usefulness of processing algorithms of the knee menisci. As menisci are one of the most frequently injured structures of the musculoskeletal system, there is a need for a simple and reliable image processing algorithm for the segmentation and visualization of this region of the knee. In terms of tools used for segmentation one can apply algorithms based on the values of intensity levels (e.g. thresholding), methods of edge detection (Canny operator), area methods (region growing, watershed method), methods based on models (active contours, deformable models, the level set method) and those based on combined characteristics of the algorithms mentioned above (i.e. hybrid methods) [18]. Regarding information security an encryption technique and decryption technique can be recommended as valuable tool for sharing and storing image information in electronic way [19].
In the paper, two image processing methods for extraction of the meniscus in the magnetic resonance images of the knee joint and evaluation of its state are presented. The first method uses watershed segmentation with a threshold. The second one uses simple image processing segmentation algorithms and introduces an automatic generation of region of interest (ROI) based on the image content. The efficiency and speed of the watershed-based method was evaluated and compared with other segmentation procedures: a simple thresholding and region growing methods. The efficiency of the segmentation with an automatic ROI extraction was tested on a set of MRI images of the knee. A novelty of the proposed solutions reveals methods of automatic and semi-automatic segmentation of the knee structures (menisci) and classification of the state of knee joints meniscus injuries as a result of the segmentation.
The paper is structured as follows: the second chapter describes method and methodology. The detailed information of MRI procedure was given as first. Next, two segmentation algorithms are presented. In the third chapter, the results of the segmentation of MRI images using developed methods are discussed. The last chapter contains conclusions.
2. Methods and methodology
2.1. MRI Imaging
In the MRI study, high field 1.5 T unit was used – Somatom Esssenza (SIEMENS) equipped with a 4-channel and 4-element coil dedicated for an examination of the knee.
MR imaging of the knee was conducted in a patient of a standard body weight in relaxed supine position. The study was performed using sequences of standard protocol dedicated for the knee. T2 fast spin echo Sequence parameters were: repetition time 4820 ms, echo time 98 ms, flip angle150°, bandwidth 191 Hz, matrix 160×100, 25 slices, slice thickness 3 mm, distance factor 20 %, voxel size 0.5×0.4×3 mm 3, 2 scan average.
Proton density sequence parameters were: repetition time 3000 ms, echo time 23 ms, flip angle 150°, bandwidth 160 Hz, matrix 160 x 100, 25 slices, slice thickness 3 mm, distance factor 20 %, voxel size 0.6×0.6×3 mm, 1 scan average. Inversion recovery sequence parameters were: repetition time 3500 ms, echo time 77 ms, flip angle 150°, bandwidth 202 Hz, matrix 160×100, 25 slices, slice thickness 3 mm, distance factor 20 %, voxel size 0.8×0.8×3 mm, 1 scan average. T1 fast spin echo sequence parameters were: repetition time 471 ms, echo time 13 ms, flip angle 150°, bandwidth 155 Hz, matrix 160×100, 25 slices, slice thickness 3 mm, distance factor 20 %, voxel size 0.5×0.4×3 mm, 1 scan average.
Images were acquired in the saggital plane and collected in the PACS syngo (Siemens) and then evaluated on a console equipped with a system OsiriX-Pixmeo (Mac OS platform). Proton density sequences with chemical fat saturation made in sagittal plane were analyzed in our study.
2.2. Menisci segmentation algorithm based on watershed method
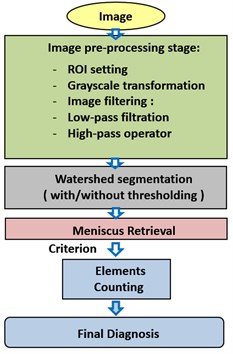
To investigate effectiveness of automated menisci damage detection a watershed method has been used. Image pre-processing was the first step of the developed algorithm. An operator specifies a region of interest for which the computation is carried out. Next, the region is processed by the following operations: conversion to a grayscale (in the case of color images), low-pass filtering using Gaussian kernel to reduce the image noise and computation of an image gradient by means of high-pass filter, e.g. Sobel operator. In the next step, a watershed segmentation [20] by flooding is performed on the obtained image gradient. To avoid oversegmentation, which is often a result of the algorithm, the watershed segmentation with a threshold method is applied. The last step of the image processing is merging of regions corresponding to anterior and posterior corners of the meniscus segmented in the previous step. After the menisci are retrieved, the number of regions is counted and became a criterion for meniscus injury classification. The healthy meniscus image should contain one object for anterior and posterior part of the meniscus after segmentation. If regions are fragmented, the meniscus is classified as injured. The algorithm is summarized in the Fig. 1.
Fig. 1Menisci segmentation based on watershed method algorithm
Watershed method is a segmentation technique in which a grayscale image is considered to be a topographic surface in which regions with higher levels of intensity correspond to mountain ranges and regions with lower levels to the valleys. In a watershed segmentation by flooding, the surface is flooded from its minima. The water coming from different sources is prevented from merging by the areas with the highest intensity levels. As a result, the image is partitioned into two different sets of pixels: the catchment basins and the watershed lines. If the transformation is applied to the image gradient, the catchment basins should theoretically correspond to the homogeneous grey level regions of this image, while pixels with the highest gradient value become watershed lines. However, the watershed method produces an oversegmentation due to noise in the image gradient.
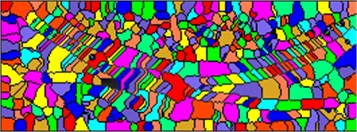
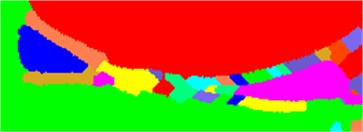
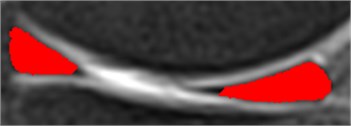
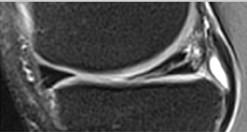
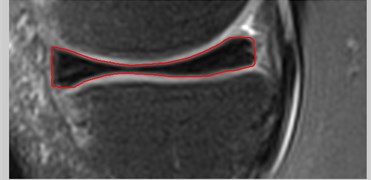
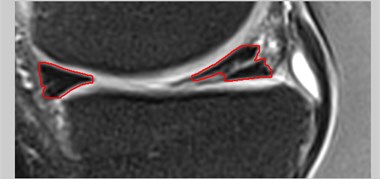
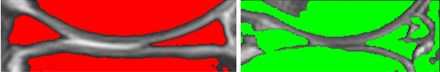
In order to improve the quality of the result of the segmentation and to reduce the number of objects obtained, a watershed segmentation with a threshold was applied. The method segments catchment basin areas separated by a watershed region equal to or greater than a given threshold value. In the first stage of the algorithm, a selection of watersheds lines without considering threshold is carried out. In the second step, the catchment basins which are separated by a watershed value which is less than the threshold are combined. Two steps of segmentation algorithm and the results of menisci retrieval are shown in Figs. 2(a), (b), (c).
Fig. 2a) Results of watershed segmentation method, b) results of watershed segmentation with a threshold method, c) detected anterior and posteriori corners of the meniscus
a)
b)
c)
2.3. Automatic meniscus segmentation method
Authors developed a method of automatic detection and diagnosis of the meniscus in MR image of the knee joint. The solution was implemented using classical image processing methods in the MATLAB environment with the Image Processing Toolbox.
The first step of the developed algorithm is an automatic computation of the region of interest (ROI). In the next step, the structure of the meniscus is located in this area. The following step is an analysis of every part of the segmented meniscus separately to determine the diagnosis. The flowchart in Fig. 3 illustrates all the steps of the algorithm.
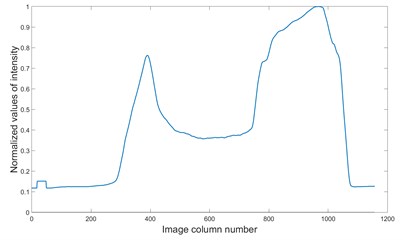
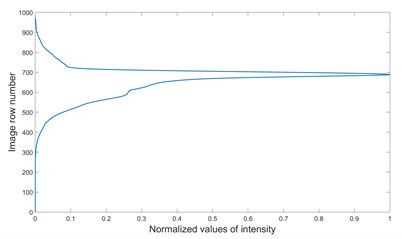
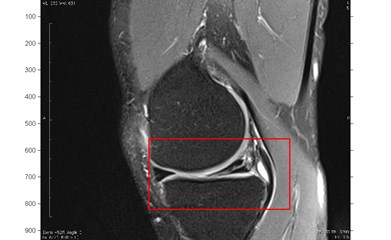
In the study, MR images of the knee in the sagittal plane were analyzed. In addition to the meniscus, the remaining structures of the joint were visualized in the image. In order to narrow the field of analysis, a rectangular region of interest (ROI) comprising an anterior and posterior aspects of meniscus is established automatically Fig. 4(c). The MR image is converted to a grayscale and filtered using Savitzky-Golay filter for noise reduction. The distribution of gray levels in the image is analyzed separately along horizontal and vertical directions. First the median intensity is computed for each of the image column. The graph of the median values Fig. 4(a) is characterized by two peaks corresponding to the edges of the meniscus. To correctly specify the position of the meniscus along image columns, parameters are introduced. Parameter 2 specifies the ratio of the position of the search point with respect to the area under left peak, while parameter 3 sets analogous ratio for the right peak. Next, the median intensity is calculated for each row of the image. The graph Fig. 4(b) of computed median values is characterized by a peak at the position of the meniscus. Therefore, the maximum of the graph specifies the position of the meniscus center in the vertical axis. Height of ROI is obtained by dividing its width, the distance between two peaks of the median intensities computed along columns, by 2.
Fig. 3Block diagram of implemented image analysis method
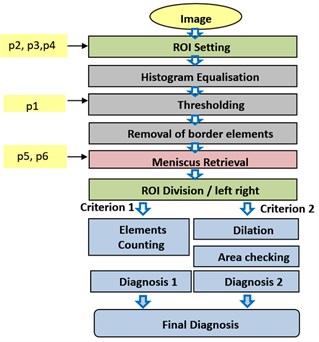
To further adjust the vertical position of the ROI, a ratio parameter 4 is used. The height of ROI is multiplied by parameter 4 and the distance from the meniscus to the upper border of ROI is obtained. Similarly, the calculated height of the ROI is multiplied by the reciprocal of the parameter 4 (p4 – Parameter 4) to yield the distance from the meniscus to the bottom limit of ROI.
Fig. 4a) the median of the normalized value of intensity computed for the successive columns of the image as a function of column number, b) the median of the normalized value of intensity computed for the successive rows of the image as a function of row number, c) established ROI indicating position of the meniscus
a)
b)
c)
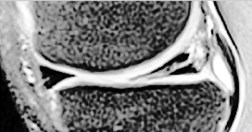
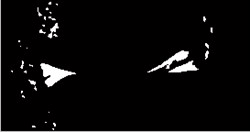
In the next step, image inside an established ROI Fig. 5(a) is preprocessed by a histogram equalization operation Fig. 5(b). Then, thresholding is performed to extract all the elements having the same intensity value as the meniscus. As a threshold of the segmentation, the product of the average value of the intensity of the image and parameter 1 is taken. If no objects are found, the algorithm automatically lowers the threshold. Then the elements connected with the edges of the image are removed. The effect of these operations is shown in Fig. 5(c).
Fig. 5Damaged meniscus images from left to right: a) input image, b) image after histogram equalization, c) image with extracted meniscus fragments
a)
b)
c)
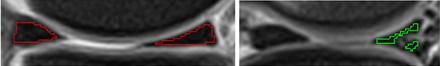
The next step is a detection of objects with a large area, which most likely are part of the meniscus. For this purpose, the analyzed objects defined as elongated in the vertical direction and tiny objects are discarded. Objects belonged to the elongated class were classified by means of width-to-height comparison (Fig. 6, in green rectangles). In addition, the algorithm calculates the area of each object and counts their overall sum. After the computation, only the largest objects will remain in the image, whose cumulative sum of areas does not exceed a certain value (parameter 5). In order to penalize choosing too small objects (called tiny objects), they are removed if their area is less than a certain threshold (parameter 6). As a result, the objects representing the meniscus are obtained.
Two criteria for evaluation of the structure were proposed. The first is the number of elements in the image. It determines the degree of disintegration of the tested portion of the meniscus. If the number of elements in the image is greater than one, the positive value indicating the possibility of a damage is assigned to it.
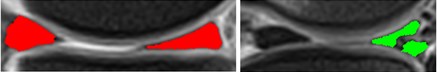
In the case of the second criterion, one examines the surface area of the meniscus, determining planimetrically injured region of the meniscus. A ratio of the undamaged surface and estimated total surface area of the meniscus is calculated. Dilation of the analyzed image allows to determine approximately triangular mask. The result is highlighted in Fig. 7 (red contours). The obtained ratio gives the percentage of healthy test surface structure. Based on the analysis of the sample image set, the threshold for this criterion was determined. It amounted to 50 %.
Fig. 6Image of extracted meniscus fragments with noise object highlighted by green rectangles
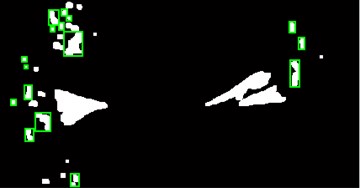
Fig. 7The red outline indicate the correct shape of meniscus fragments

The analysis is performed for each individual part of the meniscus. Its outcome consists of two parameters described above: the number of objects in the image and their surface area. In the evaluation, the following parameters were assumed:
Presence of an injury – if the criterion 1 value is greater than 1 and the criterion 2 is greater than 50 %
Possibility of an injury – if the criterion 1 value is greater than 1 or criterion 2 value is greater than 50 %
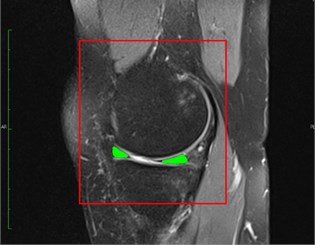
No injury – if the value of criterion 1 is less than or equal to 1 and the value of criterion 2 is lower than 50 %. Examples of the automatic segmentation results are shown in Fig. 8.
Fig. 8Examples of automatic meniscus segmentation, a) healthy meniscus case, b) injured meniscus case
a)
b)
3. Results of the algorithm testing and analysis
The watershed algorithm was implemented using Halcon MVTEC GmbH Software containing libraries of image processing algorithms. When a watershed segmentation without a threshold was applied, number of segments that had arisen as a result far exceeded the number of objects that could be identified by a doctor in a manual inspection. An introduction of the method with a threshold brought satisfactory results. Final images contained properly delineated areas of the anterior and posterior corners of the meniscus. Additionally, images depicting an injured meniscus with a characteristic slit can be identified. The meniscus in this case is divided into two or more elements.
In addition, the efficacy of the method was tested for a larger ROI covering the entire knee joint. It turned out that the extraction of the meniscus was correct, regardless of the size of the selected ROI. An example of segmentation using a larger ROI is shown in Fig. 9.
Fig. 9Watershed segmentation method results in a case of larger ROI
The results of the image segmentation of the meniscus using the method of watershed with a threshold were compared with the results obtained using segmentation by a simple thresholding and region growing. All three methods have also been compared based on their versatility and speed of computation.
In the study, four images of the knee joints of healthy individuals and six images derived from patients with lesions of the meniscus were analyzed. An example of final results obtained by the watershed segmentation algorithm, simple thresholding operation and region growing is illustrated in Fig. 10.
Results show that in the case of the healthy meniscus, all three methods are effective and give similar results, however watershed method is much more accurate in the case of image segmentation of the damaged tissue. Meniscus areas obtained by segmentation are separated by a gap. After an application of the simple thresholding method, the areas of the anterior and posterior corners of the meniscus were segmented correctly, but additionally, the femur and tibia were also visible in the final image. The wrong result of segmentation was obtained because the intensity values of pixels belonging to the femoral and tibial regions were in the range of experimentally predetermined threshold.
Fig. 10Comparison of segmentation results for healthy (left column) and injured (right column) using the following methods: a) simple thresholding, b) region growing, c) watershed with a threshold
a)
b)
c)
Comparison of the computation time of three methods: simple thresholding, region growing and watershed segmentation is shown in Table 1.
The average execution time of the watershed algorithm is approximately 1.2 [s] and is higher than the computation time of thresholding and region growing. This is due to an additional merging of segmented areas.
The second developed method, an automatic retrieval of meniscus was tested on a series of MRI images. A set consisted of 4 images of injured meniscus and 3 images of healthy structures. The proposed method uses six parameters described in the previous section. The first parameter is used to calculate the segmentation threshold in the first step of the algorithm. Second, third and fourth parameters are used to find the ROI. Another parameter – the fifth and sixth one – are used to find regions belonging to the meniscus. The best obtained result amounted to 78.6 % correctly diagnosed portion of the meniscus and 14.3 % diagnosed as “possible injury”.
The values of the parameters which give the best classification of the results were chosen and then the algorithm was tested on a new set of test images. The percentage of correctly classified images was 83.3 % in the first category and 16.7 % in the second category.
Table 1Mean time of execution for three different methods of image segmentation
Segmentation method | Time of execution [s] |
Watershed with a threshold method | 1.156 |
Simple thresholding | 0.286 |
Region growing | 0.017 |
4. Conclusions
Currently, many different image processing methods are used for the visualization and diagnosis of pathologies of different biological structures. MR imaging of the knee joint plays a critical role in the diagnosis and treatment of the meniscus injury. As part of the research task, MR images of the knee were processed in order to visualize the meniscus and recognize its injury using a watershed segmentation technique. The watershed segmentation may result in an inclusion of an excessive number of regions which are in the ROI but are not objects of interest - what is potentially a source of error. In order to improve the quality of segmentation and remove a large number of small regions watershed segmentation with a threshold was employed.
The method was tested on a number of images of the knee acquired from healthy subjects and patients with a diagnosed meniscal pathology. The influence of selected parameters of the image pre-processing on the final result of segmentation was examined. Then watershed technique was compared with other popular methods of image segmentation, i.e. thresholding and region growing. For this purpose, the speed of algorithms was estimated and the efficiency of the methods were analyzed. The comparison demonstrated its superior effectiveness in the diagnosing of meniscal tears. The obtained results indicate that the watershed segmentation method can be used not only to discriminate the anterior and posterior corner of the meniscus in the sagittal plane of the knee but also distinguish irregularities associated with presence of intermeniscal fissures.
Our current work describes a simple algorithm that automatically analyzes MR image of the knee the sagittal plane, with a use of the known image processing techniques. The results show that our modified algorithm correctly recognizes menisci and the damage of their structure. The solution was implemented using classical image processing methods in the MATLAB environment and the Image Processing Toolbox library. The most advantageous step of our algorithm is the automatic detection of region of interest (ROI). Developed algorithm correctly determines the ROI on each scan, which enables the correct diagnosis at a later stage of the method.
A novelty of the proposed solutions addresses the following issues: methods of automatic and semi-automatic segmentation of selected structures of the knee (menisci) and classification of the state of knee joints’ meniscus injuries based on the segmentation results.
On the basis of current literature data, we found our work first attempt of development of semi-automated test of the knee menisci injury with use of watershed method. Comparison between two techniques: modified watershed segmentation algorithm and automatic meniscus segmentation method presents not only new insight in the contemporary techniques of computer assisted analysis of MR images but also is a step forward to development of automated technique of discrimination of knee injury on MR image. Therefore, the method seems to have a practical value in the field of the imaging of the medial compartment of the knee what is additional benefit of our work.
References
-
Kiadaliri A. A., Lamm C. J., De Verdier M. G., Engström G., Turkiewicz A., Lohmander L. S., Englund M. Association of knee pain and different definitions of knee osteoarthritis with health-related quality of life: a population-based cohort study in southern Sweden. Health and Quality of Life Outcomes, Vol. 14, Issue 1, 2016, p. 121.
-
Zhang Y., Jordan J. M. Epidemiology of osteoarthritis. Clinics in Geriatric Medicine, Vol. 26, Issue 3, 2010, p. 355-369.
-
Cheung L. P., Li K. C., Hollett M. D., Bergman A. G., Herfkens R. J. Meniscal tears of the knee: accuracy of detection with fast spin-echo MR imaging and arthroscopic correlation in 293 patients. Radiology, Vol. 203, Issue 2, 1997, p. 508-512.
-
Ha A. S., Porrino J. A., Chew F. S. Radiographic pitfalls in lower extremity trauma. American Journal of Roentgenology, Vol. 203, Issue 3, 2014, p. 492-500.
-
Przelaskowski A. Computer-aided diagnosis based on medical imaging – challenges and development perspectives. Acta Bio-Opticaet, Informatica Medica, Vol. 3, Issue 16, 2010, p. 245-253.
-
Huang X., Tsechpenakis G. Medical Image Segmentation. Information Discovery on Electronic Health Records. Chapman and Hall/CRC, 2009.
-
Tall M. A., Thompson A. K., Greer B., Campbell S. The pearl sand pitfalls of magnetic resonance imaging of the lower extremity. Journal of Orthopaedic and Sports Physical Therapy, Vol. 41, Issue 11, 2011, p. 873-886.
-
Sijbers J., Scheunders P., Verhoye M., van der Linden A., van Dyck D., Raman E. Watershed-based segmentation of 3D MR data for volume quantization. Magnetic Resonance Imaging, Vol. 15, Issue 6, 1997, p. 679-688.
-
Roerdink J., Meijster A. The watershed transform: definitions, algorithms and parallelization strategies. Journal of Fundamenta Informaticae, Vol. 41, Issues 1-2, 2000, p. 187-228.
-
Beucher S. The watershed transformation applied to image segmentation. 10th Pfefferkorn Conference on Signal and Image Processing in Microscopy and Microanalysis Cambridge, UK, 1992, p. 299-314.
-
Włodarczyk J., Wojciechowski W., Czaplicka K., Urbanik A., Tabor Z. Fast automated segmentation of wrist bones in magnetic resonance images. Computers in Biology and Medicine, Vol. 65, 2015, p. 44-53.
-
Włodarczyk J., Czaplicka K., Tabor Z., Wojciechowski W., Urbanik A. Segmentation of bones in magnetic resonance images of the wrist. International Journal of Computer Assisted Radiology and Surgery, Vol. 10, Issue 4, 2015, p. 419-431.
-
Iordanescu G., Venkatasubramanian P. N., Wyrwicz A. M. Automatic segmentation of amyloid plaques in MR images using unsupervised support vector machines. Magnetic Resonance in Medicine, Vol. 67, Issue 6, 2012, p. 1794-1802.
-
Cui Y., Tan Y., Zhao B., Liberman L., Parbhu R., Kaplan J., Theodoulou M., Hudis C., Schwartz L. H. Malignant lesion segmentation in contrast-enhanced breast MR images based on the marker-controlled watershed. Medical Physics, Vol. 36, Issue 10, 2009, p. 4359-4369.
-
Fripp J., Crozier S., Warfield S. K., Ourselin S. Automatic segmentation and quantitative analysis of the articular cartilages from magnetic resonance images of the knee. IEEE Transactions on Medical Imaging, Vol. 29, Issue 1, 2010, p. 55-64.
-
Swanson M. S., Prescott J. W., Best T. M., Powell K., Jackson R. D., Haq F., Gurcan M. N. Semi-automated segmentation to assess the lateral meniscus in normal and osteoarthritic knees. Osteoarthritis Cartilage, Vol. 18, Issue 3, 2010, p. 344-353.
-
Paproki A., Engstrom C., Chandra S. S., Neubert A., Fripp J., Crozier S. Automated segmentation and analysis of normal and osteoarthritic knee menisci from magnetic resonance images-data from the osteoarthritis initiative. Osteoarthritis Cartilage, Vol. 22, Issue 9, 2014, p. 1259-1270.
-
Paulus D., Greiner T., Knuvener C. Watershed transformation of time series of medical thermal images. Proceedings of SPIE 2588, Intelligent Robots and Computer Vision 14: Algorithms, Techniques, Active Vision, and Materials Handling, Vol. 700, 1995.
-
Ragulskis M., Aleksa A., Saunoriene L. Improved algorithm for image encryption based on stochastic geometric moiré and its application. Optics Communications, Vol. 273, Issue 2, 2007, p. 370-378.
-
Woods R., Gonzales R. Digital Image Processing. Prentice Hall, Upper Saddle River, NJ, 2008.
Cited by
About this article

The research reported in this paper has been financed from the state budget for science. The authors wish to acknowledge Urszula Para and Ewa Żyła for participation in the reported research.
