Abstract
In recent years, the final disposal facility for the long-term storage of high radioactive waste is an important issue and an urgent task for nuclear Industry. This study is focus on the understanding the procedure of dry storage system in a nuclear power plant. The dry storage system is known as transportable storage canister (TSC) packing by using spent fuel placed in vertical concrete cask (VCC) or VCC with add-on-shell (AOS) canister and then those conveyed VCC or AOS will be put on the concrete pad. A numerical simulation for evaluation the behavior of VCC and AOC under the earthquake hits is used the finite element model by LS-DYNA and the real seismic behavior is obtained using shaking table test. Test results indicate that the simulation by numerical model can slightly simulate the dynamic records by shaking table test. This is because that the behavior of shaking table test is the rocking motion but the numerical model is the sliding motion. The surface roughness between the cask and concrete pad is an important variable and it needs more numerical simulation to solve the interface and friction coefficient between the cask and concrete pad.
1. Introduction
The most devastating earthquake occurred on the 1999 Chichi earthquake [1, 2] and 2016 Tainan earthquake in Taiwan, respectively, as well as on the 2011 Tohoku earthquake in Japan [3, 4], which was caused significant damage for existing reinforced concrete structures. The safety of unclear power-related structures such as unclear power plants or disposal facility for high radioactive waste was became one of the environmental, safety and important problems for public in Taiwan [5, 6]. The seismic capacity of unclear-related structures is closely watched by all and the medias. No neglecting of earthquake disasters on unclear-related structures was an important research issue and the application and development of seismic evaluation in industrial and unclear fields are also kept to give in the future.
However, the space of spent fuel pools on-site at unclear power plants for temporary storage in Chinshan and Kuosheng plant in Taiwan is running out, and the site of final disposal facility for the long-term storage of high radioactive waste is still difficult to be decided [7, 8]. The installation of dry-type interim storage facilities is urgent. Dry storage allows spent fuel to be stored for a certain period, surrounded by inert gas inside a canister, typically a steel cylinder welded closed. The steel canister provides a leak-tight containment for the spent fuel. Each canister is encased in additional steel, concrete, or other material, providing radiation shielding for workers and the public and designed by institute of nuclear energy research in Taiwan [9, 10]. React to the dry storage of spent fuel in first nuclear plant is about to be finished, to simulate the reaction of original design VCC steel bottom-plate and AOC concrete base caused by earthquake action. The design the scale-down concrete cask has been constructed and the scale-down casks are suitable to conduct the seismic testing using shaking table over the past decades [9, 11, 12]. To conduct Scaled-down experiment in the same height of center of gravity and acceleration of earthquake condition. Build up finite element model of VCC and AOC with different bottom pad by ANSYS, then using LS-DYLNA analysis to compare between the model of scale-down vertical concrete cask under the earthquake effect and experiment result.
2. Simulation method, analysis model and experimental
2.1. Analysis model
ANSYS 14.5 offers engineering simulation solution sets in engineering simulation that a design process requires. The ANSYS structural analysis software suite is trusted by organizations around the world to rapidly solve complex structural engineering problems with ease. FEA analysis (finite element) tools from ANSYS provide the ability to simulate every structural aspect of a product: Linear static analysis that simply provides stresses or deformations, modal analysis that determines vibration characteristics, advance transient nonlinear phenomena involving dynamic effects.
2.2. Simulation method
There are three situations listed below:
1. The scale-down vertical concrete cast and add-on-shell including reinforced concrete hollow pipe and reinforced concrete upper pad.
2. Pedestal: VCC and AOS, (See Fig. 1).
3. Reinforced concrete bottom pad: flat pad, rough pad, hump-on-center pad three condition had been considered. After create the geometric grid 3-D finite element model by ANSYS 14.5, simulate the explicit dynamic transient analysis by using LS-DYNA 971.
Fig. 1Geometry size and arrangement
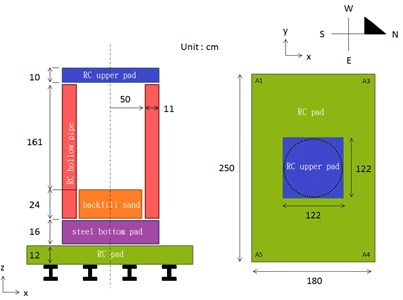
a) VCC
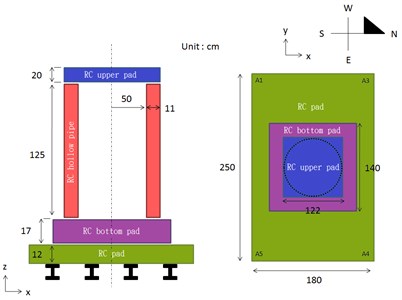
b) AOS
2.3. Specimen and experimental setup
The scale-down VCC and AOS specimen is made by reinforced concrete and the dimension of typical specimen is shown in Fig. 1 as well as and the net weigh is approximately 2035 and 1842 kgf, respectively. Moreover, the concrete of 210 kg/cm2 was used to cast the specimen and the embedded #3 rebar was made of medium carbon steel following the specification of ASTM A615. The specimens were connected to the shaking table by bolts and the appearance of VCC and AOS specimen in shaking table is shown in Figs. 2(a) and 2(b), respectively. The shaking table has 2 degree of freedom system with a frequency range between 0.1-50 Hz and the maximum specimen weight is 6 tons. In addition, the maximum acceleration for lateral and longitudinal is 0.9 g and 1.0 g, respectively. In addition, the laser doppler displacement meters were applied in the corresponding position of the specimen for the measurement of the displacement response of the specimen.
Fig. 2Appearance of the specimen in shaking table specimen
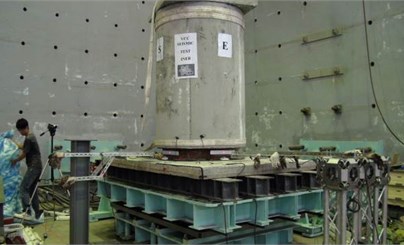
a) VCC
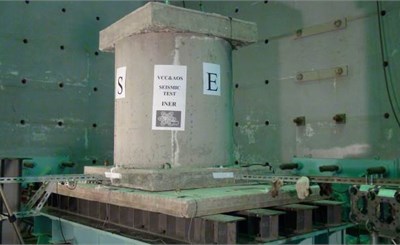
b) AOS
3. Fundamental assumption and parameters
3.1. Fundamental assumption
The major construction of VCC and AOC compose of three parts discussed below: (1) there are steel bars inside the two constructions, reinforced concrete upper pad and reinforced concrete hollow pipe. Considered NUREG/R6608 [13] method, the finite model without setting steel bars has been assumed that all the construction components are isotropy, homogeneous and linear-elastic material. (2) Steel pad and concrete pad have been assumed linear-elastic material, and constrained by reinforced concrete hollow pipe and reinforced concrete pad. (3) Reinforced concrete pad have been assumed rigid body.
The mass of all components derived from [13], and also obtained density of all components after the mass divided by the volume. In the VCC type, there is backfill sand inside the reinforced concrete hollow pipe, as shown in Fig. 1(a). This research considered that backfill sand and reinforced concrete hollow pipe are identified with a group.
3.2. Parameters
All the parameters setting for ANSYS have been listed apart as shown in Tables 1 and 2. The structural model of the VCC and AOS specimen for concrete elements and steel elements was modeled using solid 65 and solid 185 elements, respectively. In order to model the connection between the bottom of the concrete pad and shaking table, the nodes used as the location of the bottom were modeled with a fix end. However, the interface between scale-down VCC/AOS specimens and concrete pad was modeled with a free condition to analysis the rocking motion or sliding motion for the specimens. In addition, the concrete pad was modeled with a rigid body and those specimens was modeled with the linear-elastic materials.
The data of acceleration history for shaking table experiment directly have been set on the LS-DYNA analysis model. The direction of acceleration is horizontal for RC pad. The time step of sampling rate is 0.001 second. Due to the irregularity of contact between trial and RC pad, the rolling effect would be happened. The friction coefficient is evaluated by average of experimental data. The coefficient of static friction for VCC and AOC are 0.204 and 0.267 respectively. The coefficient of kinetic friction for VCC and AOC are 0.194 and 0.231 respectively.
The historical earthquake time series data from the scale down experiment is used by LS-DYNA. Only horizontal acceleration for RC pad is considered. Sampling time step is 0.001 s. The earthquake time history for an existing record of 921 Chi-chi earthquake in Taiwan of and direction have been shown as Fig. 3.
Table 1Parameters of mechanical material property settings
Setting | VCC | ||
Unit* | Upper pad | Hollow pipe and backfill | Bottom steel pad |
Total weight | 352.86 | 1682.39 | |
Total volume | 1.48e+08 | 8.98e+08 | |
Density | 2.37e-06 | 2.23e-06 | 7.86e-06 |
Elastic modulus | 23.99 | 23.99 | 200 |
Poisson ratio | 0.2 | 0.2 | 0.29 |
Table 2Parameters of mechanical material property settings
Setting | AOS | ||
Unit* | Upper pad | Hollow pipe | RC pad |
Total weight | 705.73 | 1136.75 | |
Total volume | 2.97e+08 | 4.79e+08 | |
Density | 2.37e-06 | 2.23e-06 | 2.37e-06 |
Elastic modulus | 23.99 | 23.99 | 23.99 |
Poisson ratio | 0.2 | 0.2 | 0.2 |
Fig. 3Historical earthquake time series data
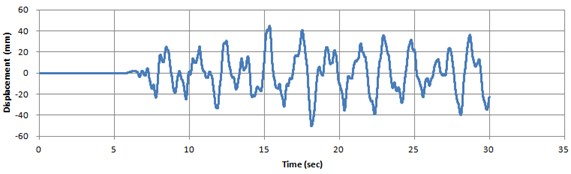
a) direction
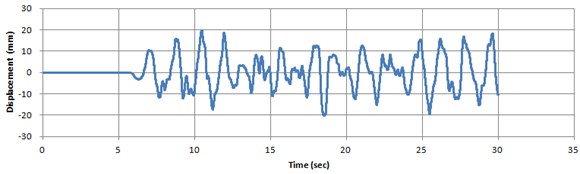
b) direction
4. Simulation result
The finite element model of VCC and AOS are as shown in Fig. 4. The solid element is hexahedral solid elements and most of shell is quadratic shell elements. All the components are applied upward 0.0098 (mm/ms2) gravitational acceleration in order to simulate the effect of gravity. RC pad is rigid body and rest of other part is elastic.
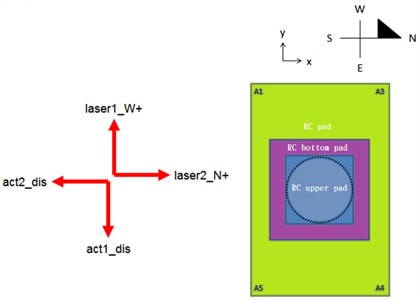
The time history of experiment data for VCC and AOS is 53.5 and 61.0 seconds respectively. The RC pad is rough. Displacements of VCC and AOS pad have been measured by laser equipment which the measure direction is east-west and south-north. The result we discussed is compared with relative displacement between trial and RC pad. The signal direction of laser channel is as shown in Fig. 5.
According to different RC pad of VCC and AOC, six cases had been discussed below: (1) VCC with flat pad (2) VCC with rough pad (3) VCC with hump-on-center (4) AOS with flat pad (5) AOS with rough pad. (6) VCC with hump-on-center and increased twofold coefficient of friction.
Fig. 4Finite element model of LS-DYNA
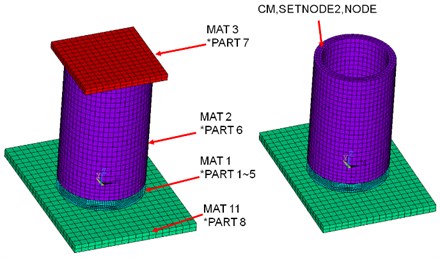
a) VCC
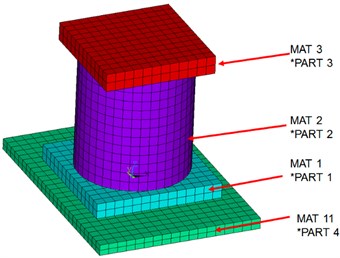
b) AOS
Fig. 5The channel direction of digital data in experiment
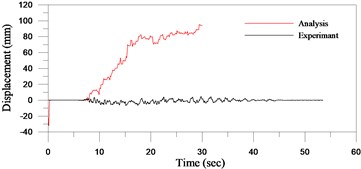
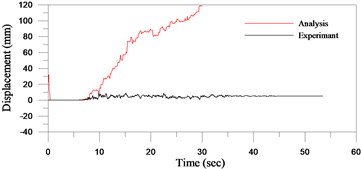
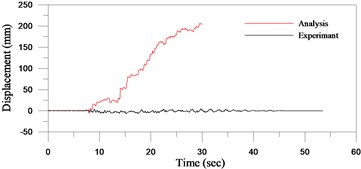
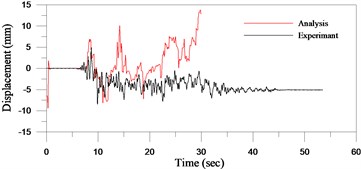
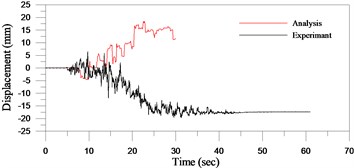
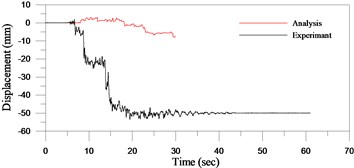
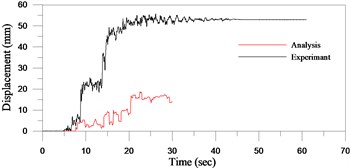
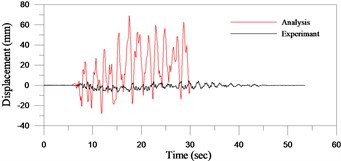
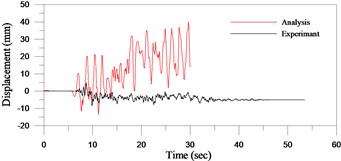
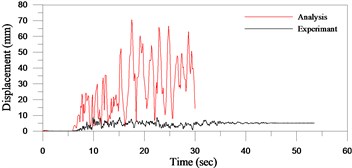
In addition to the sum of displacement, also the relative displacement of and direction have been compared between simulation and experiment (see Figs. 6 to 11). The comparison results have been listed as shown in Table 3. The max displacement of experiment in 30 seconds is 51-59 mm, and the max displacement of simulation is 70-76 mm. Consider the probably errors happened and highly dynamic non-linear behavior, both results are quite close. The ground roughness of pad would make an influence on the structure stability of VCC and AOS in unclear fields, which is consistent with previous studies in industrial fields [14, 15]. The degree of shaking situation in direction is more apparent than , due to the steepness of inclination of direction. Due to the limitation of equipment capability, the degree of shaking situation wouldn’t be measured. It’s an important index to identify the structure dynamic stability.
Table 3Comparison between experiment and analysis of VCC and AOS
Case | Maximum relative displacement in 30 (mm) seconds | ||
DX | DY | Total | |
Experiment of VCC | –6.984 | –8.499 | 11.000 |
(1) | 22.878 | 5.941 | 23.637 |
(2) | 94.021 | 73.372 | 119.262 |
(3) | 206.009 | 13.795 | 206.470 |
(4) | 69.051 | 39.884 | 79.742 |
Experiment of AOS | –19.620 | –55.580 | 58.941 |
(5) | 18.437 | –7.862 | 20.043 |
(6) | 41.727 | –63.396 | 75.896 |
Fig. 6Comparison between experiment and simulation analysis of VCC with flat pad
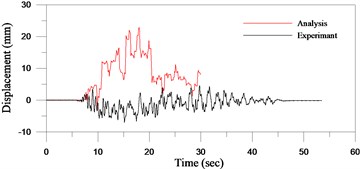
a) direction
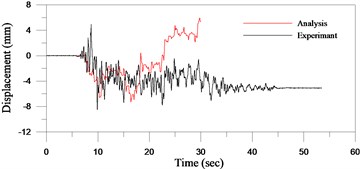
b) direction
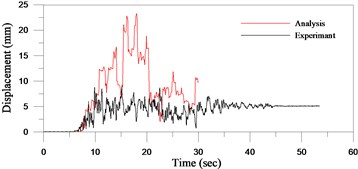
c) Total displacement
Fig. 7Comparison between experiment and simulation analysis of VCC with rough pad
a) direction
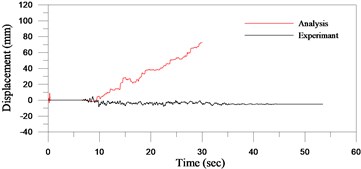
b) direction
c) Total displacement
Fig. 8Comparison between experiment and simulation analysis of VCC with hump-on-center pad
a) direction
b) direction
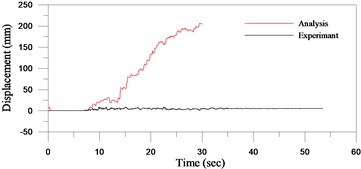
c) Total displacement
Fig. 9Comparison between experiment and simulation analysis of AOS with flat pad
a) direction
b) direction
c) Total displacement
Fig. 10Comparison between experiment and simulation analysis of AOS with rough pad
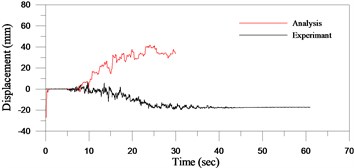
a) direction
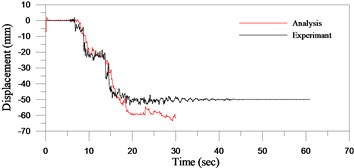
b) direction
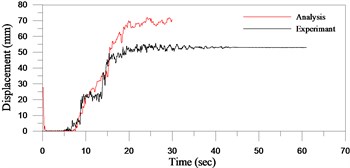
c) Total displacement
Fig. 11Comparison between experiment and simulation analysis of VCC with hump-on-center and increased twofold coefficient friction pad
a) direction
b) direction
c) Total displacement
5. Conclusions
The explicit and implicit dynamic transient of construction component could be finished by LS-DYNA. The ground roughness of pad would make an influence on the structure stability of VCC and AOS, but bigger effect for VCC. The degree of shaking situation in direction is more apparent than , due to the steepness of inclination of direction. The effect of ground roughness of VCC is bigger than AOS, because of the pad of is hollow steel construction but AOS is solid concrete. The stiffness of pad for AOS resulted of the reduction of displacement while shaking. Since the shaking degree of VCC is bigger than AOC, and the unstable structure behavior causing several errors occurred while experimenting or analyzing.
The differences between experiment and simulation result are huge. Since the vibration situation of VCC is larger than AOS, the structure behavior is unstable. Initial position of VCC and AOS in both dimensioning and analyzing will cause the effects upon the results. The bigger errors could be happened no matter which analysis or experiment is. The degree of roughness on ground and flatness on pad which causing the errors occurred should be handling precisely.
References
-
Hsu S. K., Lo C. L. Change of crustal gravitational potential energy in the Taiwan orogen by the Chi-Chi earthquake sequence. Earth and Planetary Science Letters, Vol. 222, Issue 2, 2004, p. 573-581.
-
Liao Y. H., Lin S. F., Liao W. H., Huang J. H., Shen M., Lin C. H., Huang C. H. Deaths related to housing in 1999 Chi-Chi, Taiwan, earthquake. Safety Science, Vol. 43, Issue 1, 2005, p. 29-37.
-
Takewaki I., Fujita K., Yoshitomi S. Uncertainties in long-period ground motion and its impact on building structural design: case study of the 2011 Tohoku (Japan) earthquake. Engineering Structures, Vol. 49, 2013, p. 119-134.
-
Koseki J., Koda M., Matsuo S., Takasaki H., Fujiwara T. Damage to railway earth structures and foundations caused by the 2011 off the Pacific Coast of Tohoku earthquake. Soils and Foundations, Vol. 52, Issue 5, 2012, p. 872-889.
-
Chapman N., Hooper A. The disposal of radioactive wastes underground. Proceedings of the Geologists’ Association, Vol. 123, Issue 1, 2012, p. 46-63.
-
Yoshida H., Aoki K., Semba T., Ota K., Amano K., Hama K., Kawamura M., Tsubot K. Overview of the stability and barrier functions of the granitic geosphere at the Kamaishi Mine: relevance to radioactive waste disposal in Japan. Engineering Geology, Vol. 56, Issues 1-2, 2000, p. 151-162.
-
Liu S. J., Soong K. L., Yang J. T. Final disposal of spent nuclear fuel in Taiwan: a state-of-the-art technical overview. Waste Management, Vol. 9, Issue 3, 1989, p. 171-188.
-
Chen K. C., Ting K., Li Y. C., Chen Y. Y., Cheng W. K., Chen W. C., Liu C. T. A study of the probabilistic risk assessment to the dry storage system of spent nuclear fuel. International Journal of Pressure Vessels and Piping, Vol. 87, Issue 1, 2010, p. 17-25.
-
Lin C. Y., Wu T. Y., Huang C. C. Nonlinear dynamic impact analysis for installing a dry storage canister into a vertical concrete cask. International Journal of Pressure Vessels and Piping, Vol. 131, 2015, p. 22-35.
-
Huang C. C., Wu T. Y. A study on dynamic impact of vertical concrete cask tip-over using explicit finite element analysis procedures. Annals of Nuclear Energy, Vol. 36, Issue 2, 2009, p. 213-221.
-
Shirai K., Hirata K., Saegusa T. Experimental studies of free-standing spent fuel storage cask subjected to strong earthquakes. SMiRT 17, Prague, Czech Republic, 2003.
-
Saegusa T., Shirai K., Arai T., Tani J., Takeda H., Wataru M., Sasahar A., Winston P. L. Review and future issues on spent nuclear fuel storage. Nuclear Engineering and Technology, Vol. 42, Issue 3, 2010, p. 237-248.
-
Witte M., et al. Summary and Evaluation of Low-Velocity Impact Tests of Solid Steel Billet onto Concrete Pads. NUREG/CR-6608, UCRL-ID-129211, 1998.
-
Lundberg O. E., Nordborg A., Arteage I. L. The influence of surface roughness on the contact stiffness and the contact filter effect in nonlinear wheel-track interaction. Journal of Sound and Vibration, Vol. 366, 2016, p. 429-446.
-
Wu T., Thompson D. J. Theoretical investigation of wheel-rail non-linear interaction due to roughness excitation. Vehicle System Dynamics, International Journal of Vehicle Mechanics and Mobility, Vol. 34, Issue 4, 2000, p. 261-282.
About this article

This support of the National Science Council (NSC) under the Grant NSC102-3113-P042A-009 in Taiwan is gratefully acknowledged.
