Abstract
In this paper, a novel multi-channel mechanical failure signal classification method based on augmented quaternion singular spectrum analysis (AQSSA) is proposed. Quaternion is used to couple four channels signal, and the quaternion trajectory matrixes can be developed as augmented quaternion matrix by using the feature of the quaternion. The singular value sequence including characteristic information can be extracted by quaternion singular value decomposition (QSVD) of the augmented trajectory matrix using its covariance matrix. The method of traditional singular spectrum analysis (SSA) can only analyze the single channel signal, however, AQSSA can fully use the correlation of multi-channel and reduce the loss of the effective information. Additionally, the main singular values are defined by some methods such as difference spectrum aimed, which has the limitation that major singular values can’t be obtained under the high background noise. Thus, a concept of partial mean of singular value sequence is proposed, and it can be set as the standard of evaluating the trend of singular value sequence. In order to testify the performance of the proposed method, the numerical simulation signal and the fault vibration signal of bearing are simultaneously adopted to verify its effectiveness. The results indicate that the effectiveness of mechanical fault classification by the proposed method is superior to the traditional SSA method and the method of permutation entropy.
1. Introduction
The measured vibration signal containing the fault information is processed with the purpose of identifying the faulty characteristic parameters in the field of mechanical equipment fault diagnosis. Naturally, in the real operation state of the mechanical equipment, fault types can be judged by these characteristics [1-3], such as time-domain and frequency domain characteristics. Time-domain characteristics such as waveform index, peak factor, impulse index and margin index are often used [4], while frequency domain characteristics can be extracted by the method of wavelet analysis, wavelet package analysis or resonance sparse decomposition etc. [5-9]. These techniques mainly extract relevant features from the original vibration signal, in order to achieve the condition monitoring of the mechanical equipment effectively [10].
Normally, many traditional signal processing method is not applicable in the mechanical fault diagnosis technology due to that the fault signal often exhibits the characteristic of strongly nonlinear, non-stationary characteristics [11-13]. In order to analyze the nonlinear time series, the phase space reconstruction theory is proposed [14], which can reflect the dynamic characteristics of the vibration signal by reconstructing the attractor of original signal phase space [15]. The method of singular spectrum analysis (SSA) based on the phase space reconstruction theory was proposed by Colebrook, which has been applied to the technology of meteorological analysis in early times [16, 17]. In recent years, with the mechanical fault signal has been proved strong nonlinear characteristics, SSA are widely used in mechanical fault diagnosis domain field [18, 19]. Particularly, SSA can acquire all kinds of subspace signal by using singular value decomposition (SVD) on the trajectory matrix of the attractor [15], and the generated singular values can be treated as fault feature parameters. Normally, the subspace signal is reconstructed by the larger singular value. In this way, SSA fulfills the function to reduce the noise and improves the reliability of the mechanical equipment fault diagnosis [20]. Up to date, the signal processing method based on SSA is limited to the analysis of the single channel mechanical equipment fault signal, thus it will inevitably cause the omission of effective fault feature information and increase the contingency of diagnosis [21-22]. It’s worthy mentioned that the development of multi-dimensional sensor technology has highlighted the potential that the traditional single channel or one dimensional signal processing algorithms will be replaced by multi-channel technology [23]. Especially, the hardware cost of the multi-channel vibration signal calculation has been able to accept presently and multi-channel signal processing technology can acquire more useful fault information so as to improve the confidence level and the accuracy of diagnostic analysis results. Clive put forward the concept of quaternion and the method of augmented quaternion SSA (AQSSA) in signal processing [24]. This new method was successfully applied in the biomedical signal processing domain and proved to be suitable for signal noise reduction and blind source separation. Moreover, it is necessary to determine the effective characteristic parameters. Presently, partial mean, as a representation of the trend of the signal, was widely used in data statistics, forecasts, and other signal processing fields [25, 26]. Therefore, the AQSSA method and the partial mean have potential value in the mechanical equipment fault diagnosis.
In this paper, the quaternion trajectory matrix is constructed by two steps, which can be summarized into coupling the four-channel signal into one-dimensional quaternion sequence and establishing a Hankel matrix by phase space reconstruction. Moreover, in order to extract the correlation of multi-channel, quaternion trajectory matrix will be developed as augmented quaternion matrix. After the singular value sequence is obtained by SVD for the covariance matrix of augmented matrix, the process of calculating the partial median of the generated singular value sequence can be achieved. Then the partial mean can be used to achieve fault diagnosis and classification. In order to verify the effectiveness of this method, numerical simulation multi-channel data and Cincinnati bearing fault data are used to analyze [27]. The results of fault classification demonstrate that the method proposed in this paper has a better effect in mechanical fault classification than the traditional SSA method and the method of permutation entropy at a signal-to-noise ratio as low as 5 dB. Meanwhile, the proposed method in this paper can achieve the extraction of fault feature of signals in four channels.
2. The method of fault classification based on AQSSA
2.1. The concept of quaternion
Quaternion, a kind of complex, was first proposed by the Irish mathematician named Hamiltonian [28]. A quaternion comprises of one real part and three imaginary components [24]:
The imaginary units, and are orthogonal unit vectors:
Another important concept for the quaternion domain is the so-called “quaternion involution”, which is defined as a self-inverse mapping. All three involutions about the , and imaginary unit axes are given by [24]:
And the augmented quaternion statistics is generated on the basis of it. It should be noted that this involution describes rotating around a unit axis, while the conjugate operator of the quaternion rotates along all three virtual axes:
A quaternion vector and the relationship between the vector and the involution are:
Then, as long as four of the five vectors are collected, the fifth vectors can be calculated.
2.2. Singular spectrum analysis
SSA is a typical subspace decomposition algorithm, which is used to obtain the characteristic information of the original signal by using singular spectrum characteristic for the trajectory matrix to the reconstructed attractor. SSA is consists of two complementary stages: decomposition and reconstruction.
2.2.1. Decomposition
Embedding can be regarded as a mapping that transfers a one-dimensional time series into the trajectory matrix , whose first column is a part of the original signal, and its second column is the one step lag version of the first column, as shown in Eq. (7). The parameter is defined as the length of the window, where , . is the length of the signal source. should be long enough to take into account the information of the change of the data. is a Hankel matrix, where the elements along the diagonal line are equal:
The trajectory matrix is then expressed as the characteristic vector and the singular value by the SVD of the covariance matrix , as shown in Eqs. (8) and (9):
where and represent the left and right singular value vector. represents the singular values of the matrix , which is arranged in the order of reduction as . Parameter limits the characteristic value corresponding to the principal component. is defined as elementary matrix as follows:
2.2.2. Reconstruction
This stage is used to reconstruct signal from the elementary matrix and simultaneously reduce the impact of noise. In the first part, elementary matrix is divided into several groups, and each group is represented by a corresponding matrix , which is the sum of the basic matrix within the subset :
Elementary matrices can be divided into the main domain and the noise subspace. Normally, noise subspace is ignored in reconstruction. Therefore, the desired subset is selected, and is derived through Hankelization algorithm, which calculates the average value of the matrix along the diagonal of the cross. If represents an input to the matrix , the th element of the reconstruct signal is calculated by averaging along , , and is obtained [20]:
2.3. The method of singular values extraction based on AQSSA
This stage extracts the fault feature from four channel original signals by using AQSSA. In the first step, each channel data can be regarded as a part of quaternion, in that way four channel original signals are coupled into a one-dimensional data by using Eq. (1). As a result, SSA can be used to extract the characteristic information of this generated one-dimensional data. In other words, real data is coupled into a quaternion sequence. Thus, quaternion sequence can be translated into the trajectory matrix . The next step aims at calculating quaternion SVD of trajectory matrix by using its covariance matrix of trajectory matrix. Unlike real value SSA in which the covariance is , for AQSSA, the basic trajectory matrix combines information augmented by all three involutions (as shown in the Eq. (4)) to produce augmented trajectory matrix , such as:
where , is transpose of the α-involution operation of the trajectory matrix . Afterwards, the generated can be used to calculate a new augmented covariance matrix :
where in the Eq. (13) is standard covariance matrix. The matrix of , and are complementary matrix. The last step is extractingthe fault feature, and the singular value can be regarded as characteristic information. Therefore, SVD can be used to obtain the singular value sequence of the covariance matrix and generated singular value are the characteristic information. Up to now, the stage of feature extraction has been finished and the work of decomposition in SSA is needless.
2.4. Partial mean of singular value sequence
The traditional method of feature extraction in SSA is to obtain the dominant from the generated singular value sequence, which can’t be used effectively under the high noise condition. Partial mean has been used to research the trend of multi-scale entropy, and the results show that partial mean of multi-scale entropy can reflect the characteristics of information comprehensively [29]. In this paper, partial mean was used to be the standard of evaluating the trend of singular value sequences. Thus, the generated partial mean of singular value sequence can be regarded as the characteristic parameters of the original fault signal.
For a one-dimensional time series , the main stage of proposed method is described as follows:
Step 1: Use the method of feature extraction based on AQSSA to obtain the singular value sequence. Then, pick out part of major singular values to construct a new sequence by the theory of contribution degree [30]. The new sequence can be represented as , .
Step 2: Calculate the skewness of sequence. Skewness is used to measure the magnitude and direction of the deflection for a group of statistical data. The computational formula is given by:
where is the average, is the median and means the standard deviation of that sequence.
Step 3: Calculate the partial mean of , and the computational formula is given by:
Then, the method of characteristic parameters extraction has completed and the generated partial mean can be used in fault classification.
3. Research on numerical simulation signal classification
Commonly, mechanical failure signals can be regarded as the form of linear superposition of simulated signal and noise signal. According to former description, simulated four simulated signal with Gaussian noise is exploited to construct the four channels data. The level of SNR is set as 3db and each channel is given by:
The sampling frequency is 1024 Hz, and the length of each channel data is 20000. Thus, the four channels modulated signal can be represented as:
In order to simulate different failure frequency and verify the effectiveness in classification, three groups of four channels simulated data are acquired, where each group has different numerical simulation frequency in each channel:
: 50 Hz, 70 Hz, 130 Hz, 170 Hz (Group 1);
: 30 Hz, 80 Hz, 115 Hz, 155 Hz (Group 2);
: 60 Hz, 195 Hz, 235 Hz, 265 Hz (Group 3).
Considering the multi-channel signal exist a certain logic relation and in order to avoid the loss of generality, each group of original four channels simulated signal has to be mixed with a 4×4 random matrix. The simulated signals were modeled as follow:
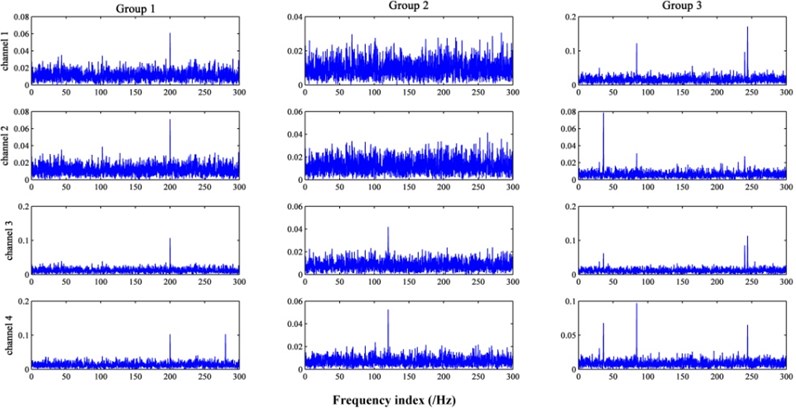
The spectral analysis of numerical simulation signal is shown by Fig. 1. Due to that the high noise background and the mixed process by random matrix, the feature frequency of numerical simulation cannot be identified.
Then, each group has to be divided into 20 samples and there are 60 samples totally. The sample can be represented as , where 1, 2, 3 and 1, 2,..., 19, 20.
In aim at verifying the effectiveness of the method this paper proposed, numerical simulation signal is used to classify the experimental signal. Meanwhile, the classical method of SSA will be compared.
Fig. 1The spectral of three groups of numerical simulation signal
3.1. The performance of SSA method in signal classification
For each sample, data from the four channels were analyzed separately and corresponding four singular value sequences were obtained by SVD. Parts of major singular values in sequence were identified to construct a new sequence by the metrics of contribution degree. Subsequently, the contribution degree was selected as 90 % in this part. Then, the partial means of new singular value sequences was calculated. It means that each sample have corresponds four partial means. The partial means of each sample in different channels was compared, which can be used to achieve the signal classification.
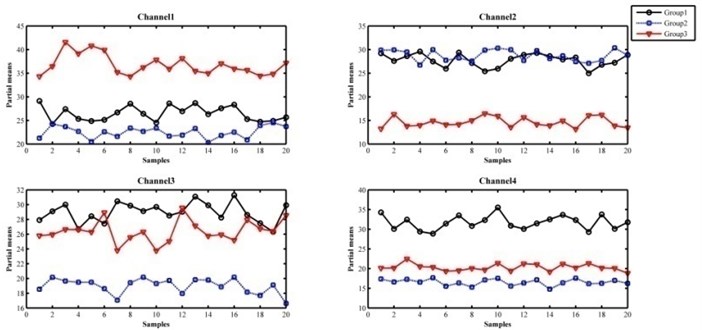
As the Fig. 2 shown, in channel 1 and channel 2, there has no obvious boundary between partial means of samples from Group 1 and Group 2. It means that samples in Group 1 and Group 2 can’t be separated accurately in channel1 and channel 2. In channel 3, partial means from Group 1 and Group 3 have no difference, and it will make the result unauthentic. Only in channel 4, three groups of signal can be separated effectively. However, the process of analyzing four channels data in turn results in large amount of calculation.
Fig. 2The partial means of samples obtained by SSA method
3.2. The performance of permutation entropy in signal classification
The method of permutation entropy is a new algorithm, which described the complexity of the one-dimensional data. It can detect the dynamic change of a physical system, so the method of permutation entropy is widely used in mechanical fault classification [31]. In this part, the method of permutation entropy will be compared. For each sample, data from the four channels were analyzed separately. The order of permutation entropy is set as 5 and the delay time is chosen as 1, respectively. Then, the permutation entropy was calculated.
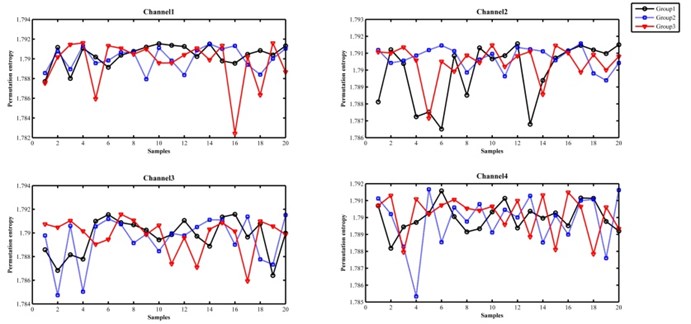
As the Fig. 3 shown, there has no obvious boundary between permutation entropy of samples from each two groups in four channels. Thus, the method of permutation entropy is unsuitable for classification under the high noise background.
Fig. 3The permutation entropy of samples
3.3. The performance of AQSSA in signal classification
In this part, the method proposed was used in simulation signal analysis. The biggest advantage is that it's unnecessary to analyze each channel in turn and avoid the problem of estimating which channel has shown more accurate result. For each sample, four channels data were coupled into one-dimensional quaternion data, which is aimed to translate it into the trajectory matrix. Then, the covariance matrix of augmented matrix can be computed. Afterwards, SVD was used to obtain the singular value sequence of the covariance matrix and the major singular value is determined by the contribution degree up to 90 %. Then, the partial means were calculated for classification.
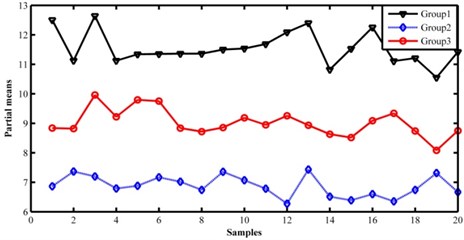
As the Fig. 4 shown, there are obvious boundaries between each group signal, which demonstrates that three groups of signal can be separated accurately. Group1 have partial means in boundary 10.5-12.7, Group 2 in boundary 6.2-7.5 and Group 3 in 8-10. Comparing with the classification result of SSA, the effect for numerical simulation signal classification based on proposed method is better.
Fig. 4The partial means of samples obtained by the method based on AQSSA
4. Analysis of bearing fault signal classification based on AQSSA
Bearing is one of the most common mechanical parts in mechanical equipment, and it is widely used in modern industrial production. Usually, bearing has to work for long time, the dynamic change of load especially heavy load lead to the bearing fault occur frequently. According to statistics, the bearing fault has a big proportion in rotating machinery fault. Therefore, the bearing fault diagnosis and classification is necessary. In this part, bearing vibration signal measured from the intelligent maintenance system center of University of Cincinnati was used to verify the proposed method in bearing fault signal classification [19]. The experimental device is shown in Fig. 5.
Fig. 5Bearing test rig and sensor placement illustration
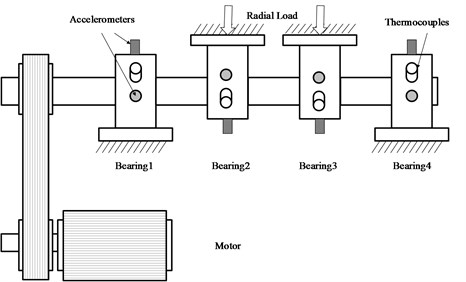
Four Rexnord ZA-2115 bearings were installed on a shaft. The rotation speed of shaft was kept constant at 2000 RPM. The shaft and bearing is applied a radial load of 6000 lbs by a spring mechanism, and all bearings are lubricated. PCB353B33 high-sensitivity acceleration sensor was installed in horizontal direction and vertical direction of each bearing. Sampling frequency was set up to 20 kHz. A total of three groups of all life experiments were performed. The information of three groups of data is shown by Table 1.
In order to verify the effectiveness of the method proposed, three groups of bearing experimental data were used to classify the experiment signal in this part. Moreover, the SSA method will be compared. Group 2 and Group 3 bearing experimental data were obtain by acceleration sensors which were installed in vertical direction of each bearing, so that Group 2 and Group 3 are four channels data. Group 1 are 8 channels data, four of these channels from sensors that were installed in vertical direction of each bearing were picked out. Then, there are 3 groups of four channels experimental data, and 20 samples were selected in each group. The sampling point value of each sample is selected as 6000.
The process in this part is as the same as research on numerical simulation signal classification and the contribution degree is selected as 90 % likewise. Group 2 and Group 3 both are outer cave failure signals and the failure occurred in different place. Therefore, it may have some difficulties to separate Group 2 and Group 3 just using SSA method.
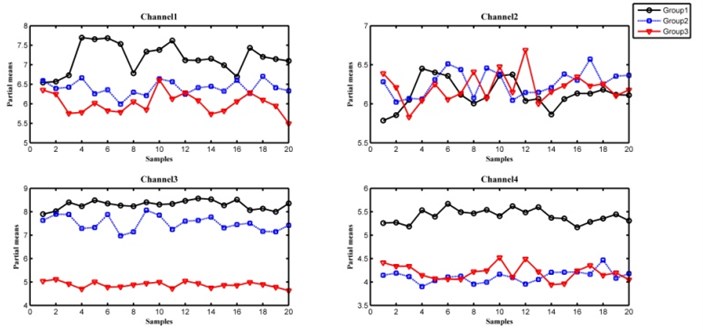
The classification result based on SSA method is shown by Fig. 6. There has no obvious boundary between partial means of samples from each two groups in channel 1 and channel 2, which will lead the poor performance of classification. Especially in channel 2, there is almost no difference between partial means in each groups, the accuracy of classification is lower than in channel 1. In channel 3, Group 3 can be separated accurately, while few samples in Group 2 can’t be separated from samples in Group 1. The accuracy of classification is highest in four channels. It is acceptable that Group 1 can be separated from other groups and the partial means in Group 2 and Group 3 have no differences in channel 4. It can make the conclusion that the accuracy of classification is not satisfactory in all channels. This result reveals some limitations about SSA method.
Table 1Description of three groups of bearing fault signal
Group | Sample channels | Fault description |
Group 1 | 8 | Inner race defect that occurred in bearing 3 and roller element defect occurred in bearing 4 |
Group 2 | 4 | Outer race failure that occurred in bearing 1 |
Group 3 | 4 | Outer race failure that occurred in bearing 3 |
Fig. 6The partial means of samples obtained by SSA method
The classification result based method of permutation entropy is shown by Fig. 7. In channel 1 and channel 2, there has no obvious boundary between permutation entropy of samples from each two groups. In channel 3, Group 3 can be separated accurately, and few samples in Group 2 can’t be separated from samples in Group 1. The accuracy of classification is highest in four channels. Actually, only Group 1 can be separated effectively in channel 4. Generally, the effect of mechanical fault classification by the method of permutation entropy is similar to SSA.
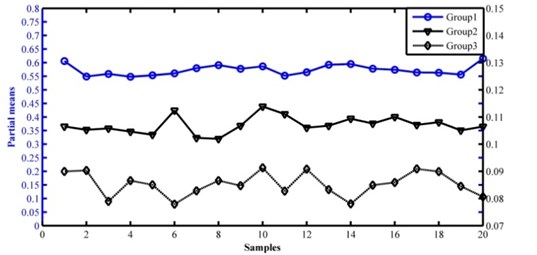
The classification result based on the method proposed is shown by Fig. 8. Each group can be separated accurately, and there is an obvious boundary between Group 2 and Group 3 particularly. Consequently, the credibility of the fault classification method based on AQSSA is higher than SSA. Moreover, the method proposed can save workload of analyzing and estimating four channels in turn. The result was verified that the proposed method can be used in actual bearing fault classification.
Fig. 7The permutation entropy of samples
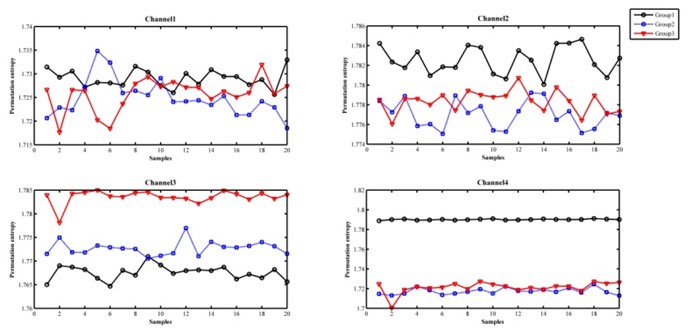
Fig. 8The partial means of samples obtained by the method based on AQSSA
5. Conclusions
A new multi-channel mechanical failure signal classification method based on augmented quaternion singular spectrum analysis (AQSSA) is proposed in this paper. The main research works are listed as follows: 1) Aiming at the disadvantage of the SSA and difference spectrum, a multi-channel fault diagnosis method was introduced. The concept of quaternion was used to couple four channels signal. Especially, augmented quaternion algorithm was employed to describe the internal relation of four channels and partial mean of singular value was used in classification. Through the use of this fault signal diagnosis method based on augmented quaternion singular spectrum analysis (AQSSA), the reliability of the generated characteristic information is further improved. 2) The proposed method in this paper is verified by the numerical simulation signal and the bearing fault signal in public data set. The research results indicate that the proposed method is obviously superior to the SSA methods and the method of permutation entropy for mechanical failure signal diagnosis. In addition, the process that analyzes four channels in turn is omitted, it makes fault diagnosis more accurate. As above mentioned, the method proposed in this paper may be a powerful tool in actual application.
References
-
Abbasion S., Rafsanjani A., Farshidianfar A. Rolling element bearings multi-fault classification based on the wavelet denoising and support vector machine. Mechanical Systems and Signal Processing, Vol. 21, Issue 7, 2007, p. 2933-2945.
-
Lei Y., He Z., Zi Y. Application of an intelligent classification method to mechanical fault diagnosis. Expert Systems with Applications, Vol. 36, Issue 6, 2009, p. 9941-9948.
-
Antoni J. Cyclic spectral analysis of rolling-element bearing signals: facts and fictions. Journal of Sound and Vibration, Vol. 304, Issues 3-5, 2007, p. 497-529.
-
Zhang P. Y., Wang H. Y. A framework for automatic time-domain characteristic parameters extraction of human pulse signals. Eurasip Journal on Advances in Signal Processing, Vol. 1, Issue 2007, 2008, p. 1-9.
-
Sun Q., Tang Y. Singularity analysis using continuous wavelet transform for bearing fault diagnosis. Mechanical Systems and Signal Processing, Vol. 16, Issue 6, 2002, p. 1025-1041.
-
Shen C., Wang D., Kong F., Peter W. T. Fault diagnosis of rotating machinery based on the statistical parameters of wavelet packet paving and a generic support vector regressive classifier. Measurement, Vol. 46, Issue 4, 2013, p. 1551-1564.
-
Figlus T., Stanczyk M. Diagnosis of the wear of gears in the gearbox using the wavelet packet transform. Metalurgija, Vol. 53, Issue 4, 2014, p. 673-676.
-
Borghesani P., Pennacchi P., Randall R. B., Sawalhi N., Ricci R. Application of cepstrum pre-whitening for the diagnosis of bearing faults under variable speed conditions. Mechanical Systems and Signal Processing, Vol. 36, Issue 2, 2013, p. 370-384.
-
Chaari F., Bartelmus W., Zimroz R., Fakhfakh T., Haddar M. Gearbox vibration signal amplitude and frequency modulation. Shock and Vibration, Vol. 19, Issue 4, 2012, p. 635-652.
-
Huang W., Liu Y., Li X. Resonance-based sparse decomposition application in extraction of rolling bearing weak fault information. Foundations of Intelligent Systems, 2014, p. 823-831.
-
Zimroz R., Bartkowiak A. Two simple multivariate procedures for monitoring planetary gearboxes in non-stationary operating conditions. Mechanical Systems and Signal Processing, Vol. 38, Issue 1, 2013, p. 237-247.
-
Abboud D., Antoni J., Eltabach M., et al. Angle/time cyclostationarity for the analysis of rolling element bearing vibrations. Measurement, Vol. 75, 2015, p. 29-39.
-
Yushu C. H. E. N. Nonlinear dynamical principle of mechanical fault diagnosis. Chinese Journal of Mechanical Engineering, 2007.
-
Strogatz S. H. Nonlinear Dynamics and Chaos: with Applications to Physics, Biology, Chemistry, and Engineering. Westview Press, 2014.
-
Zhang Q., Tse P. W. T., Wan X., Xu G. Remaining useful life estimation for mechanical systems based on similarity of phase space trajectory. Expert Systems with Applications, Vol. 42, Issue 5, 2015, p. 2353-2360.
-
Elsner J. B., Tsonis A. A. Singular Spectrum Analysis: A New Tool in Time Series Analysis. Springer Science and Business Media, 2013.
-
Chou J. C. Quaternion kinematic and dynamic differential equations. Transactions on Robotics and Automation, Vol. 8, Issue 1, 1992, p. 53-64.
-
Rocco S. C. M. Singular spectrum analysis and forecasting of failure time series. Reliability Engineering and System Safety, Vol. 114, 2013, p. 126-136.
-
Muruganatham B., Sanjith M. A., Krishnakumar B., Murty S. S. Roller element bearing fault diagnosis using singular spectrum analysis. Mechanical Systems and Signal Processing, Vol. 35, Issue 1, 2013, p. 150-166.
-
Vautard R., Yiou P., Ghil M. Singular-spectrum analysis: a toolkit for short, noisy chaotic signals. Physica D: Nonlinear Phenomena, Vol. 58, Issue 1, 1992, p. 95-126.
-
Yang J., Han J., Dong X. W. Study on fault diagnosis methods of rotating machines based on vector spectrum and support vector data description. Machine Tool and Hydraulics, Vol. 37, Issue 9, 2009, p. 263-264.
-
Figlus T., Stanczyk M. A method for detecting damage to rolling bearings in toothed gears of processing lines. Metalurgija, Vol. 55, Issue 1, 2016, p. 75-78.
-
Chouikhi S., El Korbi I., Ghamri-Doudane Y., Saidane L. A. Fault tolerant multi-channel allocation scheme for wireless sensor networks. Wireless Communications and Networking Conference (WCNC), 2014, p. 2438-2443.
-
Enshaeifar S., Kouchaki S., Cheong Took C., Sanei S. Quaternion singular spectrum analysis of electroencephalogram with application in sleep analysis. IEEE Engineering in Medicine and Biology Society, Vol. 24, Issue 1, 2016, p. 57-67.
-
Burrows B. L., Talbot R. F. The mean deviation. The Mathematical Gazette, Vol. 69, Issue 448, 1985, p. 87-91.
-
Kao Y., Wang C., Zha F., Cao H. Stability in mean of partial variables for stochastic reaction-diffusion systems with Markovian switching. Journal of the Franklin Institute, Vol. 351, Issue 1, 2014, p. 500-512.
-
Qiu H., Lee J., Lin J., Yu G. Wavelet filter-based weak signature detection method and its application on rolling element bearing prognostics. Journal of Sound and Vibration, Vol. 289, Issue 4, 2006, p. 1066-1090.
-
Hamilton W R. On quaternions; or on a new system of imaginaries in algebra. The London, Edinburgh, and Dublin Philosophical Magazine and Journal of Science, Vol. 25, Issue 163, 1844, p. 10-13.
-
Zhang L., Huang W. Y., Xiong G. L. Assessment of rolling element bearing fault severity using multi-scale entropy. Journal of Vibration and Shock, Vol. 33, Issue 9, 2014, p. 198-189.
-
Wold S., Esbensen K., Geladi P. Principal component analysis. Chemometrics and Intelligent Laboratory Systems, Vol. 2, Issues 1-3, 1987, p. 37-52.
-
Yan R., Liu Y., Gao R. X. Permutation entropy: a nonlinear statistical measure for status characterization of rotary machines. Mechanical Systems and Signal Processing, Vol. 29, 2012, p. 474-484.
Cited by
About this article

This work was supported by the National Natural Science Foundation of China (No. 51475339 and 51105284), the Natural Science Foundation of Hubei province under Grants No. 2016CFA042, the Key Laboratory of Metallurgical Equipment and Control of Education Ministry, Wuhan University of Science and Technology (No. 2015B11) and the State Key Laboratory of Refractories and Metallurgy, Wuhan University of Science and Technology (No. ZR201603).
