Abstract
To study the feasibility of detecting pipeline multi-cracks damage using piezoceramic transducers, the electromechanical impedance method and the stress wave based active sensing method were used respectively to perform the damage detection of pipeline with multi-cracks. In this research, the lead zirconate titanate (PZT) type transducers were used due to its strong piezoelectric effect and low cost. During the experiments, two artificial cracks on the pipeline specimen were created, ranging from 0 mm to 9 mm, and seven different operating conditions were generated for each artificial crack. In the monitoring test, for the electromechanical impedance method, the damage index based on Root Mean Square Deviation (RMSD) was used, and for the active sensing method, the damage index based on Wavelet Packet Energy Loss (WPEL) was used. In addition, the relationship between the crack depth and RMSD as well as the relationship between the crack depth and location and WPEL were analyzed. The results show that RMSD and WPEL indices increase with the increase of the depth of pipeline cracks. In addition, the WPEL index increases with the appearance of new cracks. Quantitative analysis of pipeline crack damage can be realized by electromechanical impedance method, and localization analysis on the pipeline multi-cracks damage can be achieved by stress wave method based on sensor arrays.
1. Introduction
Pipeline is widely used in many applications, such as agricultural irrigation, water supply and drainage, heat supply, gas supply, long distance transportation of oil and natural gas, hydroelectric engineering and various kinds of industrial equipment [1]. Pipelines consistently experience complications in service. With some extreme case for examples, the stress corrosion and excessive external forces can result in the formation of cracks in the pipeline. These cracks usually cause the leakage of substance, which may lead to catastrophic consequences with severe economic losses and environmental pollution if not detected in time. Pipeline integrity information combined with a professional management can be obtained by monitoring and detection methods. The risk identification and evaluation, as well as the accident prevention and reduction to ensure the safe operation have become significant in pipeline integrity management [2]. Methods for detection of pipeline damage mainly include the ultrasonic method [3, 4], the eddy current method [5, 6], the fiber optic sensor based method [7-10], and the acoustic emission method [11]. Due to its advantages of combined sensing and actuation capacities [12], the piezoelectric transducer bonded to the structure is used as an effective diagnostic method in the structural health monitoring (SHM). These piezoelectric based SHM diagnostic techniques can be grossly grouped into two general categories based on the physical principle. The first is the electromechanical impedance (EMI) method. The second is the stress wave based method [13]. The impedance-based technique in detecting damage on a sample pipeline with bolted joints was research by Park et al. [14]. Pipeline leak detection using the impedance method was studied by Lay-ekuakille et al. [15]. Choi et al. [16] proposed a WSN-based monitoring system that is applicable of monitoring pipeline structures remotely. These research results demonstrated that the qualitative and quantitative detection of structural damage using the electromechanical impedance method was feasible. For the pipeline damage detection based on stress wave method, Wang and Chen [17] developed a distributed computer system/network to detect and locate leakage caused by illegal drilling on the pipeline for the purpose of stealing petroleum. Baby et al. [18] found that there was inner diameter cracking in pipeline girth welds using creeping waves. Guo and Kundu [19] designed a new sensor and proposed a technique to detect anomalies inside the long pipe wall at a specific depth by selecting an appropriate lamb wave mode. As an important stress wave based method, active sensing using piezoceramic transducers receives an increase amount attention in real-time damage detection and structural health monitoring [20-24]. Recently, the active sensing method was extended to detection of a single crack on a pipe structure [25]. However, detection of multi-cracks on a pipeline using active sensing method has not been reported.
In this paper, the pipeline multi-crack damage is research by the electromechanical impedance method and the stress wave based active sensing method. Both methods employ piezoceramic transducers. For the electromechanical impedance method, a damage index based on Root Mean Square Deviation (RMSD) was used, and for the active sensing method, a damage index based on Wavelet Packet Energy Loss (WPEL) was used to quantitatively represent the crack severity. The effectiveness of this methods was demonstrated through experiments on a pipe specimen with artificial cracks. It is found that quantitative identification and the localization of pipeline multi-cracks damage are feasible with a combination use of the two methods.
2. Experimental setup and testing procedures
2.1. Specimen design
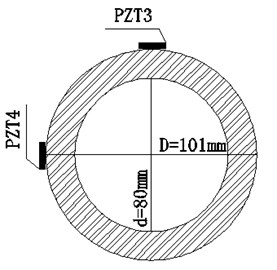
One section of a steel pipeline sample was used as the specimen in this experiment. The pipeline was constructed from Q235 steel. The pipeline has a length of 100 mm with an outer diameter of 101 mm and an inner diameter of 80 mm. Two artificial cracks, with depth increasing from 0 mm to 9.0 mm at an interval of 1.5 mm, were created by mechanical cutting method. The second crack was created after the first one reached its full depth. Seven different operating conditions were tested for each crack. Table 1 shows each operating condition with its different crack depth. It should be noted that the crack depth was increased by 1.5 mm for each operating condition starting from Condition 1, and the crack width was kept at 1.2 mm throughout. PZT-5H was used to as transducers to identify the pipeline multi-cracks damage. The main properties of PZT patches are presented in Table 2. Fig. 1 shows the locations of PZT1, PZT2, PZT3 and the artificial cracks. Fig. 2 shows the locations of PZT3 and PZT4. It should be noted that the artificial crack I was positioned halfway between PZT1 and PZT2 and the artificial crack II was positioned halfway between PZT2 and PZT3.
Table 1Test operating conditions
Operating Condition(OC) | 1 | 2 | 3 | 4 | 5 | 6 | 7 | |
Crack I | Crack depth (mm) | 0 | 1.5 | 3.0 | 4.5 | 6.0 | 7.5 | 9.0 |
Crack II | Crack depth (mm) | 0 | 1.5 | 3.0 | 4.5 | 6.0 | 7.5 | 9.0 |
Table 2Main properties of PZT-5H
Density (g/cm³) | Dielectric constant | Electromechanical coupling coefficient | Capacitance (nF) | Piezoelectric coefficient (C/N) | Curie temperature (°C) | Mechanical quality factor |
7.50 | 1600±10 % | 0.65 | 3.77 | 450 | 350 | 80 |
Fig. 1Locations of PZT sensors and cracks
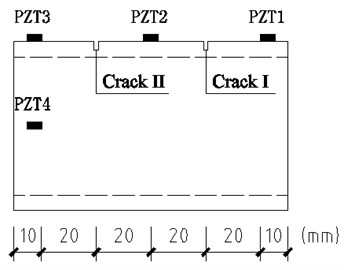
Fig. 2Locations of PZT3 and PZT4
2.2. Experimental setup and testing procedures
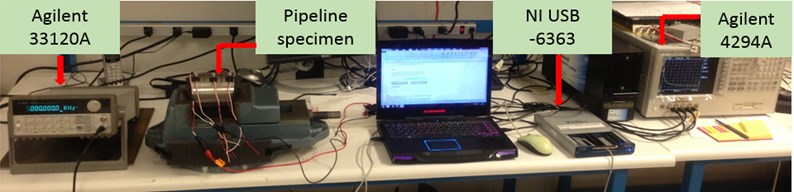
Fig. 3 shows the experimental setup, which mainly includes the pipe specimen with PZT-5H patches, an impedance analyzer (Agilent 4294A), a function generator (Agilent 33120A), a data acquisition system (NI USB-6363), and a host PC. When the test is carried out using the electromechanical impedance method, through analyzing the preliminary results measured by the impedance analyzer, the effective frequency range was chosen to be 60-90 kHz. During the tests, received electromechanical impedance signals of PZT1, PZT2, PZT3 and PZT4 in each operating condition were respectively collected and analyzed. When the test is carried out using the stress wave method, a sweep sine wave signal generated by the function generator was used, and the sensitive frequency interval (60 kHz-200 kHz) was determined in this research. This sweep sine signal was then used as the excitation source. During the tests to detect crack I, PZT1 was used as an actuator and PZT2, PZT3, PZT4 were used as sensors. During the tests involving crack II, PZT2 was used as an actuator and PZT1, PZT3, PZT4 were used as sensors. The process was automated using the Labview software for signal generation and data acquisition. For each damage condition, the electromechanical impedance method is used first, followed by the stress wave method.
Fig. 3Experimental setup
3. Experimental results and analysis
3.1. Experimental results based on the electromechanical impedance method
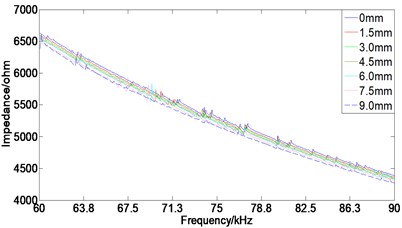
During the test of crack I, seven operating conditions with different crack depths (0 mm-9.0 mm) were investigated. Table 1 depicts each operating condition with its corresponding crack depth. All PZT transducers are used. Test of crack II was performed after the test of crack I, and the operating conditions and monitoring method remained the same. The test results show that the electromechanical impedance changes are the most significant from 60 kHz to 90 kHz. Fig. 4 reflects the impedance spectrum curves of PZT3 in the tests of crack I and crack II. The entire monitoring results received from PZT1, PZT2 and PZT4 are consistent with those received from PZT3 and are not plotted in this paper. As shown in Fig. 4, with the increase of the crack depth, both impedance peaks and peak frequencies decrease. This explains that the electromechanical impedance method is sensitive to damages.
Fig. 4The impedance spectrum curve of a), b) PZT3 and c), d) PZT4
a) Crack I
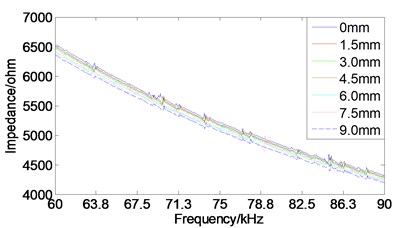
b) Crack II
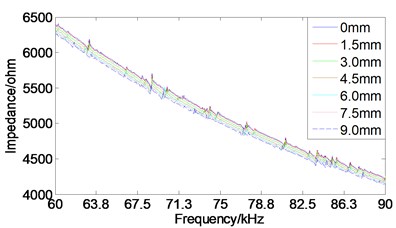
c) Crack I
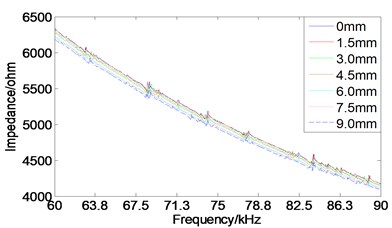
d) Crack II
3.2. Experimental results based on the stress wave method
In the active sensing approach, one PZT transducer is used as an actuator to generate the desired wave to propagate through the host structure, and other distributed PZT transducers are used as sensors to detect the wave response. Cracks or damages inside the structure act as a stress relief in the wave propagation path. The amplitude of wave and the transmission energy will decrease due to the existence of cracks or damages. On the pipeline segment, one PZT was used as the actuator in order to generate the swept sine wave signal. Meanwhile, three PZTs were set up at different locations on the pipeline as sensors to receive the excitation signal from the actuator.
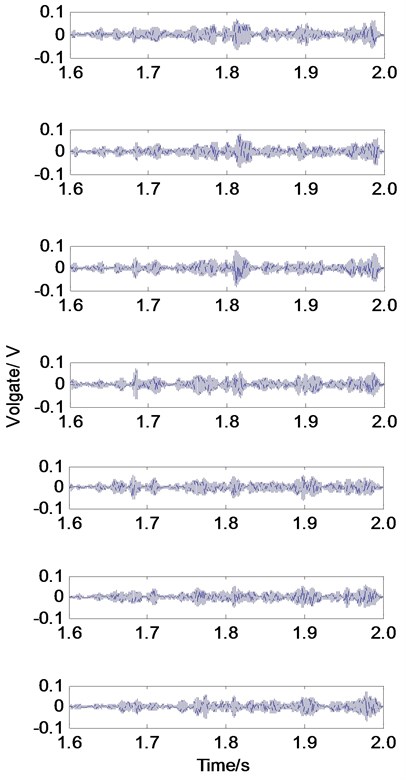
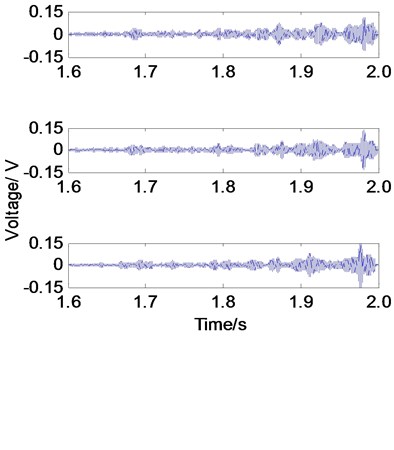
Operating conditions of identification test based on stress wave method are shown in Table 1. During the test of crack I, PZT1 was used as an actuator and PZT2, PZT3, PZT4 were used as sensors. While during the test of crack II, the actuator was PZT2, and the sensors were PZT1, PZT3 and PZT4. The period of the received signal was 2 seconds. Since the amplitude of the peaks of stress wave signals are concentrated in 1.6-2.0 seconds, the stress wave shown in this paper are in this interval (1.6-2.0 seconds). The received stress wave signals of PZT2 and PZT4 during the test of crack I are shown in Fig. 5(a) and Fig.6(a), respectively. In order to compare with identification results of crack I, the received stress wave signals of PZT3 and PZT4 during the test of crack II are shown in Fig. 5(b) and Fig. 6(b). And the received stress wave signals of PZT1 during the test of crack II is shown in Fig. 7. Fig. 5, Fig. 6 and Fig. 7 show that the peak voltages received by PZT sensors decreases with the increase of crack depth. During the test of crack I, the received peak amplitude from PZT2 is greater than those from PZT3 and PZT4, while the received peak amplitude from PZT3 is greater than that from PZT4 during the test of crack II, which concludes that the closer to the excitation source, the more sensitive of received signals. During the test of crack II, the received amplitude of signals peak of PZT1 does not change significantly. It is found that the received signals will not change unless a new damage appears between the excitation sources (PZT2) and the sensor (PZT1). As a result, when a sensor array is used, the location and severity of cracks can be determined by monitoring the sensor signal changes while alternating the actuating PZT actuator and PZT sensors.
Fig. 5The stress wave monitoring results of PZT2 and PZT3
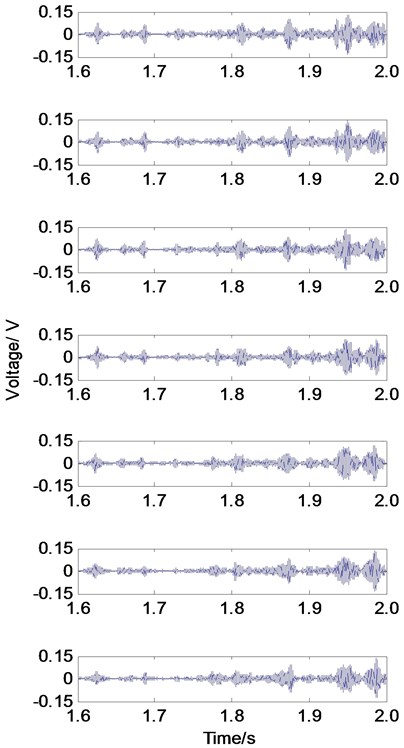
a) PZT2 (Crack I, OC1-7)
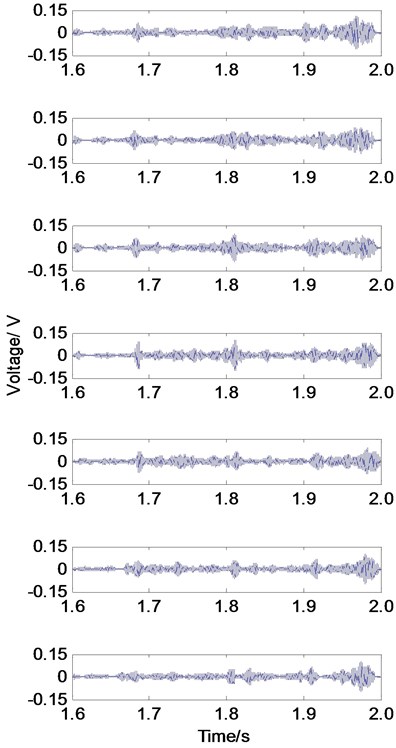
b) PZT3 (Crack II, OC1-7)
4. Damage index and analysis
4.1. Damage index based on the electromechanical impedance method
For this study, the Root-Mean-Square Deviation (RMSD) of the impedance of the PZT patches used as the damage index or indicator, which was first proposed by Giurgiutin and Rogers [26]:
where is a post-damage impedance signature at the th measurement point, and is a health value at the th measurement point.
Fig. 6The stress wave monitoring results of PZT4
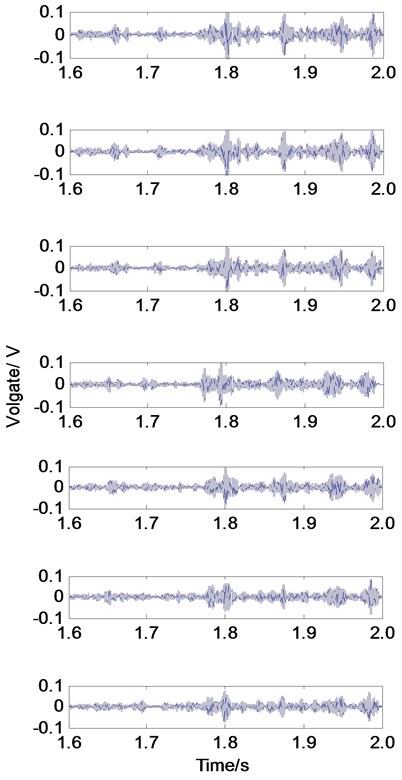
a) PZT4 (Crack I, OC1-7)
b) PZT4 (Crack II, OC1-7)
The experimental results of the impedance based RMSD indices are shown as Fig. 8. As we can see that, the RMSD indices for all PZT sensors increase with the crack depth, and the test results of crack I and crack II exhibit the same trend. The test results of crack I indicate that the PZT1 and PZT2 have higher damage index values than those of PZT3 and PZT4, which indicates that PZT1 and PZT2 are closer to the crack I than PZT3 and PZT4. The test results of crack II indicated that the PZT2 and PZT3 have larger damage index values than those of PZT1 and PZT4, which indicates that PZT2 and PZT3 are closer to the crack II than PZT1 and PZT4. In summary, the experimental results show that the largest damage index value is always associated with sensor that has the shortest distance to the crack, which can be used to quantitatively analyze the pipeline crack damage.
4.2. Wavelet packet energy damage index based on the stress wave method
The crack in the stress wave propagation path functions as a stress relief. Furthermore, the loss of energy received by the PZT sensors is correlated with the severity of the crack. These phenomena are then quantified with wavelet packet analysis, which is used as a signal-processing tool for analysis [27]. The basic principles of this analysis technique are given as follows.
Fig. 7The stress wave monitoring results of PZT1
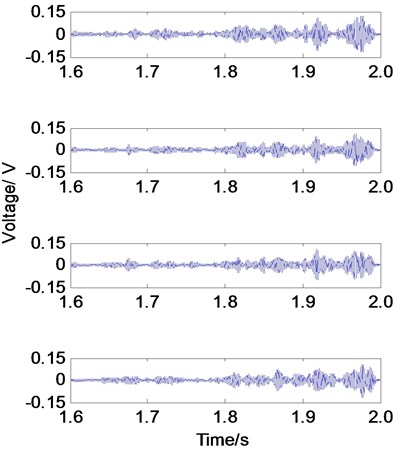
a) PZT1 (Crack II, OC1-4)
b) PZT1 (Crack II, OC5-7)
Fig. 8Damage index RMSD based on electromechanical impedance monitoring results
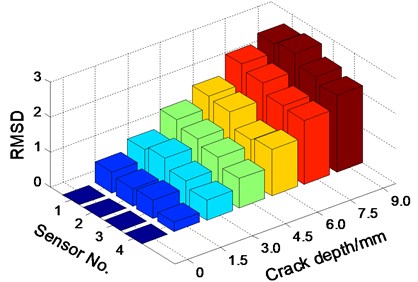
a) Damage index RMSD of crack I
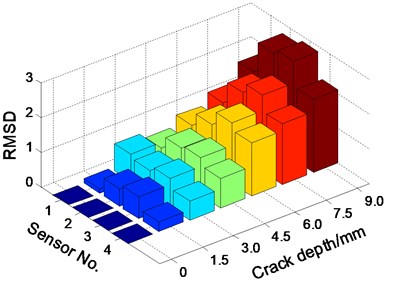
b) Damage index RMSD of crack II
In the proposed health monitoring algorithm, the sensor signal is decomposed by an -level wavelet packet decomposition into signal subsets and is the frequency band. The decomposed subset is written as:
where is the number of sampling data, and the energy of the decomposed signal at time index can be defined as:
The energy vector at time index can be defined as:
Based on the calculation of energy vectors () (Eqs. (3)-(5)), the crack severity index for the sensor signal at time index can be expressed as:
where represents the energy level when this no damage to the specimen.
When the crack width is kept as 1.2 mm, the wavelet packet energy loss (abbreviation WPEL) can be an approximated indicator of the crack severity. Based on the stress wave monitoring data, Fig. 9 shows that WPEL indices of crack I and crack II in each operating condition. It can be seen that the WPEL indices increase with the crack depth. Therefore, the pipeline crack damage can be described by the WPEL index. In the tests of two cracks, the PZT sensor that is nearest to the crack has the highest damage index value, which indicates that the identification results were directly correlated to the locations of the PZT sensors with respect to the crack. In the process of increasing the depth of crack II, the WPEL index of PZT1 did not change, and this shows that crack II damage has no effect on stress wave received by PZT1, from which we can conclude that no new damages are formed between PZT1 and PZT2.
Fig. 9Damage index based on stress wave
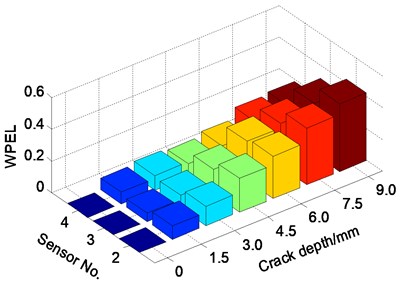
a) Damage index of crack I
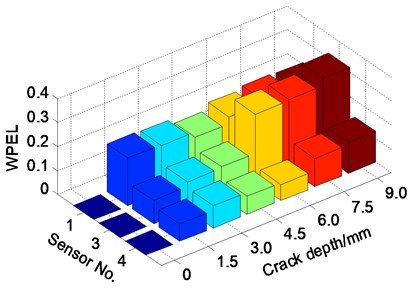
b) Damage index of crack II
5. Conclusions
In this paper, the electromechanical impedance method and the stress wave based active sensing method were used to detect pipeline damages with multi-cracks. For the electromechanical impedance method, the damage index based on RMSD was developed, and for the active sensing method, the damage index based on WPEL was used. The results show that both the RMSD and WPEL indices increase with the increase of the depth of pipeline cracks. In addition, the WPEL index increases with the appearance of new cracks. The experimental results showed that quantitative analysis on crack damage within a certain area can be realized by using electromechanical impedance method, and localization analysis on the pipeline multi-cracks damage can be achieved by stress wave method based on sensor arrays. Localization and quantitative analysis on the pipeline multi-cracks damage is made feasible by using a combination of these two methods.
References
-
Yu Z. F., Zhang W. W., Zhang Z. H., Zhang N. Development trend of China’s gas pipeline and relevant technical problems. Oil and Gas Storage and Transportation, Vol. 31, Issue 5, 2012, p. 321-325.
-
Feng Q. S., Li B. J., Qian K., Liu C. H., Liu H. J. Integrity management program–based pipeline integrity efficiency evaluation method. Oil and Gas Storage and Transportation, Vol. 32, Issue 4, 2013, p. 360-364.
-
Okamoto J., Adamowski J. C., Tsuzuki M. S. G., Buiochi F., Camerini C. S. Autonomous system for oil pipelines inspection. Mechatronics, Vol. 9, Issue 7, 1999, p. 731-743.
-
Pan E., Rogers J., Datta S. K., Shah A. H. Mode selection of guided waves for ultrasonic inspection of gas pipelines with thick coating. Mechanics of Materials, Vol. 31, Issue 3, 1999, p. 165-174.
-
Keshwani R., Bhattacharya S. Design and optimization of eddy current sensor for instrumented pipeline inspection gauge. Sensor Review, Vol. 28, Issue 4, 2008, p. 321-325.
-
Vasic D., Bilas V., Ambrus D. Pulsed eddy-current nondestructive testing of ferromagnetic tubes. Instrumentation and Measurement, Vol. 53, Issue 4, 2004, p. 1289-1294.
-
Tapanes E. Fibre optic sensing solutions for real-time pipeline integrity monitoring. Australian Pipeline Industry Association National Convention, 2001, p. 27-30.
-
Li H. N., Li D. S., Song G. B. Recent applications of fiber optic sensors to health monitoring in civil engineering. Engineering Structures, Vol. 26, Issue 11, 2004, p. 1647-1657.
-
Hou Q., Jiao W., Ren L., Cao H., Song G. Experimental study of leakage detection of natural gas pipeline using FBG based strain sensor and least square support vector machine. Journal of Loss Prevention in the Process Industries, Vol. 32, 2014, p. 144-151.
-
Jia Z. G., Ren L., Li H. N., Ho S. C., Song G. Experimental study of pipeline leak detection based on hoop strain measurement. Structural Control and Health Monitoring, 2014.
-
Mostafapour A., Davoudi S. Analysis of leakage in high pressure pipe using acoustic emission method. Applied Acoustics, Vol. 74, Issue 3, 2013, p. 335-342.
-
Sethi V., Franchek M. A., Song G. Active multimodal vibration suppression of a flexible structure with piezoceramic sensor and actuator by using loop shaping. Journal of Vibration and Control, Vol. 17, Issue 13, 1994, p. 2006-2011.
-
Dugnani R. Monitoring adhesive integrity of disk-shaped transducer by electromechanical impedance. Journal of Intelligent Material Systems and Structures, Vol. 24, Issue 15, 2013, p. 1912-1923.
-
Park G., Cudney H. H., Inman D. J. Feasibility of using impedance-based damage assessment for pipeline structures. Earthquake Engineering and Structural Dynamics, Vol. 30, Issue 10, 2001, p. 1463-1474.
-
Lay-Ekuakille A., Vergallo P., Trotta A. Impedance method for leak detection in zigzag pipelines. Measurement Science Review, Vol. 10, Issue 6, 2010, p. 209-213.
-
Choi S., Song B., Ha R., Cha H. Energy-aware pipeline monitoring system using piezoelectric sensor. Sensors Journal, Vol. 12, Issue 6, 2012, p. 1695-1702.
-
Wang B. F., Chen R. W. Leakage location system for oil pipeline on basis of stress wave detection. Frontiers of Mechanical Engineering in China, Vol. 3, Issue 3, 2008, p. 307-312.
-
Baby S., Balasubramanian T., Pardikar R. J. Ultrasonic study for detection of inner diameter cracking in pipeline girth welds using creeping waves. International Journal of Pressure Vessels and Piping, Vol. 80, Issue 2, 2003, p. 139-146.
-
Guo D., Kundu T. A new sensor for pipe inspection by Lamb waves. Materials Evaluation, Vol. 58, Issue 8, 2000, p. 991-994.
-
Song G., Gu H., Mo Y. L., Hsu T. T. C., Dhonde H. Concrete structural health monitoring using embedded piezoceramic transducers. Smart Materials and Structures, Vol. 16, Issue 4, 2007, p. 959-968.
-
Gu H., Moslehy Y., Sanders D., Song G., Mo Y. L. Multi-functional smart aggregate-based structural health monitoring of circular reinforced concrete columns subjected to seismic excitations. Smart Materials and Structures, Vol. 19, Issue 6, 2010, p. 65026.
-
Yan W., Chen W. Q. Structural health monitoring using high-frequency electromechanical impedance signatures. Advances in Civil Engineering, 2010, p. 1-11.
-
Song G., Li H., Gajic B., Zhou W., Chen P., Gu H. Wind turbine blade health monitoring with piezoceramic-based wireless sensor network. International Journal of Smart and Nano Materials, Vol. 4, Issue 3, 2013, p. 150-166.
-
Kim J. W., Lee C., Park S., Koh K. T. Real-time strength development monitoring for concrete structures using wired and wireless electro-mechanical impedance techniques. KSCE Journal of Civil Engineering, Vol. 17, Issue 6, 2013, p. 1432-1436.
-
Du G., Kong Q., Lai T., Song G. Feasibility study on crack detection of pipelines using piezoceramic transducers. International Journal of Distributed Sensor Networks, 2013.
-
Giurgiutiu V., Rogers C. A. Recent advancements in the electro-mechanical (E/M) impedance method for structural health monitoring and NDE. SPIE 5th International Symposium on Smart Structures and Materials, 1998, p. 1-5.
-
Song G., Gu H., Mo Y. L. Smart aggregates: multi-functional sensors for concrete structures – a tutorial and a review. Smart Materials and Structures, Vol. 17, Issue 3, 2008, p. 33001.
-
Liang C., Sun F. P., Rogers C. A. An impedance method for dynamic analysis of active material systems. Journal of Vibration and Acoustics, Vol. 116, Issue 1, 1994, p. 120-128.
Cited by
About this article

This research reported in this paper was partially supported by the Major State Basic Research Development Program of China (973 Program, No. 2015CB057704), the National Natural Science Foundation of China (Nos. 51378077, 51478080 and 51278084), Petro China Innovation Foundation (No. 2011D-5006-06050 and Scientific Research Project Foundation of Hubei Provincial Department of Education (No. D20131205).
