Abstract
This article appraises the seismic performance of a new braced steel structural system called elliptic braced moment resisting frame (ELBRF). Apart from improving the behavior of a structure, ELBRF is found non-problematic for the bracing system in a given architectural space. In this study, a single cycle time has been used for evaluating the proposed ELBRF. Here, methods of seismic design of structures as well as effective parameters in the seismic design of steel braced including ductility factor, overstrength coefficient and behavior factors, which were obtained by using capacity curves, have been presented through an adaptive pushover analysis (APA). Result of the nonlinear analysis showed that the strength and capacity of energy dissipation in the elliptic bracing system (ELBRF) is more than the system of special moment resisting frames (SMRF), coaxial braced frame (CBF) X-Braced, Inverted-V Braced CBF. Likewise, the permitted relative displacement, where the braced frame reaches to step buckling, is more in ELBRF.
1. Introduction
Special steel moment resisting frames (SMRF) and coaxial braced frame (CBF) are normally used in the structures with the aim to make them resist and transfer gravitational and lateral loads of wind and earthquakes. As shown in Fig. 1, structures with SMRF are causing an appropriate structural plasticity under the lateral load [1-5]. Also, in this design, there are limited use of essential parameters such as the excessive relative displacement due to high flexibility of the structure and the inevitable stress concentration at the weld connecting columns and beams.
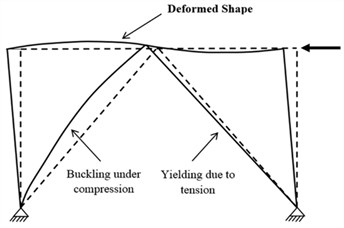
The improved stiffness in order to reduce the excessive structural deformation can be achieved in the concentrically braced frames (CBF). As Fig. 2 shows, the moment bracing parts are added to SMRF, despite a diminishing stiffness in this system, forming the lower CBF would prevent the use of such a design since the seismic performance is an important factor [6-8].
In the CBF design, when bracing members reach to the buckling mode, they are more prone to the function performance deterioration. Previous studies have shown that buckling bracing members in CBF suffered significant losses in structural strength as well as their ability to dissipate energy. With regard to the deformation caused by the buckling out of plane bracing, the damage to connecting sheet and twisting after the subsequent failure of the structural beams also prevents unused structure and functions the architecture [9, 10]. As such, it is essential to find a solution in order to improve the braced frame structure design to achieve higher performance as well as to enhance the architectural capabilities.
Another form of structural reforms in moment frames is inserting elements called knee braced moment resisting frame (KBRF) at the corner of beams and columns. In this system, the end of the bracing, rather than connecting to the confluence of beams and columns, is connected to the point of a knee member between beams and columns or pillars and abutments. Here, the stiffness is provided through the diameter and plasticity of the members by submitting to the bending of the knee. As Fig. 3 shows, the use of KBRF could improve the structural stiffness as well as the energy dissipation [11-16]. Although, the application of this type of bracing encounters with some limitations in design codes due to appearance of plastic hinge in the columns.
Fig. 1SMRF structure subjected to lateral load
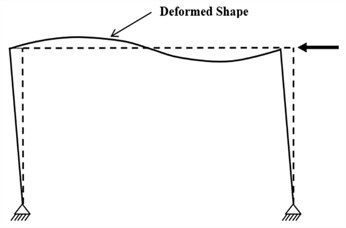
Fig. 2CBF structure subjected to lateral load
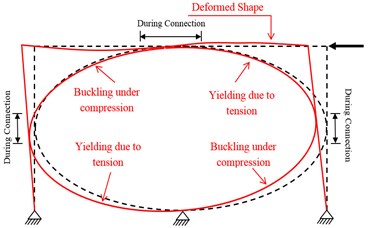
A new structural form that is being proposed in this paper and that leads to higher productivity in the design is the use of elliptic braced moment resisting frames (ELBRF) in the middle of the frame. Using the adaptive pushover analysis (APA), ductility factor, added resistance and behavior coefficients were calculated. Further, the hysteretic analysis helped assess the energy dissipation capacity. In addition, the findings were compared with the results of various other elliptic systems and hence; it was found that the ELBRF system works better in terms of its structural stiffness and the energy dissipation.
In this study, the elliptic bracing to beam and column has been taken into account in the form of fusion splicing. The proposed braced steel structure can be used for different modes of buckling like buckling in-page, in accordance with the required stiffness under extreme loads, which is designed in a way to easily replace the elliptic brace elements the moment the beam reaches to the buckling limit.
Fig. 3KBRF structure subjected to lateral load
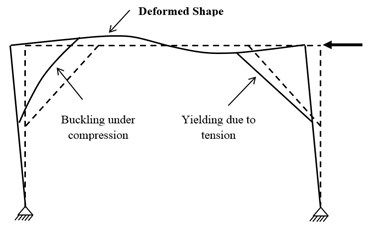
Fig. 4ELBRF structure subjected to lateral load
2. Introducing the elliptic braced frame
In the proposed system, elliptic braced moment resisting frames have been used in the middle of the frame in a way that they connect at an appropriate length of beam and column and are inscribed inside the mouth (Fig. 4). One of the significant advantages of presenting this new structural system is to do away with architectural problems.
To determine the performance of ELBRF, in the modelling, one-story one-bay frame geometry as shown in Fig. 5 has been used. In addition, the geometrical characteristics of a one-story steel frame and the seismic performance knee brace KBRF were used to verify the analysis processes and the acquired [17]. In the modeling of beams and columns, sections ASTM A36 H 175×175×7.5×11 and H 250×250×9×14 were used respectively, and in the sections of the elliptical bracing frame, ASTM A36 H100×100×6×8 was modeled. Tensions yielded for beam, columns and elliptic bracing were 310 MPa, 324.6 MPa and 350.8 MPa, respectively.
Materials used in the structural modeling were complete plastic of Isotropic Hardening types. The profile of those materials is presented in Table 1. The boundary condition was considered under elliptic bracing frame in the middle of the joint. In other words, the boundary condition at the point of support columns clamped once as a fulcrum and again as the detailed fulcrum. The beam-column connection was considered in all cases so that the elliptic bracing effect could be evaluated. The elements used in the model were C3D8R (An8-node linear brick). Here, the elements of columns, beams and elliptic bracing were 0.055 (m), 0.055 (m) and 0.04 (m) in size, respectively.
The cyclical cycle [18] in the in-page buckling condition has been used in analyzing frames with different modes such as ELBRF, SMRF, knee braced frame KBRF, coaxial X-CBF Braced and Inverted V-Braced CBF.
The cyclic loading at beam-column connections were applied in accordance with Fig. 5. The reason of the application of this loading pattern in the analysis of ATC-24 [18] frames was aimed at creating hysteresis loops in order to study energy absorption in the frame and control of deterioration and decay resistance in ELBRF and their comparison with rest of the proposed frames.
Table 1Material properties
Element | (MPa) | (MPa) | |
Beam | 200,000 | 324.6 | 0.26 |
Column | 200,000 | 350.8 | 0.26 |
Elliptic brace | 200,000 | 310 | 0.26 |
Fig. 5Geometrical details of elliptic bracing frame
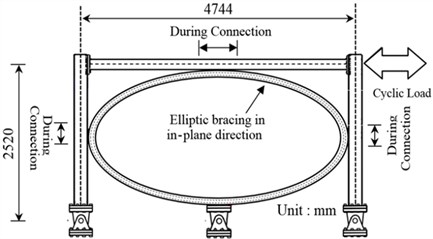
Fig. 6Load history [18]
![Load history [18]](https://static-01.extrica.com/articles/16858/16858-img6.jpg)
3. Analysis procedure
In this research, the finite element analysis, ABAQUS [19], was used to model and evaluate different structural bracing with defining approximation design. As explained before, braced elements are welded rigidly with beams and columns with high strength which were simultaneously modeled. Past studies have indicated that the primary defect in bracing members is essential to adequately assess the structural performance [20-22]. This amount is usually considered in the 1/1500 long bracing frame.
3.1. Hysteresis analysis (Energy dissipation)
Load curve – frame deformation under reciprocating load is called hysteresis curve. This curve shows the inelastic behavior of a system and is significantly affected by the materials used and the type of structural system hence; can be important information on the dynamic characteristics of the structure, energy, and behavior of structure when force is applied to it.
Structural systems often indicate their nonlinear behavior against natural stimulation such as earthquakes. In this case, return forces of structures show a considerable hysteretic behavior. The natural essence of these nonlinear forces cannot be visualized with displacement and speed. Accordingly, various models from solving differential equations achieved by considering hysteretic forces due to their dependence on time. Bouc-Wen [23] model was achieved through the Structural System Consultants. Due to its diversity, this model has been identified as an effective one and frequently used in the civil engineering as multi-degree of freedom (MDOF) and building and frames as well as two and three-dimensional systems. Bouc-Wen [23] system is also used to depreciate forces in steel structures.
3.1.1. The calculation of the energy dissipated in the frame
By observing the hysteresis curve of a structure or related parts, a lot of information can be obtained. In fact, the area below the hysteresis curve is the amount of energy dissipated in the structure under loads. The higher the level, the higher ductility and the structure would import more potential in dissipating the energy. The lack of design increases ductility is a point that can be of utmost importance for quake-prone regions.
In fact, the energy absorbed by the system under hysteretic load is the dissipated energy. This energy is acquired in all graphs by measuring the area under the curve. This amount of energy is calculated with the following equation:
In which, is proportion flow, flow (elastic), stiffness, flow force, flow displacement and is hysteresis parameter that usually known as the hysteresis displacement and is the natural square frequency in nonlinear system where J/kg is its unit.
The dissipated energy is a good yardstick to measure the damage of structures under stress that in fact is the reflection of the load history.
3.2. Pushover nonlinear static analysis
Previous studies of elastic analysis were the main tool in the seismic structural design. However, such elastic analysis is not enough considering the structural behavior against earthquakes. On the other hand, nonlinear analyses yield accurate results despite being complicated are time-taking. Such analyses should indicate the structural needs and interpret the accurate results, in an accelerated time history. For long, researchers were trying to develop a fast and efficient method to simulate nonlinear behavior of structures under earthquake loads. The idea of the pushover analysis was propounded by Freeman for the first in 1975, for systems with one-degree freedom [24-27]. Thereafter, other researchers extended this approach to multi-degree freedom.
In many seismic design codes, the equivalent static method is expressed based on the use of “response modification factor” (sometimes called as a force reduction factor). The design loads are achieved by reducing/dividing seismic loads based on the factor. Reduction in seismic loads resulted in structure’s entering into the elastic range. As such, in order to the earthquake energy dissipation, structures have to bear a relatively large elastic deformation. Structural capacity to resist seismic loads is dependent on its deformation capacity in the elastic range or its formability capacity. For a system with idealized bilinear behavior (Fig. 7), this curve is obtained by using a nonlinear static analysis. This curve includes horizontal and vertical axes representing relative lateral displacement and structure base shear factor, respectively. Ductility is defined as the ratio of the maximum displacement to the displacement of the yield point. Structures with higher force reduction factor, , require higher ductility capacity . Thus, and are related factors and play an important role in the structures’ energy waste mechanism.
Fig. 7Capacity curve for a structure along with its bilinear idealization in pursuit of seismic demand parameters [28]
![Capacity curve for a structure along with its bilinear idealization in pursuit of seismic demand parameters [28]](https://static-01.extrica.com/articles/16858/16858-img7.jpg)
The fundamental problem of the conventional nonlinear pushover analysis which is present in the current regulations and guidelines is that such methods are generally limited to a single mode response and are unable to alter the effects of higher modes or modal characteristics of the structure of the lodge members. At time of the application of the lateral load to structure in the pushover analysis, members especially in the joints gradually lose their elastic resilience and enter the area of non-elasticity. By calculating “members’ momentary stiffness” and consequently the “total stiffness matrix” in every step of the analysis when applying lateral load on the structure, we see a decline in the structural stiffness. This not only alters the structural response to the ground movement but also changes the distribution of inertia forces in the height of the structure. In order to accomplish these assumptions, an adaptive pushover analysis is needed. Likewise, considering reduction in the structural elements stiffness, the loading pattern should be updated in each step.
To address the shortcomings of the conventional pushover analysis, Antoniou & Pihno suggested the adaptive pushover method based on load patterns: force-based adaptive pushover analysis (FAPA) [29, 31]; and displacement based adaptive pushover analysis (DAPA) [30, 31].
3.3. -factor design approach
So far, researchers have proposed various methods to extract the factor. These methods generally fall into two main groups of European and American approaches. In the current study, one of the most popular methods i.e. Yvang method is adopted. Fig. 7 highlights the proposed parameters used in Yvang [32, 33].
Fig. 7 shows changes in the base shear structures against the total story displacement in a pushover analysis. In this figure, the pushover curve is equivalent to the bilinear ideal curve (idealized response) which represents a complete elastic-plastic behavior.
3.3.1. Structural ductility factor
The overall ductility ratio of the structure is that is defined as the maximum lateral displacement ratio corresponding to the submission . In other words, the structure bearing non-elastic and plastic behavior without collapsing is called the ductility factor:
3.3.2. Ductility reduction factor
This factor reduces the seismic forces from level to level in the pushover curve. In fact, due to ductility, building will have the capacity for hysteresis energy dissipation. Due to the energy dissipation capacity, the elastic design can be reduced to the level of yield strength :
3.3.3. Over-strength coefficient
This factor leads to transmitting the level of design force from to . In fact, the Strength corresponding to region between the actual level of surrendered structures and the design force are expressed by the ultimate limit state method:
3.3.4. Ratio to
Depending on the definition of stress (allowable or ultimate) in various design codes (ASD, LRFD), the factor can have different values. As a whole, the allowable stress factor as the structural strength ratio (cutting base) that is the first plastic hinge in the structure is to resist the allowable stress design (:
Therefore, correction response modification factor () in authorized seismic regulations ASD (Allowable Stress Design) and response modification factor () in LRFD (Load and Resistance Factor Design) is defined as follows:
4. Results and discussion
4.1. Energy dissipation
In order to assess the strength and energy dissipation capacity and the results acquired from hysteretic analysis in steel frames with the elliptic bracing ELBRF under cyclic load cycle were compared with the results of the special moment resisting frame system SMRF, bending the frame with a backrest joint braced frame coaxial X-Braced CBF and Inverted V-Braced CBF and steel frames with knee brace KBRF. Figs. 8-9 show the results of this comparison both with fixed fulcrum and support in the form of joint. The area under the hysteresis curve for steel braced frames both with fixed backrest and detailed forms are given in Fig. 10 and Fig. 11. Parameters obtained from hysteresis curves such as strength deterioration, stiffness deterioration and P- effects are presented in Table 2 and Table 3.
Area below the hysteresis curve that represents the amount of dissipated energy in the ELBRF frame due to the earthquake compared to SMRF, Inverted V-braced CBF with pinned support frame with the 250 mm displacement respectively are 22.81 % and 15 % and compared to KBRF, it has 2.3 times more. Likewise, the amount of dissipated energy in the ELBRF frame compared to SMRF and KBRF relying on the 250 mm displacement is respectively 34.14 % and 9.86 % percent higher.
Fig. 8Comparison of the results of hysteresis curve of moment braced frames with fixed backrest
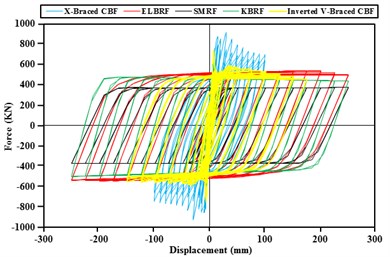
Fig. 9Comparison of the results of hysteresis curve fulcrum moment braced frames
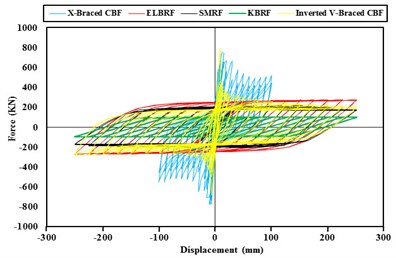
Fig. 10Comparison of hysteresis curves of moment braced frames with fixed fulcrum
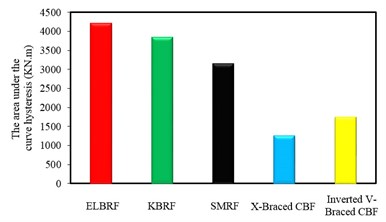
Fig. 11Comparison of hysteresis curves of moment braced frames with detailed fulcrum
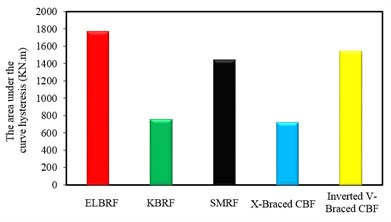
The dissipated energy in ELBRF is 2.4 which are equal to the Inverted V-braced CBF with fixed support frame. But there is one difference that the shift in Inverted V-braced CBF is equal to 175 mm. Likewise, the ratio of dissipated energy in ELBRF compared to X-Braced CBF with fixed and pinned supports are respectively 3.4 and 2.47 times. The difference is that its displacement is equal to 100 mm.
Hysteresis curve rings gradient in continual load cycles in ELBRF has constant load unlike the X-Braced CBF and Inverted V- Braced CBF frame. In other words, the ELBRF system doesn’t have stiffness consumption. On the other side, the lateral stiffness of ELBRF is higher than the SMRF and KBRF frames but lower than X-Braced CBF and Invented V-braced CBF frames. In other words, the ELBRF system has suitable behavior with regard to its lateral stiffness.
Hysteresis curve rings height in continual load cycles in ELBRF has constant load unlike the X-Braced CBF and Inverted V-Braced CBF frame. In other words, the ELBRF system doesn’t have strength deterioration although it has more or same like KBRF and SMRF frames.
Apart from the above comparative results, the allowed displacement is higher in elliptic bracing ELBRF when reaches the point of buckling up. Similarly, the number of hysteresis curve cycles represents the acceptable performance of this system against earthquake occurrences.
Table 2Parameters moment frames braced by supports fixed hysteresis curve
Parameters | ELBRF | KBRF | X-Braced CBF | SMRF | Invented V-Braced CBF |
Resistance consumption | No | No | Yes | No | Yes |
Stiffness consumption | No | No | Yes | No | Yes |
P-Delta effects | No | No | Yes | No | Yes |
Table 3Parameters moment frames braced by detailed support hysteresis curve
Parameters | ELBRF | KBRF | X-Braced CBF | SMRF | Invented V-Braced CBF |
Resistance consumption | No | No | Yes | No | Yes |
Stiffness consumption | No | No | Yes | No | Yes |
P-Delta effects | No | No | Yes | No | Yes |
4.2. Ductility factor, over strength coefficient and behavior factors
To assess the results of the nonlinear pushover analysis of steel bracing frames with elliptic- shape ELBRF under cycle load cycle, they were compared with the results of special bracing frames SMRF, bracing frame with a pinned support, coaxial X-Braced CBF and Inverted V-Braced CBF as well as the frame with knee brace KBRF. Figs. 12-13 highlight the results of this comparison in the form of fixed and pinned supports.
With due attention to the obtained pushover curve and linear equations curve in the above moment frame, the parameters of structural response modification factor, ductility factor, ductility reduction factor, over-strength factor, ratio from to and effective stiffness are presented in Table 4 and Table 5 both with fixed and the pinned support conditions.
Fig. 12Comparison of the results of pushover curve in braced moment resisting frames at a fixed support
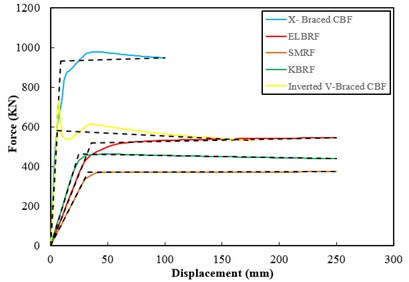
Fig. 13Comparison of the results Pushover curve in braced moment resisting frames at the pinned support
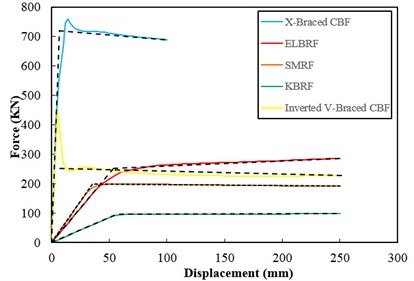
Table 4Results of different pushover analysis, ductility ratios, μ and over strength factors, Ω, Rμ and R factors for braced moment resisting frame
Frame | (mm) | (mm) | (mm) | (KN) | (KN) | (KN) | |||||
ELBRF | 13.3 | 34.8 | 250 | 199.5 | 520.7 | 544.8 | 7.2 | 2.61 | 3.45 | 12.9 | 9 |
KBRF | 12.2 | 24.4 | 250 | 231.2 | 462.3 | 438.9 | 10.2 | 2 | 3.66 | 10.5 | 7.32 |
SMRF | 12.9 | 32.8 | 250 | 146.6 | 370.4 | 373.7 | 7.6 | 2.53 | 3.26 | 11.8 | 8.25 |
X- CBF | 4.14 | 8.71 | 100 | 445.8 | 936.3 | 948.1 | 11.4 | 2.1 | 3.74 | 11.3 | 7.8 |
Inverted V-CBF | 2.52 | 5.95 | 175 | 247 | 582.9 | 532.8 | 29.4 | 2.36 | 3.16 | 10.7 | 7.47 |
Table 5Results of different pushover analysis, ductility ratios, μ and over strength factors, Ω, Rμ and R factors for braced moment resisting frames with pinned support
Frame | (mm) | (mm) | (mm) | (KN) | (KN) | (KN) | |||||
ELBRF | 25.3 | 53.6 | 250 | 112.7 | 251.3 | 286.3 | 4.6 | 2.23 | 3.51 | 11.3 | 7.82 |
KBRF | 29.7 | 56.5 | 250 | 50.91 | 56.74 | 97.73 | 4.42 | 1.9 | 3.42 | 9.36 | 6.5 |
SMRF | 15 | 35.4 | 250 | 84.1 | 198.3 | 191.2 | 7.06 | 2.36 | 3.14 | 10.3 | 7.1 |
X- CBF | 3.61 | 6.72 | 100 | 385.8 | 717.6 | 689.4 | 14.8 | 1.86 | 3.73 | 9.9 | 6.9 |
Inverted V-CBF | 2.81 | 5.2 | 250 | 242.3 | 448.3 | 227.9 | 48 | 1.85 | 3.35 | 8.92 | 6.2 |
Considering the comparative pushover analysis based on displacement, not only helps achieve more precise results (profiles drift classes and capacity curves), but makes the evaluation of all structural components clear and logical.
The acquired response modification factor from the comparative pushover analysis implementation static in this study, on an average, for ELBRF, SMRF, Inverted V-braced CBF and KBRF with pinned support and the 250 mm displacement are 7.82, 7.1, 6.2 and 6.5, respectively. For X-Braced CBF with pinned support along with 100mm displacement, it is 6.9.
Response modification factor obtained from the pushover analysis implementation static on an average for the moment frames, ELBRF, SMRF and KBRF with fulcrum and with the displacement of 250 mm, are equal to 9, 8.25, 7.32, respectively and for a moment frame X-Braced CBF with the displacement of 100mm equals to 7.8 for moment frames Inverted V-braced CBF with the displacement of 175 mm is obtained 7.47.
The ductility factor of ELBRF bracing frames is similar to SMRF and KBRF frames. Higher value of the ductility factor in the Inverted V-braced CBF frame is because of the lack of gravity load in the frame analysis.
4.3. Plastic hinges formation
Based on limit states, while the design is typically an approach with two levels that includes consideration of non-stop services and ultimate strength limit state for a building, the performance-based design can be seen as a multi-level approach that pays special attention to the performance of a building in the central states related to issues such as the occupation of space and safety standards. With the advent of the performance-based approach for a design, there is a need to develop the appropriate analysis tools, as well. As such, the pushover nonlinear analysis is an attractive choice in this field taking into account its simplicity and ability to identify components required at the system-level, with accuracy comparable to the dynamic [34-38].
In the current study, the pushover analysis is developed on post-elastic model nonlinear materials that make it possible to study initial submission and gradual progressive plastic behavior of structural elements separately for the entire system. This method is also applicable for analyzing inelastic or rigid frame construction with simple ideal connections and the method has been taken in principle to analyze elastic frame with semi-rigid connections.
Since, one of the goals of the design in the current study is to enhance the structural performance and maintain the integrity of different parts i.e. beams and columns, as such the proposed elliptic brace to buckling or yield round has been designed in a way that it reaches to the plastic stage before beams or columns.
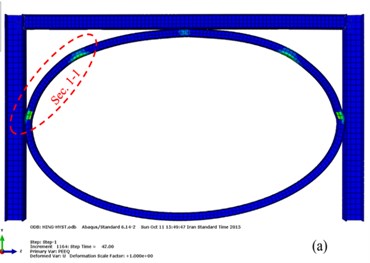
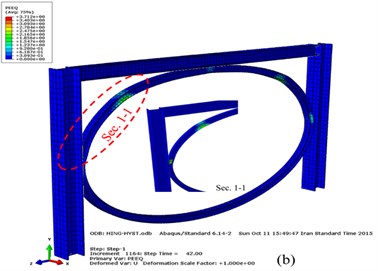
Fig. 14Plastic hinges in the moment frame with elliptic bracing ELBRF: a) Front view b) Side view
One potential of the plastic hinge is that the hinge point located on a part of the frame behaves potentially like a semi-rigid connection with the load-deformation treats with predefined nonlinear specifications. The computational process of the pushover analysis is an algorithm that is crated for inelastic nonlinear analysis of rigid frames but is also finely applied for non-linear elastic analysis of semi-rigid frames.
Fig. 14 indicates the results of the plastic hinge formation obtained through the pushover analysis at the end of cyclic load [19] during the 42 (s) for the moment frame with elliptic-shaped brace. As shown, the plastic hinges are created on an elliptic bracing member that does not incur any damage to beam and column.
5. Conclusions
The study focused on seismic performance assessment of braced moment resisting frames ELBRF and its comparison with the widely used systems such as SMRF, X-Braced CBF, Inverted V-braced CBF and KBRF hysteresis analysis and nonlinear pushover analysis.
One of the advantages of ELBRF is that it doesn’t have problem with the architectural space in bracing systems.
With a comparative analysis of hysteretic results, it was observed that the energy absorption ratio in ELBRF system was more than the other conventional structural systems. Stiffness and deterioration of resistance were not observed in any of the models tested in this system. The lateral stiffness of frames with ELBRF was greater than the lateral stiffness of frames with SMRF and KBRF but was similar and lesser than the system with X-Braced CBF and Invented V-braced CBF. In other words, frames with ELBRF have better behavior in terms of lateral stiffness.
The behavior factor () in the ELBRF system was 7.82 and 9 for backrest joint and backrest clamp, respectively that are more compared to other systems studied so far.
Using different levels and systems in structural designs has have impact on the structural behavior. However, this article has taken into account geometry of frames, dimensions and the manner to connect beam-column sections in all cases in order to assess and compare the performance behavior of ELBRF to SMRF, X-Braced CBF, Inverted V-braced CBF and KBRF.
The plastic hinges in X-Braced CBF and Invented V-braced CBF are respectively with columns, beams, braces and in KBRF and ELBRF bracing frames; these are bracing members, beams and columns. Therefore, the formation and development of plastic hinges and mechanisms type help ELBRF frame works better during earthquakes. In other words, the pushover curve in ELBRF will result better ductility and more appropriate behavior against the unseen natural calamities.
Beams at the Invented V-CBF braced frame encounter sharp drop after the submission hence, will incorporate intense damage and injuries to the building. As such, ELBRF have an advantage over the Invented V-braced CBF frames.
The elliptic design has particular importance and it sections should be designed taking plastic criteria into considerations. In a nutshell, the proposed elliptic bracing ELBRF is highly recommended in order to improve and strengthen the structure.
References
-
Ciutina A. L., Dubina D. Seismic behaviour of steel beam-to-column joints with column web stiffening. Steel and Composite Structures Vol. 6, Issue 6, 2006, p. 493-512.
-
Lee C. H., Jeon S. W., Kim J. H., Uang C. M. Effects of panel zone strength and beam web connection method on seismic performance of reduced beam section steel moment connections. Journal of Structural Engineering, Vol. 131, Issue 12, 2005, p. 1854-1865.
-
Saravanan M, Arul Jayachandran S, Marimuthu V, Prabha P. Advanced analysis of cyclic behaviour of plane steel frames with semi-rigid connections. Steel and Composite Structures, Vol. 9, Issue 4, 2009, p. 381-395.
-
Chou C. C., Tsai K. C., Wang Y. Y., Jao C. K. Seismic rehabilitation performance of steel side plate moment connections. Earthquake Engineering and Structural Dynamics, Vol. 39, 2010, p. 23-44.
-
Hsu H. L., Tsao J. W. Flexural–torsional performance of thin-walled steel hollow box columns subjected to a cyclic eccentric load. Thin-Walled Structures, Vol. 45, Issue 2, 2007, p. 149-158.
-
Lee K., Bruneau M. Energy dissipation demand of compression members in concentrically braced frames. Steel and Composite Structures, Vol. 5, Issue 5, 2005, p. 345-358.
-
Longo A., Montuori R., Piluso V. Plastic design of seismic resistant V-braced frames. Journal of Earthquake Engineering, Vol. 12, Issue 8, 2008, p. 1246-1266.
-
Tremblay R., Archambault M. H., Filiatrault A. Seismic response of concentrically braced steel frames made with rectangular hollow bracing members. Journal of Structural Engineering, Vol. 129, Issue 12, 2003, p. 1626-1636.
-
Martinelli L., Mulas M. G., Perotti F. The seismic response of concentrically braced moment resisting steel frames. Earthquake Engineering and Structural Dynamics, Vol. 25, Issue 11, 1996, p. 1275-1299.
-
Yoo J. H., Lehman D. E., Roeder C. W. Influence of connection design parameters on the seismic performance of braced frames. Journal of Constructional Steel Research, Vol. 64, Issue 6, 2008, p. 607-623.
-
Kim J. K., Seo Y. G. Seismic design of steel structures with buckling-restrained knee braces. Journal of Constructional Steel Research, Vol. 59, Issue 12, 2003, p. 1477-1497.
-
Clement D. E., Williams M. S. Seismic design and analysis of a knee braced frame building. Journal of Earthquake Engineering, Vol. 8, Issue 4, 2004, p. 523-543.
-
Zhang L., Tong G. S. Out-of-plane stability of simply supported beams with knee braces. Journal of Constructional Steel Research, Vol. 63, Issue 2, 2007, p. 175-181.
-
Hsu H. L., Juang J. L., Chou C. H. Experimental evaluation on the seismic performance of steel knee braced frame structures with energy dissipation mechanism. Steel and Composite Structures, Vol. 11, Issue 1, 2011, p. 77-91.
-
Shin J., Lee K., Jeong S. H., Lee H. S., Kim J. K. Experimental and analytical studies on buckling-restrained knee bracing systems with channel sections. International Journal of Steel Structures, Vol. 12, Issue 1, 2012, p. 93-106.
-
Wongpakdee N., Leelataviwat S., Goel S. C., Liao W. C. Performance-based design and collapse evaluation of buckling restrained knee braced truss moment frames. Engineering Structures, Vol. 60, Issue 2, 2014, p. 23-31.
-
Hsu H.-L., Li Z.-C. Seismic performance of steel frames with controlled buckling mechanisms in knee braces. Journal of Constructional Steel Research, Vol. 107, 2015, p. 50-60.
-
Guidelines for Cyclic Seismic Testing of Components of Steel Structures for Buildings. Report No. ATC-24, Applied Technology Council, Redwood City, CA.,1992.
-
ABAQUS Analysis User’s Manual. ABAQUS Inc., 2013.
-
Remennikov A. M., Walpole W. R. Analytical prediction of seismic behavior for concentrically-braced steel systems. Earthquake Engineering and Structural Dynamics, Vol. 26, Issue 8, 1997, p. 859-874.
-
Uriz P., Filippou F. C., Mahin S. A. Model for cyclic inelastic buckling of steel braces. Journal of Structural Engineering, Vol. 134, Issue 4, 2008, p. 619-628.
-
Yoo J. H., Roeder C. W., Lehman D. E. Simulated behavior of multi-story X-braced frames. Engineering Structures, Vol. 31, Issue 1, 2009, p. 182-197.
-
Kwok N. M., Ha Q. P., Nguyen M. T., Li J., Samali B. Bouc-Wen model parameter identification for a MR fluid damper using computationally efficient GA. ISA Transactions, Vol. 46, 2007, p. 167-179.
-
Freeman S. A., Nicoletti J. P., Tyrell J. V. Evaluations of existing buildings for seismic risk – a case study of Puget Sound Naval Shipyard, Bremerton, Washington. Proceedings of the First U.S. National Conference on Earthquake Engineering, Oakland, California, 1975, p. 113-122.
-
Shibata A., Sozen M. A. Substitute structure method for seismic design in reinforced concrete division. Journal of Structural Engineering, Vol. 102, Issue 1, 1976, p. 1-18.
-
Saiidi M., Sozen M. Simple nonlinear seismic analysis of R/C structures. Journal of Structural Engineering, Vol. 10, Issue 5, 1981, p. 937-952.
-
Fajfar P., Fischinger M. A. A method for non-linear seismic damage analysis of regular buildings. Proceedings of the 9th WCEE, Tokyo-Kyoto, Japan, Vol. 5, 1998, p. 111-116.
-
Tasnimi A., Masoumi A. Derivation of Response Modification Factors for Concrete Moment Resisting Frames. Building and Housing Research Center, Publication No. 4361, 2006.
-
Antoniou S., Pinho R. Advantages and limitations of adaptive and non-adaptive force-based pushover procedures. Journal of Earthquake Engineering, Vol. 8, Issue 4, 2004, p. 497-522.
-
Antoniou S., Pinho R. Development and verification of a displacement-based adaptive pushover procedure. Journal of Earthquake Engineering, Vol. 8, Issue 5, 2004, p. 643-661.
-
Izadinia M., Rahgozar M. A., Mohammadrezaei O. Response modification factor for steel moment-resisting frames by different pushover analysis methods. Journal of Constructional Steel Research, Vol. 79, 2012, p. 83-90.
-
Uang C. M. Establishing R (or Rw) and Cd factors for building seismic provisions. Journal of Structural Engineering, Vol. 117, Issue 1, 1991, p. 19-28.
-
Tasnimi A., Masoumi A. Derivation of Response Modification Factors for Concrete Moment Resisting Frames. Building and Housing Research Center, Publication No. 4361, 2006.
-
Faella G., Kilar V. Asymmetric multistory R/C frame structures: push-over versus nonlinear dynamic analysis. Proceedings of 11th European Conference on Earthquake Engineering, Rotterdam, 1998, p. 1-10.
-
Kilar V., Fazfar P. Simple push-over analysis for asymmetric buildings. Earthquake Engineering and Structural Dynamics, Vol. 26, 1997, p. 233-249.
-
Lawson R. S., Vance V., Krawinkler H. Nonlinear static push-over – analysis, why when and how? Proceedings of the 5th US National Conference on Earthquake Engineering, Chicago, Illinois, Vol. 1, 1994, p. 283-292.
-
Moghadam A. S., Tso W. K. 3-D push-over analysis for eccentric buildings. Proceedings of the 11th European Conference on Earthquake Engineering, Montreal, 1995, p. 285-292.
-
Saidi M., Sozen M. A. Simple nonlinear seismic analysis of R/C structures. Journal of the Structural Division, Vol. 107, Issue 5, 1981, p. 937-952.
Cited by
About this article

