Abstract
Modern racing yachts must have extreme performance and reliability in all conditions. Meeting these demands is possible through the use of new materials. The occurrence of lightweight yet durable Carbon masts allowed to increase their height without having to increase the diameter, thereby reducing the impact of the mast on the change of the speed of flow around and distortion. In addition to the advantages mentioned composite pole has also the characteristics which lead to great difficulties both in the manufacturing process and subsequent operation. There is a real need for a diagnosis of this type of objects, which gives information about any construction defects, and above all the information about damages developing during the operation.
1. Introduction
The most dangerous critical cross-section of a composite mast due to the defect is the break point of the local structure of the composite. Diagnostics of the mast-rigging system may be of great importance in terms of its practicality, e.g. reducing exploitation costs and preventing serious defects, which take place as a result of uncontrolled wear and tear. Serious defects carry considerable expenditures (longer docking, serious renovations). Technical condition assessment of mast will ensure a high level of security during the use, providing that the changes leading to defects which may be dangerous are detected earlier.
In this case it is a constructional hole for bolt which fixes the crosstress. Providing that such a hole is expanding during the exploitation under the influence of dynamic deformations and the defect propagation takes place, the mechanism of change in the hole diameter is reproduced in another experiment. That is why the register of vibrations and deformations of mast section was done. The mast section is placed closest to the hole near the crosstress, where the defect and its propagation usually take places. Vibration responses to extortion with static displacement and force impulse were examined. These measures were carried out for different diameters of holes (diameters: 2, 4, 6 and 8 mm and in the case when there was no hole) and for different tensions of rigging. The examined mast was fixed in a way that one end of the mast was fixed, whereas the second one was free.
For the purpose of the experiment a measurement research station was designed and manufactured which provided the opportunity for the research of composite masts spans of up to 3000 mm with the model fittings, i.e. corresponding to the actual load transmitted by the mast (axial force and bending moment). The research station guarantees the regulation of rigging tension in a wide range (up to 2000 N) and introduction of the changeable angle of the cross-trees, which corresponds to operation in conditions used in practice. Model of the research station is shown in Figure 1.
In the research station, you can perform a series of experiments using different boundary conditions, i.e. different ways to support the heel. “Bricked” mast vibrates like a beam supported on one side, whereas while supported on a ball joint beam vibrates as supported on both sides. The other end is supported elastically (held by the shrouds and the stay). In the first case there are received more degrees of freedom for one end of the mast, whereas the second one freely vibrates. As a result, the overall level of vibration is higher than in the case of the double-sided support where energy can be dispersed by additional translation and rotation of the mast on the wrist. Both cases correspond to the actual ways of the foundation of the mast or boundary conditions of individual spans in complex constructions.
All cases may be studied with the use of various types of force, e.g.: watching random vibrations resulting from a given deflection from the equilibrium position or response to a stimulus pulse. Figure 2 presents the research station.
Fig. 1Design of a research station1 – cross-trees 2 – spreader, 3 – shrouds, 4 – clamp (mounting of “walling”), 5 – rail, 6 – block supports, 7 – brackets, 8 – foundation posts, 9 – inductor, P1-P3 – measuring points)
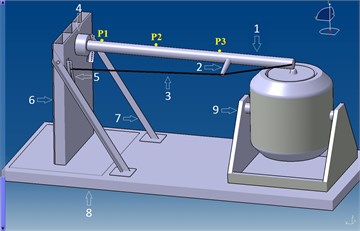
Fig. 2The research station
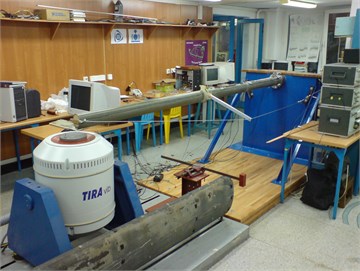
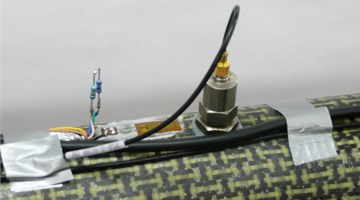
Fig. 3An example of the research station
The experiment itself was planned in the simplest form: mast support corresponded to the type of support which was called “bricking”, the two ropes were enough to stimulate normal operating conditions of a thin-walled mast with the bending moment deliberately introduced.
Masts with similar characteristics were tested, i.e. made in the same environmental conditions (temperature and humidity), with identical structure and orientation of the layers and the same geometrical dimensions. The frequency range of the analysis has been chosen on the basis of recognized measurements.
In subsequent preliminary study, the relation between deformation and vibration acceleration could be demonstrated by initial strengthening and synchronous signals registration (Figure 3) using the National Instruments measurement system which included: registration card for measuring vibration accelerations NI 9234, two measurement cards for recording strains NI 9237 and NI cDAQ docking station 9172.
There were used 3 measurement tracks of vibration acceleration and one track for recording pulse extortion. The measuring points were arranged in the characteristic elements of the mast due to the form of vibration: measuring point number “1” at the foot of the mast, the measuring point number “3” at fitting cross-trees and the measuring point number “2” in the middle of the distance between the measuring points number “1” and “3” (Fig. 1). The measuring circuits consisted of three uniaxial B&K accelerometers 4514, converting acceleration vibration into an electrical signal. Vibration acceleration signals were recorded directly, and the sensors were chosen so that the resonant frequencies of the transducers were out of measuring range.
In order to transform the strain of the top layer of the composite to the electrical signal, there were applied three HBM LY10 strain gauges were dedicated to composite materials.
In the first phase, it was observed that free vibrations were extorted by the mast deflection from equilibrium point with the weight of 15 kilos hanged at the end of the mast on a thin string. Cutting the string resulted in the return of mast to the equilibrium point.
In the second phase the mast was excited to vibrations by bringing impulse of force into the system.
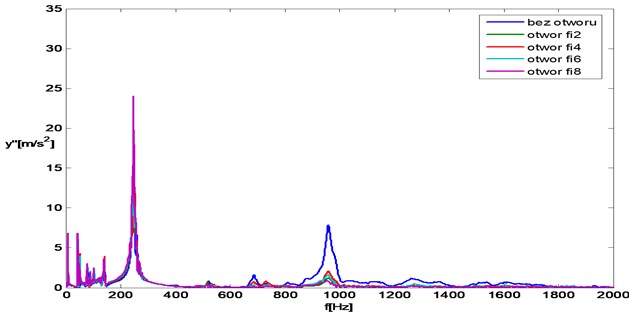
As it was mentioned earlier, the changes in properties during the exploitation show the use or defects of the object. Sometimes they are the basis of one of the methods of diagnosing its condition. In the presented spectrum (Fig. 4) the parameters of register and analysis of applied signals were described more precisely in the subsequent experiment.
Fig. 4Model characteristics of vibrations acceleration for mast “2” with the extortion with the impulse of force in the function of extending hole. Test point no. 1 for fixed mast with the tensioning force of shroud 600 N (rectangular window)
As it can be observed in the case of the spectres of vibrations acceleration, the results of the analysis are influenced by boundary conditions, i.e. the way of fastening and bias of shrouds, and the manner and the value of excitation.
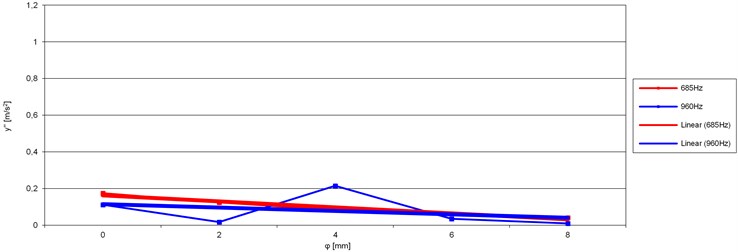
Changes in the analysed signal are in the range of 0-2000 Hz. Four characteristic components with frequencies of 7 Hz, 247 Hz and 685 Hz, 960 Hz can be distinguished on spectres of vibration accelerations. The level of signal components with these frequencies changes monotonically together with the extension of the hole diameter. The amplitudes of the first two frequencies 7 Hz, 247 Hz obtain the increasing values, whereas 685 Hz, 960 Hz obtain the decreasing values.
The first two components 7 Hz and 247 Hz represent bending vibrations and they are useful during the vibrations assessment due to the maximum acceleration values. They comprise very important information about the mast weight. 68 5Hz, 960 Hz represent vibrations of top layer.
In order to find the properties of the object it is better to apply kinematic extortion, i.e. deflection from the equilibrium point. However, in order to find defects, it is better to apply dynamic extortion, i.e. impulse of force.
The flow of energy between particular components on the subsequent spectres of vibration accelerations can also be observed.
The results have a moderate dispersion but they are more difficult to interpret because of the complicated mechanism of vibrations of the composite structure. The results depend on many variables, e.g. Young modulus which changes together with the velocity of deformation. We can only take substitute value.
Figure 5 presents the chart of component values of amplitudes 7 Hz, 247 Hz, whereas figure 6 presents component values of amplitudes 685 Hz, 960 Hz. In order to present the information in a form easy to interpret, the linear trend (obtained with the help of least-squares method) was additionally included. It results from the analysed dependencies that in order to define the diagnostic measure (illustrating the condition of a composite mast i.e. the size of the hole) it is the best solution to assume the initial tension which equals 600 N. The values of vibration acceleration of amplitudes are still high. The system works in the range of frequency above resonance frequency, which is present with the tensioning power of shroud 400 N.
Fig. 5Model characteristic components of spectrum of vibration acceleration with 9 Hz and 247 Hz in the function of extending hole with the tensioning power of shroud 600 N
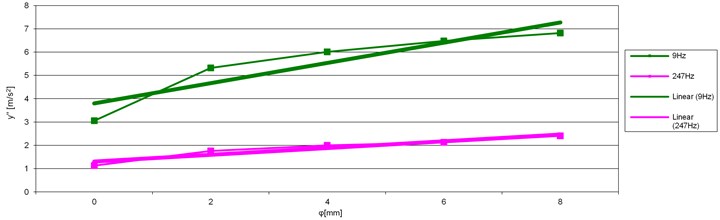
Fig. 6Model characteristic components of spectrum of vibration acceleration with 685 Hz and 960 Hz in the function of extending hole with the tensioning power of shroud 600 N
On the basis of the measures and analyses it is possible to propose a test which identifies the defect, i.e. finds the change of the constructional hole diameter in the mast.
Theoretical considerations indicate that the shape of phase trajectory is a feature which differentiate the object with different discontinuity of cross-section no matter the value of other parameters (stiffness, damping) is. That is why such a symptom was proposed.
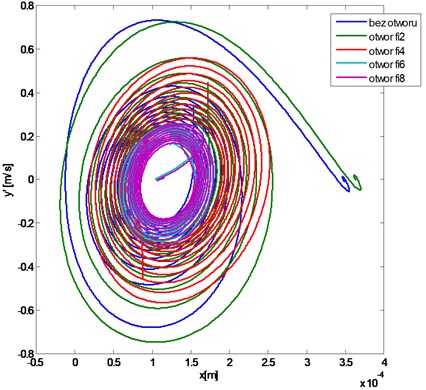
During the experiment the analysis on the phase plane for kinematic extortion, i.e. mast deviation from the balance point with the help of 15 kilos weight was made.
Such trajectories show that together with the growing weight, they move to the right (positive deflections – stretching – Figure 7). The movement results from mast deformation, the profile is pushed out in the direction of stay through the sailing and shrouds system. It can be observed that together with the increase of the hole to the right the rotation of other trajectories takes place. In order to check it precisely the characteristics of angle of trajectory rotation in the function of increasing diameter hole were plotted for the purpose of further analysis well known dependencies were used, i.e. moment of inertia of 2D figure about axis (1), i.e. sum of products of elementary fields and squares of the distance of these fields from axis :
Fig. 7Model trajectory on the plane x, y’ for mast “1” with the deflection from the equilibrium point with the extortion caused by the deflection. Test point No. “3” for fixed mast with the tensioning power of shroud 600 N
The expression which is the sum of products of fields and the centrifugal moment of inertia of figure (2) and the distance of centres of gravity of these fields from axes and .
Centrifugal moment of inertia can be positive or negative or it can assume zero. For the last case, the axes will be called central axes of cross-section. If the axis of coordinate system is the axis of figure symmetry, then the centrifugal moment of inertia equals zero, and such an axis is the main one. Axes for which the moments of inertia will reach extreme values are called principal axes of inertia. The moments of inertia about such axes are called principal moments of inertia.
In order to mark the direction of axis where moment of inertia about this axis reaches extremum, the following dependencies should be applied:
where – is the expected angle of trajectory rotation Figure 8.
Fig. 8The expected rotation angle of principal axis of inertia (3)
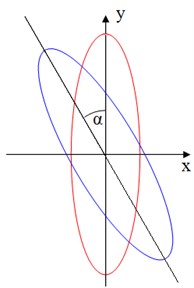
Fig. 9The angle of trajectory rotation on the plane x, α in the function of extending hole with the tensioning power of shroud 600 N
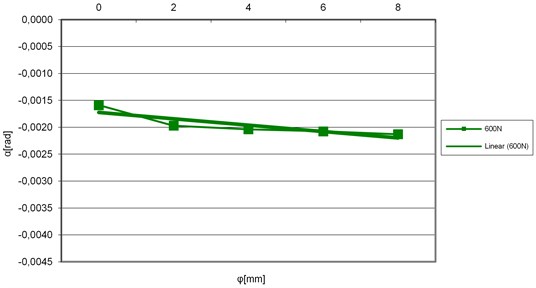
In order to present the information in a form easy to interpret, the linear trend was additionally included. Figure 9 present the dependency of angle of rotation as the function of characteristic dimension of damage.
For the purpose of diagnostic test, the best solution is to assume the initial tension of shroud, which is 600 N and is located above the main resonance frequency of the system.
In order to analyse the results of the test it is necessary to assume the amplitudes of vibration accelerations with the frequencies of 7 Hz and 143 Hz. The effect of such a choice is a monotonic measure which changes together with the change of a diagnostic symptom.
2. Conclusions
During yacht exploitation, the mast is used up, i.e. it is locally delaminated, and the technological holes which are influenced by concentrated forces (e.g. crosstress fitting) are extending. Dynamic weights lead to further wear and tear. Such a hidden mechanism of defect, i.e. excessive clearance leads to the damage of yacht during a typical exploitation. This process is accompanied by subtle then even bigger changes of the level of emitted vibration accelerations. These changes do not show only the general condition of the object, but also indicate the type and the place of defect. The assessment of the mast condition on the basis of the analysis of emitted vibrations can indicate the degree of wear and tear of the examined object.
The analyses show that it is possible to find the symptom and the parameter, which is sensitive to changeable in time hidden material defects and exploitation damages of the structure of the composite-carbon mast. Such a parameter can be the basis for creation of diagnostic system of this type of construction.
References
-
Batko W., Dąbrowski Z, et al. Modern methods of the analysis of vibroacoustic methods (technical applications), Part 2. ITE-PIB, 2006, (in Polish).
-
Dąbrowski Z., Dziurdź J., Skórski W. W. Vibrations of composite masts. ITE-PIB, 2007.
-
Dabrowski Z., Maryniak J., Skórski W. W. Problems of the dynamics of a yacht. ITE-PIB, 2001, (in Polish).
-
Dabrowski Z., Maryniak J., Skórski W. W. Modern computational and research methods in design of yachts. ITE, 2002, (in Polish).
-
Deuszkiewicz P., Dziurdź J., Zawisza M., Propagation of vibrations in anisotropic composite structure. 4th National Conference, Scientific and Technical Problems in the Competitive Sport of Sailing, 2007, (in Polish).
-
Deuszkiewicz P., Dziurdź J. Changing the dynamic properties of structure from carbon – aramid composites under the influence of axial load. 15th Scientific conference of Vibroacoustics and Vibrotechnics, Sękocin Stary, 2010, (in Polish).
-
Dziurdź J., Markuszewski D., Zawisza M. Synchronic measurement of stress and vibrations in composite structures on the example of carbon mast. 14th Scientific Conference of Vibroacoustics and Vibrotechnics, Kraków, 2008, (in Polish).
-
Markuszewski D. Test stand for the research of natural vibrations of composite masts. 13th Scientific Conference of Vibroacoustics and Vibrotechnics, Jachranka, 2007, (in Polish).
-
Markuszewski D. The influence of the angle of crosstress setting on the modes of natural vibrations of composite masts. 15th Scientific Conference of Vibroacoustics and Vibrotechnics, Sękocin Stary, 2010, (in Polish).
-
Zawisza M., Markuszewski D., Wądołowski M. Research of composite carbon-aramid masts with the vibroacoustic methods. 6th National Conference on Scientific and Technical Problems in Competitive Yacht Sport, 2009, (in Polish).
About this article
