Abstract
This article describes a measurement method whit strain gages, which allows measure the vertical force independently of the lateral force in the wheel – track interface of a railway. It also shows the obtained results from the implementation of this method to measure the forces in a commercial railway of the railway system.
1. Introduction
An efficient interaction between the vehicle and the track can support large loads per axle, and an inappropriate design and maintenance of the wheel-rail interface can bear to a fast degradation of the system components and put in risk the lucrative character of the railway operation. According to the previously stated, it is important to define the different kind of forces that take part in the wheel-rail system, as the vertical forces, which are a decisive factor in the prediction of the wear and deformation for the different elements that compose the vehicle and the railroad [1-8], and in the determination of factors as the operation speed and maximum load of the vehicles, among others [2].
The aim of this article is to implement a measurement method to evaluate the forces and efforts of the metro vehicles. This aim belongs to the research project “Diagnosis Portable System (SPD) for the passenger vehicles of the metro, to implement the UIC 518 international norm of the International Union of Rail-roads” [2, 9, 10].
This measurement is based on the parameters that are defined in the UIC 518 international norm, which seeks to establish the rules to carry out the dynamical behavior tests related to the safety, track fatigue, running behavior and analysis of results, with purposes of approve the rolling stock. In this standard, the approval of a railway vehicle must be based on a test line, not a simulation [3, 11, 12]. This is from a point of view of dynamical behavior.
In the last years diverse methods of measurement have been developed to measure several forces, as force (lateral) and force (vertical) by means of the instrumentation of the track or the wheel [4, 13-15]. The instrumentation of the axle-wheel set has the advantage of remaining mounting in the vehicle; therefore the forces between the wheel and the rail can be measured in all the points of the track.
The instrumentation of the track only measures forces in the instrumented section. Nevertheless, due to the large cost of the instrumentation of the axle-wheel set, it is chosen to instrument a track section for the measurement of the forces [16-19].
2. Method for measurement
The forces are measured by the Swiss method named “SBB rail measurement”, which enables to measure and forces independently by the use of strain gages placed on the rail between two ties with specific connections to a Wheatston bridge [3].
To measure vertical force of the wheel, strain gages are placed in III on the core of the rail (Fig. 1) known as the neutral plane, where and (applied eccentrically) produce less noise for the precision of the measurement. If the strain gages are connected in a serial layout, and placed in one branch of the bridge, on both internal and external sides of the rail’s neck on III, flexion stress on the vertical-lateral planes (-) that come from and misalignment of are eliminated. The bridge reacts to the compression stress on the rail’s neck, generated by , and measures the vertical force independent from [4].
The measured stress on the rail is produced by the vehicle-rail interaction and is generated in linear segments with good characteristics. On the experimental segments of the railway the strain gage are distributed and placed on one side of the railway (no matter which side), because this way increase the probability to register on a section of the rail, the maximum lateral interaction between the railway and the wheel of the train, caused by the yaw on the linear segments, and the acquire mean data that correspond to a defined length on the rail.
Fig. 1Method for measurement
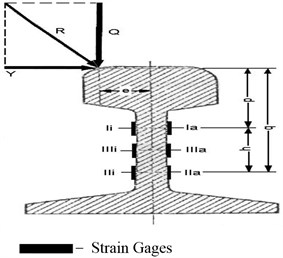
The stresses on each section are measured with two strain gages placed symmetrically with reference to the vertical axis of the rail (close to the border of the base). The strain gages are placed on the base of the rail, parallel to the longitudinal axis of itself. The stress measured on each section of the rail constitutes a resulting sum of the wheel-rail interaction (-vertical force and the -lateral force) applied on the rail eccentrically. The precision of this method for measuring is equal to ±7 % [4, 7].
Fig. 2Strain gages distribution on the tangent railway
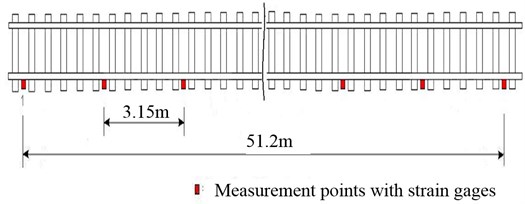
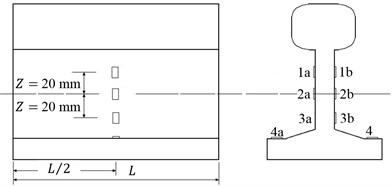
Fig. 3Strain gage location on the rail
3. Setup description
The instrumentation is made in a section of the railway between the stations Bello-Madera. Fig. 2 shows a distribution of the measurement points on the selected tangent railway segment, where there is a measurement point every 3.15 m approx. and 16 points along one side of the railway.
Eight HBM strain gages were installed in each measurement point (Fig. 3) as follow: six uniaxial strain gages placed on the rail’s core on points 1, 2 and 3 and two 90° rosettes installed on the base of the rail on points 4a and 4b. For the strain gage installation on the rail proceed with standard procedures recommended by the manufacturer.
4. Instrumentation and software
The system used for the acquisition and conditioning of the signal is similar to the one showed in Fig. 4, conformed by a signal conditioning device, a data acquisition card and a portable computer.
Fig. 4Acquisition system: 1 – PC, 2 – NI DAQ Card 6062E, 3 – Armored Cable SCXI-1349, 4 – Chassis SCXI-1000, 5 – Module SCXI-1520, 6 – Borne block SCXI-1314, 7 – Transducer (strain gages)
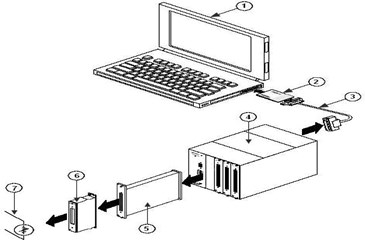
This acquisition system has a chassis which provides an environment of low-noise for the conditioning of signals, power and control for the circuits of the measurement points. The universal modules for the strain gages allow the amplification and the independent filtration for each channel and have a source of programmable excitation to supply independent voltage between 0 and 10 volts. A borne block assembled in the strain gages module allows the connection of each of the bridges. This block has the option to install resistors that are used to complete quarter Circuit Bridge. Also, they have installed two 100 ohms resistors per channel to generate the shunt calibration [1, 5, 12].
Acquisition is made with a 6062E DAQ Card from National instrument for a PC MCIA port that allows acquisition speeds up to 500 Hz and a 12-bit resolution.
The system is controlled with software developed in LABVIEW, which receives and processes data from the strain gages at a sample rate of 1200 Hz. The obtained data on each measuring point are stored in an EXCEL file and then are processed statistically for each wheel.
5. Calibration of the system
The calibration of the measurement system requires a correlation among the values of the physical parameter (force) and the records of the transducer (output voltage). The calibration was carried out according the recommendations of the technical Colombian norm NTC 3761. The temperature of test was 24 °C and the relative dampness 50 %. The Fig. 5 shows the calibration steps for the equipment.
A 40 ton Hydraulic work bench is used, located on the Metro de Medellín’s Work-shop. The setup has to reproduce a railway segment, with two rails over the tie, using real track distances. The strain gages are placed using the same procedures used in the on-location railway.
Three series of loads are applied in a discreet and equally spaced manner and the corresponding voltage value is registered on the data acquisition system. A linear regression is made with the calibration data obtaining the index of 0.9995, as the Fig. 6 shows.
Fig. 5Calibration steps for the equipment
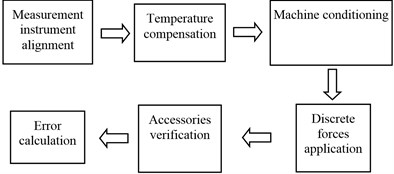
Fig. 6Linear regression of the data obtained in the calibration
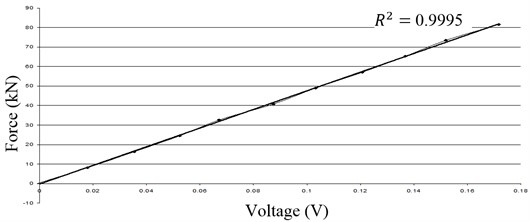
Table 1Q force values and deformation per wheel for the units 10 and 33
[kN] | Ave. [kN] | Effort [Pa] | Average [Pa] | |||
Motor Vehicle B 1 | Bogie 1 | Wheel 1 | 56.47 | 56.48 | 8.52E+06 | 8.56E+06 |
Wheel 2 | 55.89 | 8.48E+06 | ||||
Bogie 2 | Wheel 3 | 58.23 | 8.83E+06 | |||
Wheel 4 | 55.31 | 8.39E+06 | ||||
Trailer Vehicle 1 | Bogie 3 | Wheel 5 | 42.68 | 43.26 | 6.48E+06 | 6.57E+06 |
Wheel 6 | 42.21 | 6.41E+06 | ||||
Bogie 4 | Wheel 7 | 43.03 | 6.53E+06 | |||
Wheel 8 | 45.13 | 6.85E+06 | ||||
Motor Vehicle A 1 | Bogie 5 | Wheel 9 | 56.13 | 58.23 | 8.51E+06 | 8.83E+06 |
Wheel 10 | 53.44 | 8.10E+06 | ||||
Bogie 6 | Wheel 11 | 62.67 | 9.50E+06 | |||
Wheel 12 | 60.69 | 9.20E+06 | ||||
Motor Vehicle B 2 | Bogie 7 | Wheel 13 | 60.34 | 57.50 | 9.15E+06 | 8.72E+06 |
Wheel 14 | 55.66 | 8.44E+06 | ||||
Bogie 8 | Wheel 15 | 58.82 | 8.92E+06 | |||
Wheel 16 | 55.19 | 8.37E+06 | ||||
Trailer Vehicle 2 | Bogie 9 | Wheel 17 | 40.46 | 39.70 | 6.15E+06 | 6.03E+06 |
Wheel 18 | 39.29 | 5.97E+06 | ||||
Bogie 10 | Wheel 19 | 39.40 | 5.99E+06 | |||
Wheel 20 | 39.64 | 6.02E+06 | ||||
Motor Vehicle A 2 | Bogie 11 | Wheel 21 | 56.59 | 57.35 | 8.58E+06 | 8.70E+06 |
Wheel 22 | 54.02 | 8.19E+06 | ||||
Bogie 12 | Wheel 23 | 60.57 | 9.18E+06 | |||
Wheel 24 | 58.23 | 8.83E+06 |
6. Measurements
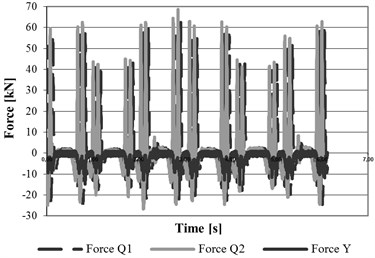
Fifteen measurements of Q forces and efforts were made in the commercial track using both available measurement points of the track. The data were captured by the instrumented railway in the moment of the pass of the vehicles, and the data were exported to Excel file to be drawn and analyzed. In the Fig. 7 is observed one of the measurements made to a passenger vehicle. This vehicle has two linked units where can be noticed the difference of weight between the units and where the maximum force per wheel does not exceed 70 kN. The Table 1 shows the results per wheel for this vehicle.
Fig. 7Force values obtained for the units 10 and 33
7. Conclusions
The Table 2 shows the results from the measurements of the vertical -forces, this results when are compared with the theoretical data it is noticed that the measurements are among the expected ranges of force.
Table 2Comparison between the practical and theoretical dates.
Item | Motor vehicle B [kN] | Trailer vehicle [kN] | Motor vehicle A [kN] | |
Practical data | average | 58.81 | 44.94 | 61.71 |
maximun | 63.52 | 50.35 | 65.89 | |
minimun | 54.05 | 39.37 | 56.87 | |
Theoretical data | Load in empty | 51.47 | 35.41 | 52.28 |
Weight with load AW1 | 74.51 | 59.96 | 75.32 | |
Weight with load AW2 | 83.28 | 69.05 | 84.09 |
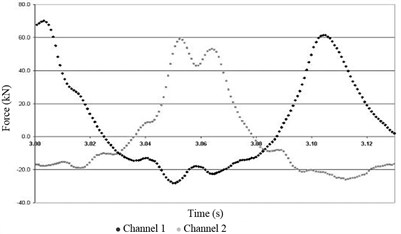
The instrumented railway can have a different use to the measurement of the forces values, as the detection of the faults in the wheels. The Fig. 8 shows a double peak marked in some wheels. This double peak could be caused by defects in the wheel, mainly when the wheel turns oval. This oval defect causes cyclical blows to the rail and when one of these blows takes place near one strain gage, causes a peak in the graph due to the impact followed by another peak caused by the pass of the wheel on the strain gage.
Fig. 8Measurement example of a possible fault caused when the wheel turns oval
Techniques and algorithms used a different branches of science can be applied to technical condition monitoring, as the case of main components analysis and the singular values decomposition.
The multidimensional symptoms monitoring allows identifying changes in the system technical condition and establish possible causes from that condition.
This kind of monitoring in the specific analyzed case generate a maintenance decision-making support, which impacts in cost reduction related to maintenance and optimal personal use besides, it generates an increase in the system’s availability and reliability.
The study was made in real exploitation conditions, considering dynamic variables of generators with the purpose of obtaining information about the general technical condition of system.
References
-
Castaneda L. Monitoreo multidimensional de la interfase vía-Vehículo de un Sistema Ferroviario. Congreso Internacional de Mantenimiento, Bogotá, Colombia, 2007.
-
Castaneda L. F. Multicriterial System for Evaluating the Safety and Comfort in Railway Vehicles. Ph.D. Thesis, UTP, Bydgoszcz, 2007.
-
Formenti D., Richardson M. H. Global curve fitting of frequency response measurements using the rational fraction polynomial method. 3rd International Modal Analysis Conference, Orlando, FL, 1985.
-
Formenti D., Richardson M. H. Global frequency and damping from frequency response measurements. 4th International Modal Analysis Conference, Los Angeles, CA, 1986.
-
Testing and approval of railway vehicles from the point of view of their dynamic: behaviour – safety – track fatigue – ride quality. International Union of Railways, UIC 518, Paris, France, 2003, p. 212.
-
DAQ, Quick Start Guide. National Instruments, Austin, Estados Unidos, 2004, 144p.
-
Zoltowski B., Castañeda L., Betancourt G. Monitoreo multidimensional de la interfase vía-Vehículo. Congreso Internacional de Mantenimiento, ACIEM, Bogotá, Colombia, 2007.
-
Żółtowski M. Management Information Systems in Fabricate Engineering. ITE-PIB, Radom, 2011, p. 271, (in Polish).
-
Puente M., Méndez O. R. Tratado de Ferrocarriles. Vol. 1, Rueda, Spain, 1977, p. 361-472.
-
Żółtowski B., Castaneda L. Sistema portail de diagnostico para el sistema metro de Medellin. VIII Congresso International de Mantenimiento, Bogota, Columbia, 2006.
-
Potter J., Richardson R. Identification of the modal properties of an elastic structure from measured transfer function data. 20th International Symposium, Albuquerque, New Mexico, 1984.
-
Tournay H. Guidelines to best practices for heavy haul railway operations: wheel and rail interface issues. International Heavy Haulage Association – IHHA, Missouri, Estados Unidos, 2001.
-
Testing and approval of railway vehicles from the point of view of their dynamic: behaviour – safety – track fatigue – ride quality. International Union of Railways, UIC 518, Paris, France, 2003, p. 212.
-
Richardson M. Modal Analysis Using Digital Test Systems. Seminar on Understanding Digital Control and Analysis in Vibration Test Systems. Shock and Vibration Information Center Publication, Naval Research Laboratory, Washington, 1995.
-
Żółtowski B. Diagnostic System for the Metro Train. ICME, Science Press, Chengdu, China, 2006, p. 337-344.
-
Rocklin G., Crowley G. T., Void H. A comparison of Hi, H2, and Hv frequency response functions. 3rd International Modal Analysis Conference, Orlando FL, 1985.
-
Void F. L., Rocklin G. T. The numerical implementation of a multi-input estimation method for mini-computers. 1st International Modal Analysis Conference, Orlando, 1982.
-
Żółtowski B., Castaneda L. Portable diagnostic system for the metro train. Diagnostyka, Vol. 1, Issue 37, 2006, p. 39-44.
-
Żółtowski B. Energetic Measures in Machine Diagnostics. Baltechmasz, Kaliningrad, 2006, p. 290-302, (in Polish).
About this article
