Abstract
Bobbin tool friction stir welding (BTFSW) is a new solid-state welding technology that has been developed successfully in many joining applications, such as thick plate and hollow component welding. The existence of the gap can possibly cause an unstable welding, and the variety of the torque is closely related to the existence of the gap. Compared with the conventional friction stir welding (FSW), BTFSW has the different tool and welding process, especially some new feature of the periodic vibration signal arises when welding two sheets in the presence of gaps. Compared with vibration-accelerated signal, torque signal is capable of reflecting the vibration of the welding process. The aim of this study was to develop an effective algorithm to detect gaps in BTFSW operations. Experimental studies were conducted to determine the features of welding process parameters and the gap. Time-frequency (TF) analysis provides a display of subtle torque features, shows the corresponding duration of low frequency signal clearly. Followed by a low-pass filter, gauss wavelet transform (WT) algorithm would improve the detection and identification of the gap presence. Several experimental studies with a variety of process parameters and proposed algorithm was shown to be able to reliably detect the presence of gaps in BTFSW operations for traverse speeds below 200 mm/min and gap sizes above 0.3 mm. This gauss WT algorithm could become a useful noninvasive tool for welding quality assessment in practice.
1. Introduction
BTFSW is an important branch of friction stir welding where material is welded through mechanical stirring via a rotating tool that traverses the joint line (2009) [1]. It is effective for joining hollow extrusions and lap joints, and has been studied intensively and applied widely in many industries. The bobbin tool consists of a pin and two shoulders, all of which contact the part material, and slowly crams into the sheets at the beginning. When tool traverses across the intersection of two plates, deformed material fills the void when the tool leaves the processing zone.
Related research has concentrated on detailed models of the tool and surrounding material. Hilgert et al. presented three thermal 3D models for bobbin tool Friction stir welding implemented in Comsol and Matlab (2011) [2]. Deloison et al. calculated the steady state 3D heat source from results gained from an axisymmetric flow simulation (2008) [3] using a sequential 2D axisymmetric (flow) and 3D (thermal) coupling. In recent years, understanding and predicting the process parameters is important if resultant weld microstructures and associated mechanical properties are to be optimized. Sued et al. reported the effect of tool pin features and process variables on weld quality for bobbin tool FSW (2014) [4]. Elangovana et al. studied the influences of tool pin profile and welding speed of the formation of friction stir processing zone in AA2219 aluminum alloy and the results indicated that the joints fabricated at a welding speed of 0.76 mm/s showed superior tensile properties (2008) [5].
The periodic vibration of the welding process has gradually aroused people's attention. Torque is perhaps the most important and fundamental quantity of the process, but there is no further study of the characteristics of the torque vibration. Su et al. measured the tool torque by monitoring the output torques of the servo motors inside the FSW machine through an indirect but economical methodology. The research indicated that the higher is the tool rotation speed, the lower is the tool torque (2013), the result also shown the cycle vibration phenomenon of spindle motor current [6]. Cui et al. put forward a satisfactory model relating torque to the two major FSW parameters, rotation speed and forward speed (2010) [7]. Janaki et al. proposed a simple criterion (contained torque, axial force and rotation speed) for identifying the onset of defect-free weld formation (2013) [8]. William R. L. concluded that torque control is better suited for keeping a friction stir welding tool properly engaged with the workpiece for application to robotics and automation (2010) [9].
Besides, gaps will appear inevitably between the two long sheets in the assembly process, it will also affect process parameters and welding quality. The emergence of gap is due to improper assembly, imprecision in the processes used to manufacture the sheets, etc. Yu Yang etc. developed a plunge force frequency analysis monitoring algorithm to detect gaps in friction stir butt welding operations. The algorithm was shown to be able to reliably detect the presence of gaps in friction stir butt welding operations for tool traverse speeds below 4.233 mm/s and gap sizes above 0.3048 mm (2008) [10]. Nandan et al understanding of the practical gap tolerance for FSW is relatively limited (2008) [11]. Takahara et al. investigated the allowance of deviation and gap for butt welding of 3-mm-thick AA5083-O plates and found that gap spacing within 2 mm did not affect the tensile properties of their welds (2006) [12]. Wanjara pointed out increasing the gap size resulted in the formation of wormhole defects beyond a gap of 0.5 mm, which was determined to be the critical limit for practical application using serial industrial robot (2013) [13].
In summary, it is clear that few studies have involved the gaps and parameter vibration that exist in the BTFSW process. Essentially, there are two types of bobbin, or self-reacting techniques: technique of a fixed distance and one that allows the distance between the shoulders to adapt during the welding operation. The fixed distance type is the focus of this study. The mechanical vibration and torque vibration characteristics are demonstrated in this study. An effective algorithm that can robustly detect gaps in BTFSW process is also proposed. TF analysis of torque time history will be utilized to show the main component of torque data, the low frequency and high frequency periodic torque signals are used for gap detection.
2. Material and method
2.1. Experimental bobbin tool FSW system
The bobbin tool FSW machine has three axes (Fig. 1), which are denoted (perpendicular to the tool axis and in the direction of welding), (perpendicular to the direction of welding) and (parallel to the tool axis and in the plunge direction). The spindle is driven by a variable frequency asynchronous motor with a maximum continuous power of 7.5 kW and a maximum speed of 3000 rpm. It is equipped with torque sensor capable of sensing torque up to 200 N∙m. Through the hollow channel, the torque sensor line is connected with a sample circuit which has via analog-to-digital channel (5 v range and 12 bit) on a board based on microprocessors. After the treatment with the microprocessor, the torque signals are sent to the wireless transmission module. A piezoelectric acceleration sensor located on the edge of workpiece (Fig. 1(c)). The weak vibration signals are processed by using the amplifier and a series of anti-aliasing filter circuit. These signals are converted to digital signal by A/D converter which can be processed by computer, so as to finish the collection of vibration signal. During the welding process, torque sensor, sample circuit and wireless module have synchronous rotary speed. Through the wireless receiving module, the torque signal is fed into a computer, where signals are stored and displayed. A sample frequency of 500 Hz was utilized in all experimental studies.
FSW tools were made using HM1 tool steel. The diameter of the upper shoulder and lower shoulder were 24 mm and 23 mm, respectively. The distance between two shoulders was 5.85 mm. The pin diameter is 10 mm, its surface has two screw with opposite rotating direction. The material in these experiments is 6061 aluminum ally (Al-0.6Si-1.0Mg) with a T4 heat treatment. The plates were machined with a consistent dimension of 230×160×6 mm to obtain comparable results. Travel speed () and rotary speed () varied respectively from 10 to 170 mm/min and from 350 to 700 rpm in all experimental studies. But in each experiment, was constant.
Fig. 1Experimental device and its structure
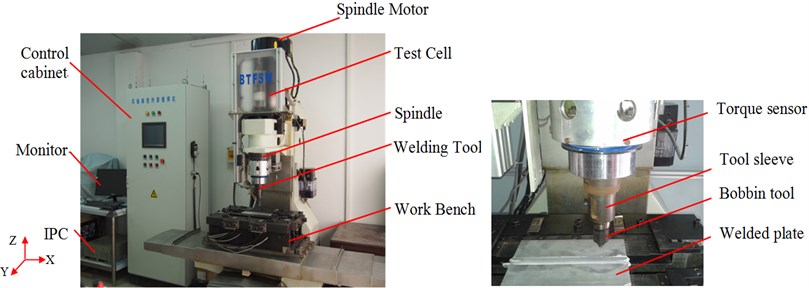
a) Bobbin tool FSW machine
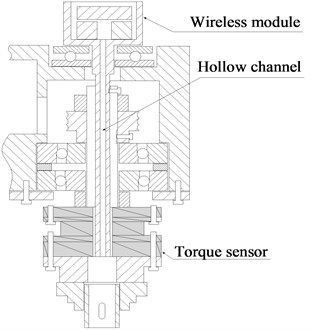
b) Torque detection device
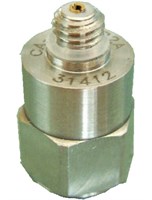
c) Vibration sensor
2.2. Experimental procedures
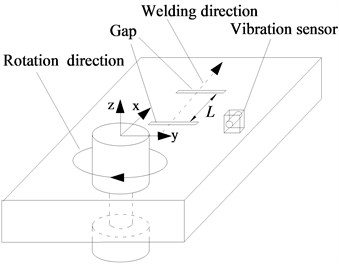
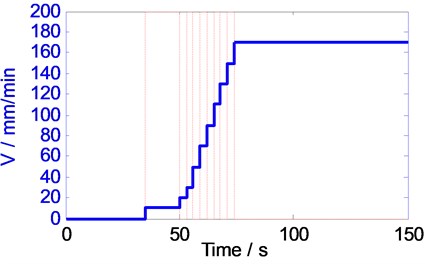
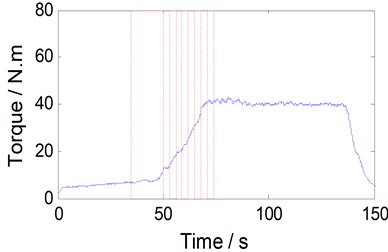
As shown in Fig. 2(a), two gaps along the y direction were arranged in the welding path, the distance () between two gaps is 80 mm, the maximum gap width is 0.8 mm, the length along the direction is 24 mm, the vibration sensor is in the midpoint of plate side. The welding process can be divided into several segments with different travel speed as the following: 10, 20, 30, 50, 70, 90, 110, 130, 150 and 170 mm/min. The speed segment durations are 35 s, 15 s, 3 s, 3 s, 3 s, 3 s, 3 s, 3 s, 3 s and 3 s. The dashed line is the boundary between the different travel speeds as seen in Fig. 2(b). In order to generate more energy to preheat the metal and produce enough plastic metal, the reason for the lower traverse speed and longer duration when start welding. This approach also prevents pin be broken easily.
Initial experiments were conducted to derive a qualitative understanding of bobbin tool friction stir welding processes with and without gaps. There are two scenarios in this research, the one scenario is referred to “zero width gap”. In this scenario, tool friction stirs a solid piece of material. The other scenario is referred to “Non-zero width gap”. Also, there are two constant known gaps in the welding path, and the gap width is 0.4 mm, 0.6 mm, respectively.
Fig. 3 shows the unfiltered torque curve in two scenarios, the unfiltered torque data are very noisy due to electrical noise in the circuits and noise due to the BTFSW process itself.
Fig. 2Bobbin tool FSW scenarios
a) Schematic diagram of gap position
b) Travel speed variation curve
Fig. 3Torque history for bobbin tool FSW operations with N= 350 rpm and v varies from 0 to 170 mm/min
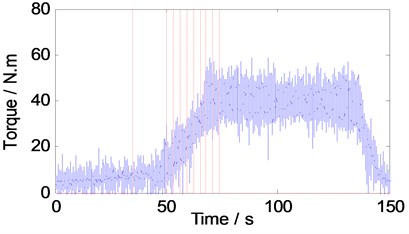
a) Non-gap
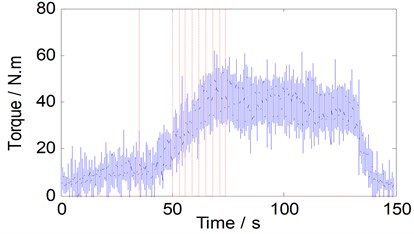
b) Gap width is 0.4 mm, 0.6 mm
When the welding tool passes through the vibration sensor, the vibration signal is strongest during the whole welding process, as shown in Fig. 4(a). As the tool is away from the vibration sensor, the vibration signal is gradually weakened. Different from the vibration signal, however, the torque signal presents a relatively stable periodic characteristics, as shown in Fig. 4(b). If we want to find the vibration characteristics of the welding process, we need a moving vibration sensor. This adds to the difficulty of installation and inspection costs. Further, vibration signals and torque signals have the same vibration frequency. It became apparent that we could get the stable vibration characteristics by torque signal.
Due to the torque signal contains oscillatory signal and noise, fast Fourier Transformation (FFT) and WT method were applied to the detection process. After FFT, the relationship between the specific frequency and amplitude of the torque signal was shown in Fig. 4(c). The torque signal contained a main periodic signal (about 10.78 Hz). After WT, pigment concentration represents the signal strength of the specific frequency (Fig. 4(d)). Obviously, the low-frequency signal exits in the whole welding process, but the main periodic signal (around 10.78 Hz) exists only in the middle of the process (40 s-140 s), that is not significant at the primary and ending stage.
2.3. Analysis of the low frequency torque
Based on the analysis above, the raw torque data were filtered with a one-order Butterworth digital filter with cutoff frequency of 3 Hz. The cutoff frequency of 3 Hz provides sufficient bandwidth to detect the torque signal as the tool traverses the gap. The filtering substantially removed the inherent noise (Fig. 5).
Fig. 4Spectrum analysis of torque signal (350 rpm)
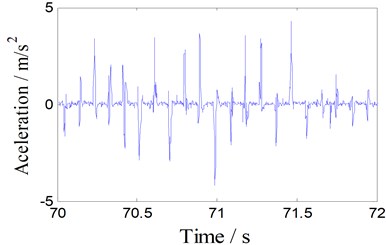
a) Local vibration signal
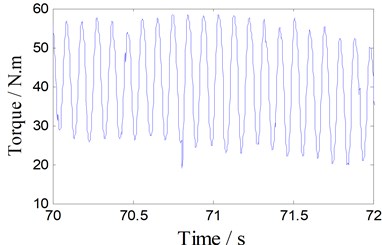
b) Local torque signal
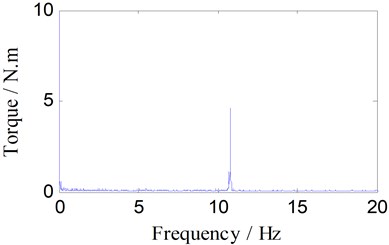
c) Fast Fourier transformation
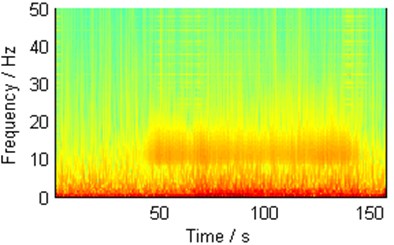
d) Time-frequency diagram
Fig. 5Low frequency torque for bobbin tool FSW operations with N= 350 rpm and v varies from 0 to 170 mm/min
a) Non-gap
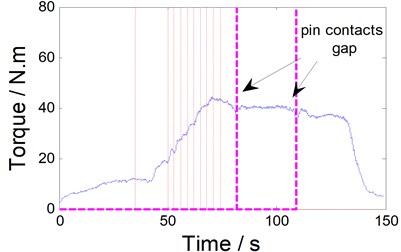
b) Gap width is 0.4 mm, 0.6 mm
Visibly, the torque value is very small in the primary welding stage (less than 50 s). The welding speed increase 20 mm/min per 3 s, Subsequently, torque also increases at the same time. When the traverse speed increased to 170 mm/min, it remains the same during the rest of the process; with the welding process continues, low frequency torque decreased slowly. Once the welding tool closer to the plate edge (about 140 s), the torque decreased rapidly when the tool gradually withdraws from the workpiece.
The deviation is apparent as the tool transverse the gap with 350 rpm and 170 mm/min (Fig. 6). The decreasing trend of the torque is visible. The smaller gap widths, the torque deviation will be less. Furthermore, noise still exists in the filtered torque data, and several local peaks appeared before or after pin contacts the gap.
2.4. Analysis of the periodic torque
A six-order Butterworth band pass digital filter was designed via trial and error, it provides sufficient noise reduction while not substantially delaying the torque signal, its transfer function is:
where is the discrete forward shift operator. When bobbin tool FSW operations with 350 rpm and travel speed varies from 0 to 170 mm/min, the main periodic signal is shown in Fig. 7. The amplitude of periodic signal is small at the primary and the end stage of welding process; this is primarily due to a lack of friction. In addition, the amplitude of main periodic oscillating signal will increase before or after pin contacts the gap, but many several local peaks also appeared in this case, this raises the gap detecting difficulty (Fig. 8).
Fig. 6Torque history for bobbin tool FSW when the pin traverses across the gap
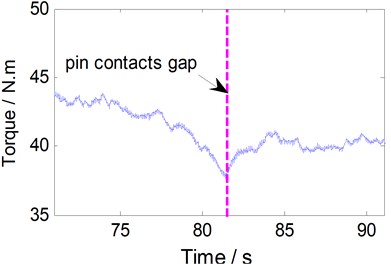
a) Gap width is 0.4 mm
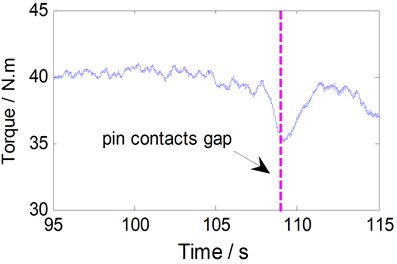
b) Gap width is 0.6 mm
Fig. 7Periodic torque history for bobbin tool FSW
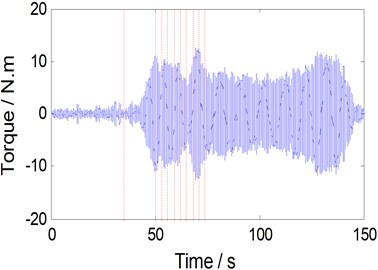
a) Non-gap
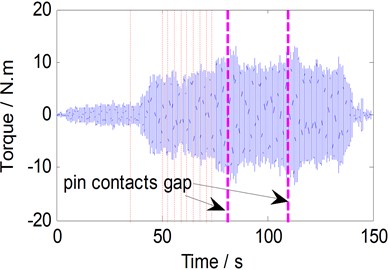
b) Two gaps
Fig. 8Enlarged local periodic torque history
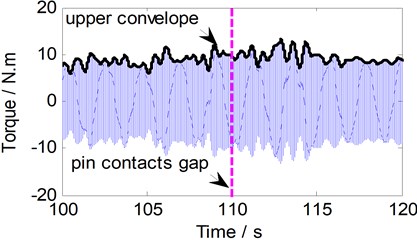
a) Gap width 0.4 mm
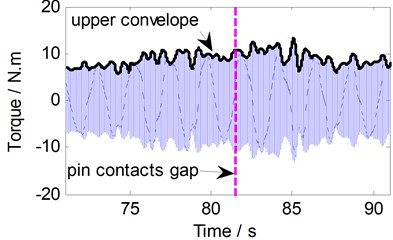
b) Gap width 0.6 mm
Obviously, the presence of gap inevitably brings about a mutation for torque signal; this is an essential feature of welding process, but too many local extremes appear before or after pin contacts the gap. Thus, it is necessary to find an effective algorithm to detect the presence of the gap.
2.5. Gap detecting algorithms
In this study, the TF algorithm based on the gauss function is applied. The wavelet analysis can describe the local mutation signal; the local extreme point of a WT module corresponds to the mutation point of origin signal if this wavelet function can be considered as a derivative of a smooth function. Accordingly, zero crossing point of a WT module corresponds to the mutation point when this wavelet function can be considered as the second derivative of a smooth function. So the extreme or zero crossing point of WT module can be applied to detect a mutation, this method can fully describe the local feature of torque signal. According to the feature of the Fourier transform, the convolution of the torque derivative and filter is equal to the convolution of torque and filter derivative, the relationship is as the following:
where is the convolution of and , is the torque signal, is filter, is convolution operator. is Gaussian function, it is continuous and has second derivative, and then the following formulas can be defined:
where is scale factor. Obviously, , meet the admissible condition of wavelets. Then the WT using and are defined as the following:
Therefore, is the result of smoothing and eliminating noise by , and its first order derivative and second derivative are and , respectively. The smoothing effect of has a slight impact on mutation in torque data when the scale factor () is small, but the impact cannot be ignored when s is larger. In order to select the appropriate scale factor (), a set of experiments was conducted with four different scale factor () (0.9, 1.0, 1.3, 1.5), 400 rpm, and 170 mm/min, as seen in Fig. 9. For each scale factor (), the algorithm can detect the mutation point, the mutation point is the local maximum value of and zero of .
Under 1 and 1.3, the WTs of the low frequency torque signal is shown in Fig. 10. When 1.0, the algorithm can detect multiple mutation point (75.5 s, 79.8 s, 86 s), and when 1.3, only one mutation point is detected (79.8 s). If 1.0, the algorithm is so sensitive that more mutation point will be detected. Nevertheless, if 1.5, the detecting algorithm is lack of sensitivity, the small mutation is neglected during the period of the pin goes through the gap. Hence, 1.3 is used for the gap detecting algorithm developed in this study.
As shown in Fig. 10, when scale factor was lager (1.3), the emergence of clear mutation point was delayed in this case (delay time is close to 5.14 s). Compared with the wavelet transforms of the low frequency torque (leading time is close to 1.8 s), the upper envelope of the main periodic signal is not suitable for detecting the gap by the wavelet transforms algorithm. Then the low frequency torque signal will be the focus of following study.
Fig. 9The WTs of the low frequency torque signal for operations with N= 400 rpm, V= 170 mm/min, and 0.35 mm gap
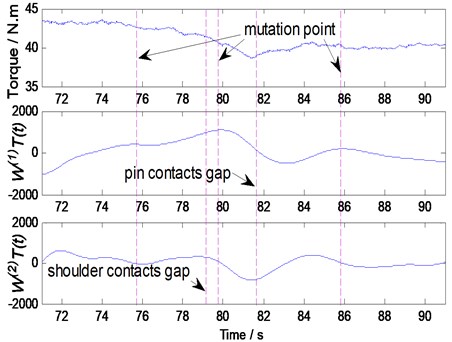
a) Torque and WT with 1
b) Torque and WT with 1.3
3. Results and discussion
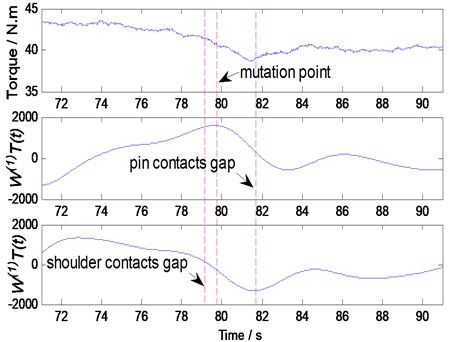
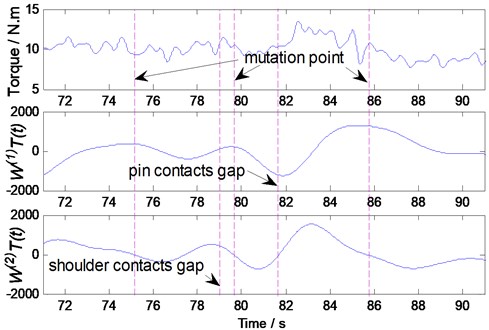
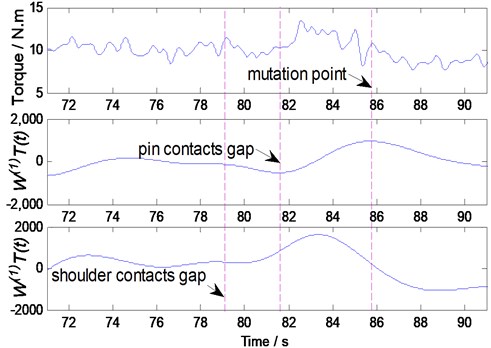
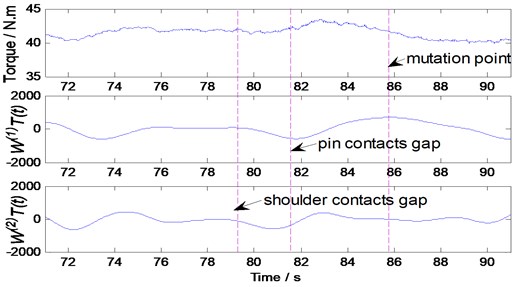
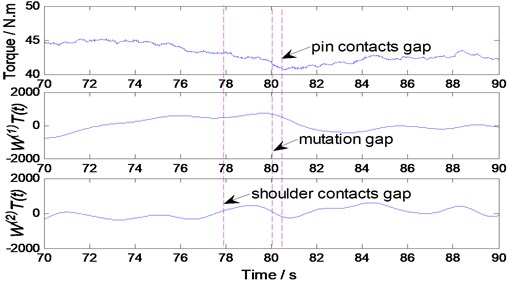
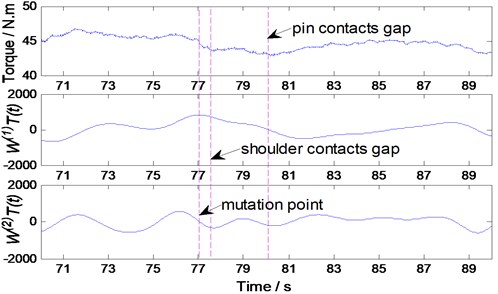
A set of experiments was conducted with various gap sizes, 400 rpm, 170 mm/min and the experimental results are shown in Fig. 11. In this paper, we find that the value of all mutation point is less than a threshold value of 500 when the gap width is zero.
This value is determined to detect the presence of gaps in the Bobbin tool friction stir welding operations. It is worth mentioning, the value is only applicable to the particular process parameters and welding conditions considered in this study. For another BTFSW operation, further experimentation would be required to determine a suitable threshold value.
A set of experiments were conducted to validate the algorithm. The process parameters for each test are given in Table 1. The negative value indicates the algorithm detected the gap after the pin contacts the gap. In most cases, the gaps were detected successfully when the distance between pin and gap was 2 mm or more. This attribute the shoulder contacts the gap well in advance of the pin. As the shoulder contacts the gap, the material flows into the gap, thus, relieving pressure on the pin and decreasing the torque. Seen from this perspective, the larger the shoulder diameter the more quickly for detecting gaps.
Fig. 10The WTs of the upper envelope of main periodic torque signal operations with N= 350 rpm, V= 170 mm/min, and 0.35 mm gap
a) Torque and WT with 1
b) Torque and WT with 1.3
Table 1The process parameters and detection time
Experiment number | Gap width (mm) | Rotary speed (rpm) | Travel speed (mm/min) | Value | Detection time (s) |
1 | 0.3 | 350 | 190 | 612 | –1.58 |
2 | 0.6 | 350 | 130 | 844 | 2.83 |
3 | 0.6 | 350 | 190 | 755 | 0.68 |
4 | 0.3 | 350 | 130 | 683 | 1.59 |
5 | 0.6 | 500 | 190 | 685 | –0.79 |
6 | 0.6 | 500 | 130 | 1356 | 3.53 |
7 | 0.2 | 400 | 170 | 693 | –4.5 |
8 | 0.3 | 500 | 130 | 1043 | 1.35 |
9 | 0.5 | 400 | 170 | 873 | 2.13 |
10 | 0.6 | 400 | 170 | 1152 | 2.32 |
11 | 0.45 | 400 | 110 | 715 | 3.37 |
12 | 0.45 | 400 | 200 | 637 | –1.87 |
Fig. 11Torque and WTs for BTFSW operations with N= 400 rpm, V= 170 mm/min
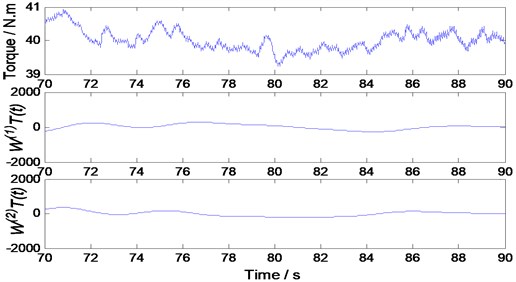
a) Without gap
b) 0.2 mm gap
c) 0.3 mm gap
d) 0. 5 mm gap
4. Conclusion
Firstly, in this study, mechanical vibration signals and torque signals have the same vibration frequency, however, the torque signal presents a relatively stable periodic characteristics. Compared with the upper envelope of the main periodic signal, the low frequency torque is more suitable for detecting.
Secondly, a combined method was presented which may be utilized for detecting gaps in bobbin tool friction stir welding operations. The experimental results demonstrate that the algorithm is able to reliably detect the presence of gaps for traverse speeds below 200 mm/min and gap sizes above 0.3 mm. However, for different welding scenarios, as for different filters, different scale factor () and different threshold values would be required.
Finally, the algorithm proposed in the study will be useful in BTFSW weld inspection. Also, it will be a promising non-destructive evaluation technique to find a defect such as wormholes inside the weld. Vibration signal is also helpful for understanding the mechanism of BTFSW.
References
-
Thomas W. M., Wiesner C. S., Marks D. J., Staines D. G. Conventional and bobbin friction stir welding of 12 % chromium alloy steel using composite refractory tool materials. Science and Technology of Welding and Joining, Vol. 14, Issue 3, 2009, p. 247-253.
-
Hilgert J., Schmidt H. N. B., dos Santos J. F., Huber N. Thermal models for bobbin tool friction stir welding. Journal of Materials Processing Technology, Vol. 211, Issue 2, 2011, p. 197-204.
-
Deloison D., Jacquin D., Gurin B., Desrayaud C., Marie F. Simplified models for bobbin-tool FSW process. 3rd FSW Modelling and Material Flow Visualisation Seminar, Geesthacht, 2008.
-
Sued M. K., Pons D., Lavroff J., et al. Design features for bobbin friction stir welding tools: development of a conceptual model linking the underlying physics to the production process. Materials and Design, Vol. 54, Issue 0, 2014, p. 632-643.
-
Elangovan K., Balasubramanian V. Influences of tool pin profile and welding speed on the formation of friction stir processing zone in AA2219 aluminium alloy. Journal of Materials Processing Technology, Vol. 200, Issues 1-3, 2008, p. 163-175.
-
Su H., Wu C. S., Pittner A., et al. Simultaneous measurement of tool torque, traverse force and axial force in friction stir welding. The Society of Manufacturing Engineers, Vol. 15, Issue 4, 2013, p. 495-500.
-
Cui S., Chen Z. W., Robson J. D. A model relating tool torque and its associated power and specific energy to rotation and forward speeds during friction stir welding/processing. International Journal of Machine Tools and Manufacture, Vol. 50, Issue 12, 2010, p. 1023-1030.
-
Ramulu Janaki P., Narayanan Ganesh R., Kailas Satish V., Jayachandra Reddy Internal defect and process parameter analysis during friction stir welding of Al 6061 sheets. The International Journal of Advanced Manufacturing Technology, Vol. 65, 2013, p. 1515-1528.
-
William R. L., Alvin M. S., George E. C., Paul A. F. Torque control of friction stir welding for manufacturing and automation. The International Journal of Advanced Manufacturing Technology, Vol. 51, Issues 9-12, 2010, p. 905-913.
-
Yu Yang, Prabhanjana Kalya, Landers Robert G., Krishnamurthy K. Automatic gap detection in friction stir butt welding operations. International Journal of Machine Tools and Manufacture, Vol. 48, 2008, p. 1161-1169.
-
Nandan R., Debroy T., Bhadeshia H. K. D. H. Recent advances in friction stir welding – process weldment structure and properties. Progress in Materials Science, Vol. 53, 2008, p. 980-1023.
-
Takahara H., Motoyama Y., Tsujikawa M., Oki S., Chung S. W., Higashi K. Allowance of deviation and gap in butt joint on friction stir welding. Advances in Materials Research, Vol. 15, Issue 17, 2006, p. 375-380.
-
Wanjara P., Monsarrat B., Larose S. Gap tolerance allowance and robotic operational window for friction stir butt welding of AA6061. Journal of Materials Processing Technology, Vol. 213, 2013, p. 631-640.
About this article

This study was supported by the National Natural Science Foundation of China ((51205175 and 51375218), and the Project Funded by the Priority Academic Program Development of Jiangsu Higher Education Institution). Jianghui Dong is supported by Australian Postgraduate Award (APA) Ph.D. scholarship and Vice Chancellor and President’s Scholarships (University of South Australia).
Data collection: Shujin Chen, Yangrui Ni and Yang Zhou. Data analysis and interpretation: Shujin Chen, Yangrui Ni and Yang Zhou. Drafting manuscript: Shujin Chen, Sheng Lu and Jianghui Dong. Revising manuscript content: Shujin Chen and Jianghui Dong.
The authors confirm that this article content has no conflicts of interest.
