Abstract
The equi-intensity cantilever beam experiments are designed and performed based on the theoretical research of Fiber Bragg Grating (FBG) sensing technology in this paper. The FBG sensor and the strain gauge are pasted on the surface of cantilever beam, the strain is produced by adding weights. The measurement data is obtained by data acquisition and processing. Compared with the measurement data result by strain gauge method, the measurement data from the FBG strain measurement method is closer with the theoretical calculating values. And the data result by FBG method have the advantages of excellent linearity and high precision, thus the strain measurement method based on FBG is accurate and feasible.
1. Introduction
In engineering, a traditional way to obtain strain data is by strain gauge measurements. In the measurements, strain gauges are pasted on the surface of work pieces, and the resistance of the strain gauges will change correspondingly with the strain produced by loading. By tests and calculations, the stains at the measured points are obtained. However, since the stain gauges can be easily affected by circumstance factors, such as electromagnetic fields, temperature, moisture and chemical corrosion, its application is limited to a certain extent.
In recent years, as a new optical passive device, FBG sensors have been applied in the fiber sensing area widely. With the characters of explosion proof, immunity to electrical interference, radiation and corrosion, thermostability, small size, light weight and flexibility, FBG can be used under harsh circumstances repeatedly. What’s more, one fiber can be made into dozens of sensors to constitute a distributed sensing system theoretically.
To verify the feasibility and accuracy of the FBG strain measurement, equi-intensity cantilever beam experiments are designed and performed in this paper, and two methods using a FBG sensor and a strain gauge are adopted respectively, after data acquisition and processing, the testing data are compared with the theoretical values respectively. The results indicate that FBG strain measurement method is feasible and accurate.
2. FBG principle
FBG is based on ultraviolet exposure technology to produce the period distributions of refractive index. Since fiber is photosensitive, when illuminated by ultraviolet light, the refractive index will be changed permanently. The Bragg wavelength drift reflects the change of external parameters, when the optical signal is injected to a fiber, a part of signal is reflected back and a part transmits through the fiber, as shown in Fig. 1.
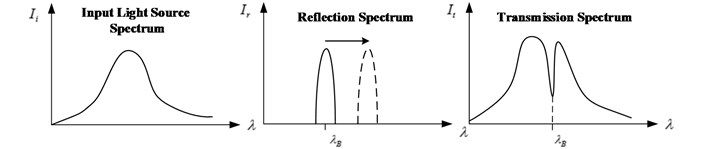
The incident light from the light source illuminates into the transmission fiber, and a serious of narrow spectrum including Bragg wavelength is reflected into the wavelength detection instrument by grating. The un-reflected penetration spectrum is short of this spectrum, as shown in Fig. 2. The Bragg wavelength drift caused by strain can be obtained through the spectrum of reflection and transmission light.
Fig. 1The structure of FBG
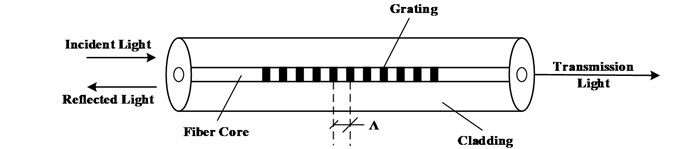
Fig. 2Sensing process of FBG
The Bragg reflection wavelength is:
where is the reflection wavelength, is the effective refractive index, and is the grid spacing. Thus the Bragg wavelength depends mainly upon and . Since FBG is sensitive to strain, when a grating is stretched or compressed, the grating cycle will be changed, thus center wavelength drift.
Differentiating both sides of Eq. (1), the following equation is obtained:
When dividing Eq. (1) by Eq. (2), the result can be expressed as:
where is the change of refractive index, is the change of grid spacing. Regardless of waveguide effects, which means without consideration the influence of fiber axial deformation on the refractive index, the refractive index change in uniaxial elastic deformation can be described as:
where is the axial strain, is the Poisson ratio, and are elastic-optic constants, is the valid elastic-optic constant. If FBG is absolutely uniform, that is, the relatively change rate of grid spacing is consistent with the physical length of the grating section. In the linear elastic range:
Thus at constant temperature, the mathematical relationship between strain and wavelength drift can be expressed as:
For the fibers of the same material, the strain sensitivity ratio is invariable, which theoretically ensures that FBG sensor has an excellent linear output, thus the center wavelength drift can be easily transformed to the strain change.
3. Experimental procedure
Equi-intensity cantilever beam is used in the strain measurement experiment. As shown in Fig. 3, the FBG sensor and the strain gauge are pasted in the same area of the root. A certain weight is added on the other side to produce strain, the data are measured and processed, then compared with the theoretical calculating value to verify the feasibility and accuracy of the method.
Fig. 3The equi-intensity cantilever beam device
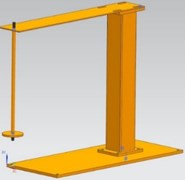
Fig. 4Measured point of the cantilever
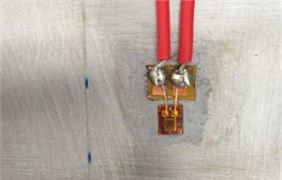
SM125 FBG demodulation produced by American Micron Optics Company is used in the experiment, whose sensitivity is 0.1 pm and sampling frequency is 2 Hz, and the center wavelength of FBG sensor without strain is 1531.0218 nm at room temperature. DEVE-1201 produced by Austrian DEWETRON Company is adopted as data acquisition system for strain gauge data, and the strain gauges with resistance 120 Ω are pasted in-line.
As shown in Fig. 4, The FBG sensor and the strain gauge are pasted 358 mm away from one side of the equi-intensity cantilever beam, where added weights, the cantilever is 59 mm wide and 3.7 mm thick; the position of the cantilever is fixed, and the FBG sensor and strain gauge are connected to the data acquisition instrument; at room temperature, 1000 g, 2000 g, 3000 g and 4000 g weights are added sequentially, thus the cantilever bends down to produce strain; the signal emitted by the broadband light source which is internal integrated in the FBG demodulation, is transferred to the sensor through FBG, and the reflection light is transmitted into the FBG demodulation, meanwhile, the wavelength is displayed on the computer.
4. The theoretical calculating of strain
The relationship between normal stress and strain is as following:
where is the normal stress exerted on the equi-intensity cantilever beam, is the strain, is the elasticity modulus. Since:
where is the torque of the measured point, and , is the force applied on the cantilever, namely loading. is the distance from the point where added weights to the point where pasted the sensor. is section modulus in bending, and , in which is the width and is the thickness of the cantilever.
So the equation is as following:
In the experiment, 1000 g, 2000 g, 3000 g and 4000 g weights are added on the scale pan gradually, the distance from the point where added weights to the point where pasted the sensor is 385 mm, the cantilever is 59 mm wide and 3.7 mm thick, and the elasticity modulus 210 GPa. All the parameters are taken into Eq. (10), then the theoretical values can be obtained and given in Table 1.
Table 1Theoretical calculating values
Weights (g) | 0 | 1000 | 2000 | 3000 | 4000 |
Theoretical value (με) | 0 | 131.685 | 263.370 | 395.055 | 526.740 |
5. Experiments and analysis
The position of cantilever is fixed, and the FBG sensor and the strain gauge are accessed to the data acquisition instrument, then at room temperature, 1000 g, 2000 g, 3000 g and 4000 g weights are added sequentially. The strain data of strain gauge over sampling points are shown in Fig. 5.
Fig. 5Strain data of strain gauge
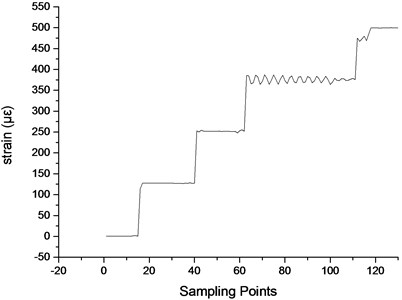
Fig. 6Strain and wavelength data of FBG
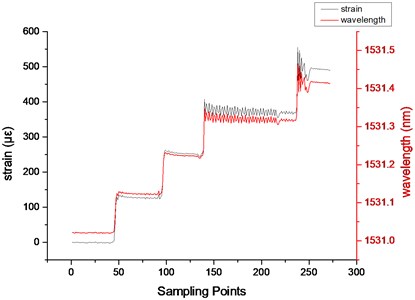
The center wavelength of reflection light in FBG is shifting with the weights. Without strain, the wavelength is about 1531.0218 nm, thus the wavelength drift can be obtained by subtraction. The strain sensitivity ratio is 0.8 pm/με, then the strain data of FBG can be calculated in the measurement experiment, as shown in Fig. 6.
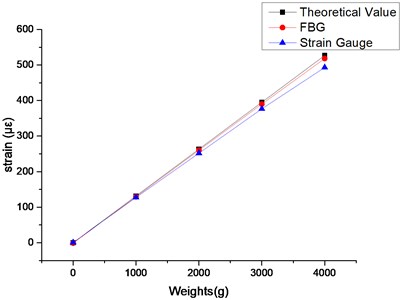
Taking the average of the data in the stable state, the strain results over weights are shown in Table 2 and Fig. 7.
Table 2Strain data
Weights (g) | 0 | 1000 | 2000 | 3000 | 4000 |
Theoretical value (με) | 0 | 131.685 | 263.370 | 395.055 | 526.740 |
FBG (με) | 0.836 | 129.32 | 260.32 | 390.01 | 518.22 |
Strain gauge (με) | 0.675 | 127.54 | 251.92 | 376.68 | 493.02 |
Strain data based on the FBG method and strain gauge method exhibit great linear relationship with loading, and the linear fitting rate of FBG method is above 0.999; compared with the theoretical values, the relative errors of the FBG method are about 1.16 %-1.79 % and the relative errors of the strain gauge method are about 3.14 %-6.4 %. According to the analysis, strain measurement based on FBG has advantages of excellent linearity and high precision, thus the method is accurate and feasible.
Fig. 7Strain data over weights
6. Conclusions
Equi-intensity cantilever beam experiments are designed and performed in this paper, in which the FBG sensor and the strain gauge methods are adopted. After data acquisition and processing, the measurement data received from the FBG and the strain gauge are compared with the theoretical calculating values respectively. Experimental results show that the FBG data have excellent linearity and high precision, thus the strain measurement method based on FBG sensor is accurate and feasible. Since the incomparable superiorities and characters, such as immunity to electrical interference and corrosion, thermosstability, and high precision, FBG can be adopted in the strain measurement under complex circumstance and has broad application prospects.
References
-
Geng Shuwei, Yu Youlong Fiber Bragg Grating time multiplexed sensor system. Journal of Harbin Insitute of Technology, Vol. 34, Issue 2, 2002, p. 204-206.
-
Jiang Desheng, He Wei Review of applications for fiber Bragg grating sensors. Optoelectronics Laser, Vol. 4, Issue 13, 2002, p. 420-430.
-
Lin Junyou, Wang Wenhua, Wang Xiaoxu Study of application and evolution of fiber grating sensors technique. Dalian University Technology, Vol. 44, Issue 6, 2004, p. 931-936.
-
Davis M., Kersey A. All fiber Bragg grating strain-sensor demodulation technique using a wavelength division coupler. Electronics, Vol. 30, 1994, p. 75-77.
-
Melle S. M., Liu K. A passive wavelength demodulation system for guided-wave Bragg grating sensors. IEEE Photonics Technology Letters, Vol. 4, 1992, p. 516-518.
-
Hill K. O., Meltz G. Fiber Bragg grating technology fundamentals and overview. Journal of lightwave Technology, Vol. 15, Issue 8, 1997, p. 1263-1276.
-
Liang Lei, Jiang Desheng, Xu Qiuming Application status of fiber optic sensors in bridge engineering. Optics and Optoelectronic Technology, Vol. 2, 2003.
-
Li Qiaozhen, Li Gang Experiment and application of resistance strain gauge. Laboratory Research and Exploration, Vol. 4, 2011, p. 134-137.
-
Ma Gongxun, Xu Yuwen Determination and analysis of beam stress intensity. Physical and Chemical Test, Vol. 38, Issue 8, 2002, p. 72-76.
About this article
This is supported by the National Key Scientific Instrument Development Projects, No. 2013YQ470765.
