Abstract
The results of the research directed towards solving the task of automatic detection of wear and mechanical defects of internal combustion engines, are presented in the paper. The fractal geometry assumptions were applied in defining diagnostic features depended on the time scale of observations. Investigations were performed by means of the detrended fluctuation analysis. The scaling curves for the fluctuation function and singularity spectra of vibration signals obtained in monitoring a valve system of a spark ignition engine, were determined. The Hurst exponent, multifractality level and singularity exponent of a signal were tested as defects measures.
1. Introduction. Reasons for undertaking the problem
A diagnostics of complex mechanical systems of vehicles by means of vibration time series analysis requires the identification of dynamic models both in a serviceable and unserviceable state, which is usually difficult. Random and non-linear character of occurring changes is a consequence of internal processes as well as an adaptation to changing conditions forced by surroundings or by the control system. An observation of vibration signals in a drive system of vehicles reveals non-stationary and scale-variable properties. Recorded time series indicate fluctuations in wide ranges of time scales.
The dynamics of such systems can be modelled by direct investigations of experimental data sets in various time scales, based on the fractal statistic. Knowing of an individual fractal measure is not always sufficient for the total characteristic of the investigated signal, since this is an averaged value concerning the analysed scale range. In order to describe the dynamics of the system consisting of several interleaving fractals of various dimensions, it means multifractal, the spectrum of dimensions, called the singularity spectrum, should be considered. For each point of the time series the measure which attributes weight to its individual parts should be assumed. The spectrum obtained as the decomposition result can be treated as a multifractal dimension related to the singularity, representing the local scaling of the measure in different places of the time series. Along with the scaling exponent decrease the singularity measure increases.
Due to a relatively simple way, suitable for the numerical implementation, the results presented in the paper are based on the box dimension called also the volumetric dimension [1]. As the box fractal dimension of the time series the curve dimension – being the diagram of the considered signal – was assumed. When is a minimal number of sets coinciding with the given time series, and is the scale then . This yields:
The principle of the estimation process of the fractal dimension for the tested engine block vibration acceleration signals obtained in monitoring a valve system is illustrated in Fig. 1.
Self-similar time series or time series having the self-similarity property after integration describe multifractal dimensions , corresponding to Hurst exponents [2] for various scaling ranges, according to Eq. (2):
where is the number of samples of the observed signal.
The multifractal (MF) version [3, 4] of the detrended fluctuation analysis algorithm (DFA), [5, 6] was used for the determination of the Hurst exponents. The MF-DFA allows investigating the observed signals with regard to their multifractality and assures more stable approach to the multifractal formalism than the previously applied wavelet transform modulus maxima (WTMM) method [7].
Fig. 1Illustration of the box fractal dimension
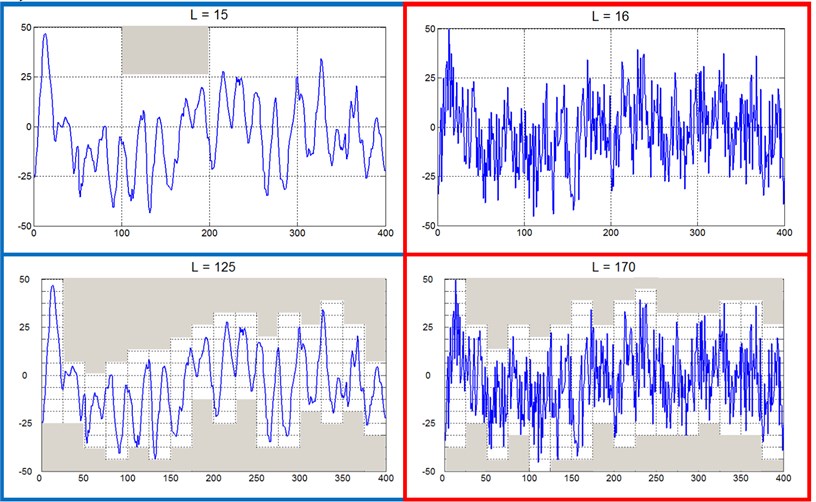
a) Accelerations of engine block vibrations in various scales
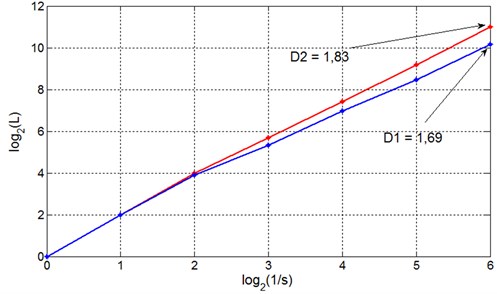
b) Scaling of signals
2. Detrended fluctuation methods in the task of signals transformation from the time domain into the singularity domain
The detrended fluctuations analysis constitutes an important tool in investigations of scale-variable and long-term properties as well as in the selection and classification of diagnostic properties of signals generated by complex vibrating systems. The detection of defects of the toothed gear, by means of the features vector formed of the vibrations signals fluctuation function and the principal components analysis (PCA), was performed in paper [8]. The way of fractal vibrodiagnostics of rotating systems by means of the DFA algorithm, on the bases of compensated data obtained from the monitoring of bearings operating at various loads and rotational speeds, was proposed and verified in study [9]. Diagnostic features of bearings defects on the bases of parameters of the spectrum of multifractal vibrations signals obtained as the result of MF-DFA algorithm, was defined in papers [10, 11]. The way of detection of bearing and toothed gears defects on the bases of the Hurst exponents determined at various scaling ranges of the signals fluctuation curves, was proposed. The multifractality of bearings vibration signals was also used in the diagnostic method encompassing a signal decomposition into several intrinsic scale components (ISCs) and features hidden in each major ISC and the extraction using MF-DFA [12].
Investigations presented in the hereby paper were realised in two stages. The first part of the procedure contains the trend elimination from the signal and the Hurst exponent determination by scaling the fluctuation function, while the second one leads to the multifractal spectrum obtained by the Legendre transform of the singularity exponent.
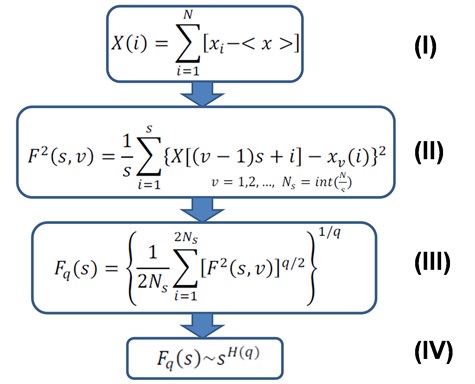
Let us assume that the observed time series contains samples. The algorithm shown in Fig. 2 contains:
Step I. Defining of the accumulated, centred random variable for the time series with the expected value equal to .
Step II. Dividing the centred accumulated sum into separable segments of a length , starting the division once from the beginning and the second time from the end. In this way we obtain of segments . By the least square method we determine – for each segment – the profile represented by the -degree multinomial and perform detrending.
Step III. Averaging of the calculated variances for all segments and determination the fluctuation function of the order equal to .
Step IV. Repetition of steps II – III for various time scales and the analysis of a power-law fluctuation dependencies, in bilogarithmic scale, in order to describe the generalised Hurst exponent .
Fig. 2Algorithm 1 (MF-DFA)
The value for can not be determined on the bases of the dependency given in step III of the algorithm, as in Fig. 2. In this case we use the logarithmic mean:
In the special case, for we obtain the dependence defining fluctuation in the DFA method:
Statistically reliable assessing of exponents requires the scale range selection within limits: . The improvement of anti-persistent signals, of the Hurst exponents values being near zero, allows the time series integration before starting the MF-DFA procedure. The dual integration leads to obtaining exponents of the fluctuation function of values increased by 1, it means: .
For monofractals the exponent , while for multifractals it is a decreasing function. For negative values of the order, the generalised Hurst exponent describes scaling properties in segments of a low fluctuation level, while if we consider positive values of the order, segments of high variances are shaping the fluctuation function.
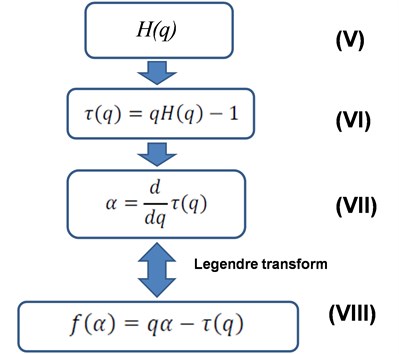
Knowledge of the generalised Hurst exponent allows to determine the generalised multiscaled exponent , of local scaling represented by the singularity exponent and singularity spectra according to dependencies given for steps VI, VII and VIII of the algorithm shown in Fig. 3.
Fig. 3Algorithm 2 (Determining the singular spectrum of the signal)
3. Realisation of the multiscale diagnostic process of the engine valve system
Examinations were performed during road tests on the four-cylinder engine of spark ignition. Series of engine vibration measurements for various rotational speeds and loads were performed. The main measuring path included the piezoelectric vibration sensors B&K Delta Shear type 4393 of a frequency range: 0.1-16500 Hz, resonance frequency 55 kHz and work temperatures from –74 to +250 °C, fastened by means of a joint screwed into the engine side at cylinder 1, and the portable device for recording data B&K PULSE type 3560E. Accelerations of engine block vibrations were recorded in the vertical and horizontal directions with a frequency of 65536 Hz. Then the signal was pre-processed with antialiasing filter to avoid amplifying the components in the natural frequency band of the vibration sensor.
Apart from the engine vibrations signal also the crankshaft position signal, throttle position and signals from the ignition coil at 1 and 4 cylinder were recorded. Additional signals enabled the identification of engine working cycles, injection moments, ignition and timing of gear phases. Signals of 1-minute duration were recorded during driving with a constant speed. Small speed fluctuations were eliminated during further analysis. Maintaining the constant rotational speed of the engine is essential, since this parameter has a significant influence on the vibration amplitude. A load influence is not as important as speed. The vibration signal was resampled in order to equalise the number of samples analysed in each cycle of engine operations. This procedure enabled changing the domain from the time into the angle of rotation of the crankshaft, during the analysis [13, 14].
Examinations were performed for various maintenance states of the exhaust valve system:
• Valve in a good working order, optimal clearance 0.25 mm (ZN);
• Valve in a good working order, increased clearance +0.06 mm (ZNL+);
• Valve in a good working order, decreased clearance –0.06 mm (ZNL-);
• Valve out of order I (small defect), optimal clearance (ZU small);
• Valve out of order II (big defect), optimal clearance (ZU big).
The resampled, integrated signal of a length of two work cycles of the SI engine (7200 samples) were divided into segments of the same length. In each segment the linear trend was determined and then removed.
3.1. Vibrodiagnostic feature extraction of exhaust valve system using RMS fluctuation and crossover points
The RMS fluctuation of the trendless integrated time series was determined from equation in step III of the Algorithm 1. It was performed for the set of time scales s of the length from 4 to 1024 samples, to obtain the time independent measure. The connection between the average fluctuation and the segment (scale) size for the tested cases of the exhaust valve defects, were determined for 30 time series. In order to determine the Hurst exponent the approximation of curve in the double logarithmic diagram by straight lines for three scale ranges: 6-64, 64-128, 128-1024 was performed.
The first singled out scale range was characterised by the inclination coefficient: 0 0.5, which means long-range anti-correlations. The second scale range of the inclination coefficient: 0.5 1 indicates occurring of long-range power-law correlations, however as the defect grows the coefficient falls below 0.5. In the third range the inclination coefficient 1 indicates the correlation occurrence but not of an power-law character. It is the result of the occurrence of harmonic components originated from driving shafts and cylinders operations. The Hurst exponent versus the Hurst exponent was used for the classification of the simulated maintenance states. The data were classified by the nearest neighbour method.
The possibility of the recognition of the serviceable state and selected unserviceable states was achieved. Detailed results of this part of investigations are presented in paper [13].
3.2. Feature selection and classification using singularity spectrum of vibration signal
To improve the accuracy and allow classifications of all simulated states the generalised Hurst exponent was determined, within orders from minus five to plus five, and the corresponding to it multiscale exponent of the monitored exhaust valve system of the engine. Averaged results of these algorithm steps are presented in Fig. 4.
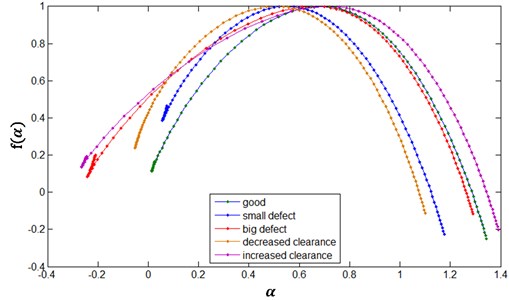
The spectrum obtained as the decomposition result (Fig. 5) can be treated as the multifractal dimension related to the singularity representing local scaling of the measure in various places of the time series.
Curves obtained during investigations have various shapes. The classification of simulated maintenance states was performed using defects index built on the basis of the multifractality level: delta, which represented heterogeneity of the tested signal. This feature was defined as a difference of zero points of functions approximating curves of signals singularity spectra. As the second feature the singularity exponent: , for which the singularity spectrum obtains its maximal value, was assumed. This is the most often seen singularity in the analysed signal. The selected features indicate a small interclass scatter as compared with the scatter in between individual maintenance states. Fig. 6 shows plots of the multifractal levels listed versus the singularity exponents.
Fig. 4Exhaust valve system data for tested maintenance states
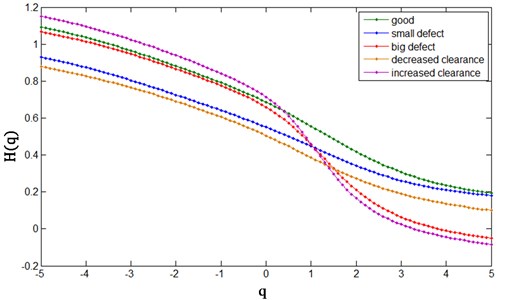
a) Generalized Hurst exponent
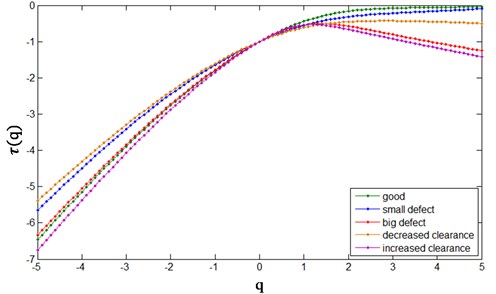
b) Generalized scaling exponent
Fig. 5Singularity spectrum of signals of the valve system vibrations in tested maintenance states
Categorising the tested system state to the relevant class and the analysis of the classification quality was carried out by means of the k-nearest neighbours method. The Euclidean square distance as the measure was chosen and the integer was selected. In the accuracy assessing the technique of 5-times cross-validation was used. The classification accuracy was assessed on the basis of the ratio of the number of properly classified experimental results to their total number.
In each maintenance state the identical series of test experiments were performed. Each test observation generated 100 new data points designated by the selected pair of features. The serviceable state and all simulated unserviceable states were separated. In the context of 500 predictions the confusion matrix of the classification is shown in Table 1.
Fig. 6Scatter plot of the multifractal level and singularity exponent. Sample data
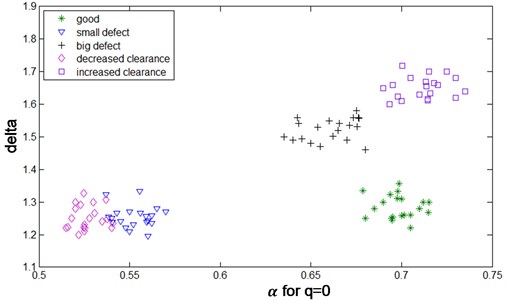
Table 1The confusion matrix for 5 maintenance states of the engine valve system classifier
Simulated state | Diagnosis | ||||
ZN | ZU small | ZU big | ZNL- | ZNL+ | |
ZN | 100 | 0 | 0 | 0 | 0 |
ZU small | 0 | 90 | 0 | 10 | 0 |
ZU big | 0 | 0 | 100 | 0 | 0 |
ZNL- | 0 | 12 | 0 | 88 | 0 |
ZNL+ | 0 | 0 | 0 | 0 | 100 |
4. Conclusions
Scaling curves of fluctuating functions as well as singularity spectra of the vibration signals of the monitored valve system of SI engine were analysed. The application of a singular time series of one variable is justified since, according to the Takens delay embedding theorem, all other dynamic variables of this system are influencing such series. Observations confirmed that scaling curves for time signals – after their angular resampling – are changing during maintenance. Scale-variable features reveal in vibration signals. The transformation process was based on the MF-DFA algorithm, in which detrending by the 2nd degree polynomial was applied. In the first stage of the analysis, using the RMS fluctuation and crossover points, Hurst exponents were verified as defects measures within scale ranges corresponding to the long-term anti-correlations and correlations of signals. The method allows to detect an initial defect of a valve and a decreased valve clearance. At a large valve defect and increased valve clearance the areas on the plane are weakly separable and it can happen that – at a certain phase of the defect – they can overlap. The second stage of the study contained transformation of signals from the time domain into the singularity domain. The multifractality level and the singularity exponent of signal were assumed as diagnostic features allowing to classify all simulated maintenance states of the engine valve system. Experiments performed on-line confirmed the efficiency of the proposed method in various load conditions, rotational speed and engine temperature. Further investigations – currently performed – contain other typical damage states occurring in the maintenance of the engine SI exhaust valves system.
References
-
Li J., Du Q., Sun C. An improved box-counting method for image fractal dimension estimation. Pattern Recognition, Vol. 42, 2009, p. 2460-2469.
-
Hurst H. E. Long term storage capacity of reservoirs. Transactions of the American Society of Agricultural Engineers, Vol. 116, 1951, p. 770-799.
-
Kantelhardt I. W. Fractal and Multifractal Time Series, Mathematics of Complexity and Dynamical Systems, 2011, p. 463-487.
-
Kantelhardt J. W., Zschiegner S. A., Koscielny-Bunde E., Havlin S., Bunde A., Stanley H. E. Multifractal detrended fluctuation analysis of nonstationary time series. Physica A, Vol. 316, 2002, p. 87-114.
-
Peng C. K., Havlin S., Stanley H. E., Goldberger A. L. Quantification of scaling exponents and crossover phenomena in nonstationary heartbeat time series. Chaos, Vol. 5, 1995, p. 82-87.
-
Bashana A., Bartsch R., Kantelhardt J. W., Havlin S. Comparison of detrending methods for fluctuation analysis. Physica A, Vol. 387, 2008, p. 5080-5090.
-
Turiel A., Pe´rez-Vicente C.J., Grazzini J. Numerical methods for the estimation of multifractal singularity spectra on sampled data: a comparative study. Journal of Computational Physics, Vol. 216, 2006, p. 362-390.
-
Moura E. P., Vieira A. P., Irmao M. A. S., Silva A. A. Applications of detrended-fluctuation analysis to gearbox fault diagnosis. Mechanical Systems and Signal Processing, Vol. 23, 2009, p. 682-689.
-
Moura E. P., Souto C. R., Silva A. A., Irmao M. A. S. Evaluation of principal component analysis and neural network performance for bearing fault diagnosis from vibration signal processed by RS and DF analyses. Mechanical Systems and Signal Processing, Vol. 25, 2011, p. 1765-1772.
-
Lin J., Chen Q. Fault diagnosis of rolling bearings based on multifractal detrended fluctuation analysis and Mahalanobis distance criterion. Mechanical Systems and Signal Processing, Vol. 38, 2013, p. 515-533.
-
Lin J., Chen Q. A novel method for feature extraction using crossover characteristics of nonlinear data and its application to fault diagnosis of rotary machinery. Mechanical Systems and Signal Processing, Vol. 48, 2014, p. 174-187.
-
Liu H., Wang X, Lu Ch. Rolling bearing fault diagnosis based on LCD-TEO and multifractal detrended fluctuation analysis. Mechanical Systems and Signal Processing, Vols. 60-61, 2015, p. 273-288.
-
Puchalski A., Komorska I. Looking for vibrational measure of vehicle powertrain using multifractal analysis. Vibroengineering Procedia, Vol. 3, 2014, p. 351-356.
-
Puchalski A. A technique for the vibration signal analysis in vehicle diagnostics. Mechanical Systems and Signal Processing, Vols. 56-57, 2015, p. 173-180.
About this article
