Abstract
The report presents the analysis of the influence of body structure on the propagation of vertical vibration in selected regions of a seated human body. The first part of this paper describes the experiment, paying particular attention to the conditions of the study and the variation of anthropometric features of the participants of the experiment. The second section discusses the results of the experimental simulation with particular emphasis on the relationship between selected values characterizing dynamic properties and basic anthropometric parameters of a human body.
1. Introduction
A vehicle that meets the vibrational comfort requirements should be equipped with an appropriately selected body suspension, cab and driver seat. The driver seat mounting should have characteristics adjusted to the vehicle and the cabin springing systems. It should also take into account the parameters of sitting person’s (either driver or passenger) dynamic characteristics.
The guidelines for determining comfort and the impact of whole-body vibrations as well as rotational motion upon passengers and crew of transport vehicles are provided in the ISO 2631-4:200l standard.
The assessment of suspensions may be performed by means of [1-3]: digital simulation, physical simulation (using testing stands) and real-life studies.
Digital simulations utilise anthropodynamic models of a sitting person. In case of real-life studies, as well as physical simulations, anthropodynamic dummies are used increasingly often than living human beings. The dummies imitate dynamic characteristics and structure of a human body. The variety of structures and characteristics of both anthropodynamic models [4-6] and dummies [6-16] lead to a question about the type of a person (tall, short, slim or fat) the model or dummy imitates and which model/dummy to use to ensure reliable imitation of dynamic properties of a sitting person (driver).
Anthropodynamic models are subject to several international standards, such as, among other things, ISO 7962, ISO 5982:1981 and ISO 5982:2001. The model for testing vertical whole-body vibrations, referred to in the ISO 7962, has four degrees of leeway. It describes both mechanical impedance as well as the seat-head transmittance of the vibrations recorded in tested people. Depending on the assumed parameters, the model imitates either a sitting or a standing person. The sitting person model demonstrates a close coherence with the mechanical impedance specified in the standard, despite its significant phase unconformity. The model’s response to vibrations, presented as transmittance, displays a considerable discrepancy in resonance frequency and in frequencies exceeding 25 Hz. The ISO 7962 standard has been replaced with the ISO 5982: 1981 standard with a dual mass model for testing vertical whole-body vibrations. Its structure does not reflect the anatomic structure of a sitting person.
The model defined in the ISO 5982: 2001 standard represents a 75 kg person, assuming that 73 % of its body weight rests on the seat. Given the weight parameters, it imitates a person weighing either 55 or 90 kg. Apart from one specific weight, associated with head, the remaining weights are not associated with any particular part of body.
Despite presenting an entire body of a sitting person, the above models fail to reflect the person’s essential body parts (areas). As a result, they demonstrate a significant kinematic incompatibility with the anatomy of the modelled human being. As the separated masses represent no specific subsystems, using these models for analysing vibrations in selected body parts is unjustified. Moreover, these models fail to take into account the differences in dynamic properties between people. Because of those differences, the model should enable adjusting its parameters to individual characteristics of as many people as possible. It can be achieved by developing a range of individual data obtained from various people. This requires a number of tests since the data provided in the literature is insufficient.
Adjusting the suspension construction of a springing vehicle seat to drivers’ individual characteristics is considerably impeded by individual dynamic, and particularly anthropometric characteristics of drivers. The latter term should be understood as, among other things, height, weight, and measurable anatomic characteristics of a human body, particularly positioning of a spine, etc. It should be noted that anthropometric characteristics of the general adult population (women and men) have a very broad range, which consequently translates into a necessity to adjust parameters of car seat springing. Because of that, this report attempts to demonstrate the connection between selected indicators of dynamic properties and the essential human anthropometric features.
Information about the relation between specific anthropometric features and indicators of dynamic characteristics can significantly facilitate the vibrational comfort of vehicle and passengers, particularly in the vehicles equipped with passive springing that is adjustable for stiffness and absorption. That would allow to select these parameters on the basis of objective information (study results) rather than subjective, often misjudged, choices of drivers. Knowing the relation between driver’s anthropometric characteristics and the dynamic features of a human body may also be useful for improving controlling algorithms in semi-active suspensions.
Semi-active suspensions allow for changing absorption level while driving. It is performed by an automatic controlling systems which reacts to vehicle driving conditions. Implementing the above information into the system and introducing controlling algorithms should significantly improve the comfort of drivers and passengers.
To extend the system with the information about dynamic characteristics of a sitting person, it may be necessary to determine the relation between dynamic characteristics and anthropometric features of a human being. With contemporary technological advancement, identification of the latter is a simple task. The assessment of the impact of anthropometric features upon dynamic characteristics of a sitting person may be performed on the basis of laboratory experiments on the seat-person subsystem [6].
2. Procedure
Studies were carried out on adult men in the 20-24 age bracket, whose basic anthropometric measurements were the basis for the result analysis.
Each of the participants was examined on a backed seat, on which they seated themselves comfortably in order to minimize the weight on their back, abdominal, pelvic, and thigh muscles. A comfortable position, which was possible thanks to adjusting the back, seat, and footrest, allowed for only slight muscle tension and eliminated pressure on internal organs such as the stomach.
Prior to the start of the study, each person had trial runs in order accustom them to behave passively and assume a specific posture relative to the seat during the whole research process.
During the course of the study, acceleration was recorded in four regions of the driver's body along with the seat surface, which comprised the test system. (Fig. 1).
The testing stand for simulation tests of the seat-driver system was built on the basis of the electro-hydraulic inductor (pulsator), manufactured by MTS. The testing stand includes several mutually cooperating systems, such as: MTS electro-hydraulic pulsator unit (Model 244.12) with MTS servovalve (Model 252.25), hydraulic supply unit – Silent flow 505.20, control set – MTS Model 407 Controller, the moving-guiding-system along with the seat, measuring system.
Fig. 1Location of sensors on tested person: 1, 2 – head, 3 – chest, 4 – abdomen, 5 – below buttocks on the seat
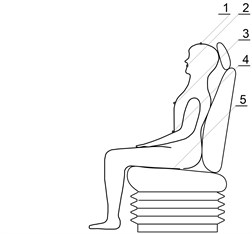
The measuring system consisted of inertial converters for measuring accelerations (Table 1), ADXL 05-8K gauge, a computer with measuring card and software for data acquisition.
Table 1Parameters of acceleration sensors
Maximum measuring range | ±5 g |
Resolution | ±0.005 g |
Non-linearity | 0.2 % |
Range of operating temperature | 0-70 °C |
Measured frequency band | 0-50 Hz |
Resonance frequency | 1200 Hz |
Sensor weigh | 0.01 kg |
During the tests, the inductor (electro-hydraulic pulsator) generated sinusoidal oscillations in a frequency range from 1 to 20 Hz, typical for vibrational comfort analysis in vehicles [17]. Based on literature [4, 18], and pilot studies, frequency intervals were decreased in ranges in which the human body has a large variation in dynamic characteristics. The research was carried out for the following frequencies: 1 Hz, 2 Hz, 2 Hz to 4 Hz every 0.2 Hz, 4 Hz to 10 Hz every 0.25 Hz, and 10 Hz to 20 Hz every 1 Hz, with a maximum acceleration amplitude of 0.25 g [4, 19]. In the course of the study, vertical acceleration was recorded in the head, chest, abdominal regions and seat surface, using sensors mounted on a helmet, mouthpiece, special belts, and an elastic rubber measurement disc.
The participants of the study were characterized by measuring anthropometric quantities such as height, weight, head, chest, and abdomen circumference and torso length. These quantities made it possible to calculate each person’s BMI (Body Mass Index), which was used as a guide when categorizing participants as representative of people with a proper weight indicator, overweight, or underweight.
3. Analysis of the characteristics of participants’ transmittance modes
Based on the recorded acceleration runs, transmittance functions were computed for each participant, which describe the propagation of vertical vibration in bodies of the participants. Characteristics of the transmittance modes of each region of the participants' bodies are shown in Figs. 2-4.
There are many normal modes in systems with multiple degrees freedom. The strongest amplification occurs for lower frequency vibrations. For higher frequencies, vibration in most systems (including the human body) is suppressed enough that successive resonance peaks are less and less visible, and some are not even experimentally observable. For example, if there are two resonant frequencies close together, they often combine into one peak on graphs, covering a wide frequency range. Among the characteristics of the human body, the first resonant peak exhibits relatively large repeatability (in both the abscissa and ordinate). The second peak is much less pronounced, and is difficult to notice in some participants’ results. In particular there is a strong variation in abdomen – seat transmittance. Therefore, it was decided to use the first resonance peaks as a basis for the comparative analysis. Both resonance frequency value (abscissa) and ordinate value (the value of the maximum gain) were compared.
Fig. 2Transmittance between head and seat
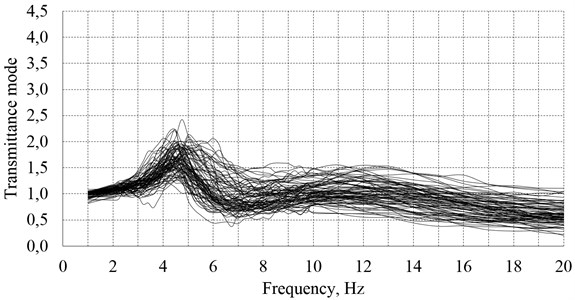
Fig. 3Transmittance between thorax and seat
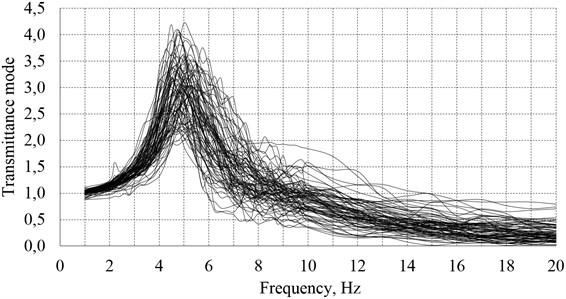
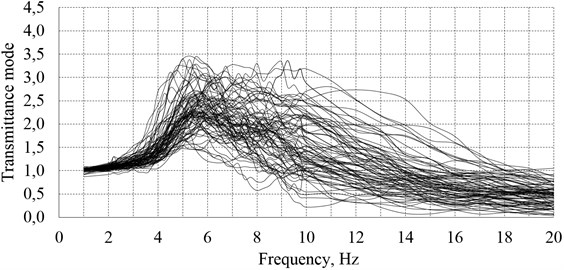
Fig. 4Transmittance between abdomen and seat
The first resonance frequency occurs in a different frequency range for each of the analyzed body regions. More than 80 % of the participants exhibited a first resonance frequency in the head within a range of 4 to 5 Hz, of which nearly 50 % of the people had observed resonance frequencies between 4.5 and 4.75 Hz (Fig. 5(a)). It should be noted, however, that for certain participants, the resonance frequency differs significantly from the ranges above. In general, this resonance was recorded in the range from 3.2 to 11 Hz, as shown in Fig. 5(a).
Fig. 5Distribution of the first resonance frequency for the body regions
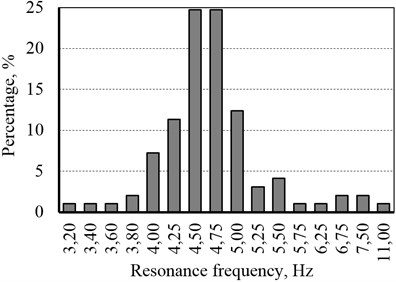
a) Head
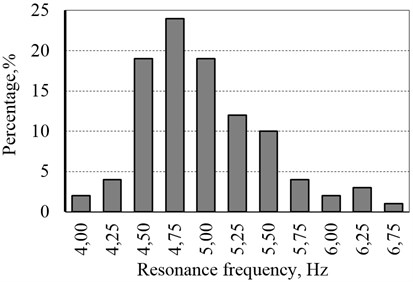
b) Chest
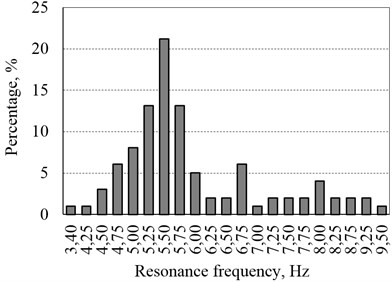
c) Abdomen
For 84 % of the participants, the first resonance frequency of the chest was in the range from 4.5 to 5.5 Hz. For the largest group, which included more than 24 % of the participants, the first resonance frequency registered on the chest was 4.75 Hz. Not that for certain participants, the resonance frequency differs significantly from the ranges above. In general, this resonance occurred in the recordings in the range from 4 to 6.75 Hz which is illustrated in Fig. 5(b). For 77 % of the participants, the first resonance frequency of the abdomen are in the range from 4.75 to 6,75 Hz. For the largest group, which represents more than 21 % of the participants, the first abdominal resonance frequency was recorded at 5.5 Hz. It should be noted, however, that for certain participants, the resonance frequency differs significantly from the ranges above. In general, this resonance was evident in the range from 3.40 to 9.50 Hz, which is illustrated in Fig. 5(c).
The values of the measured amplitudes of the first resonant frequencies in the selected frequency ranges are shown in Fig. 6. The maximum range of variation in the amplitudes for the head and chest is more than 47 %, and over 56 % of the maximum gain in the resonance frequency in the abdomen.
The first resonant frequency and the amplitude at that frequency were used as values describing the dynamic properties of the human body.
These dynamic properties were then analyzed for correlation with anthropometric traits (body weight, height, abdominal and chest circumference).
Examples of the relationships between the measured characteristics are shown in Figs. 7-11.
Fig. 6Ranges of variation in the acceleration amplifications
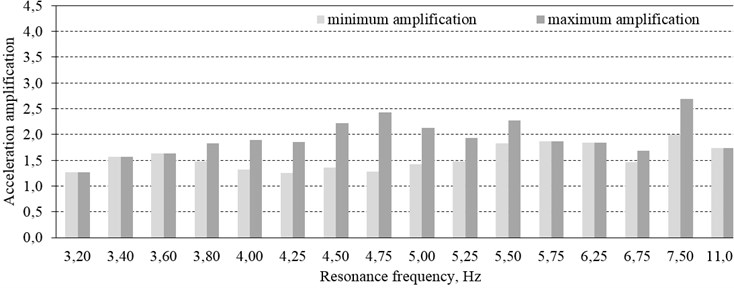
a) Head over a frequency range 3,2-11 Hz
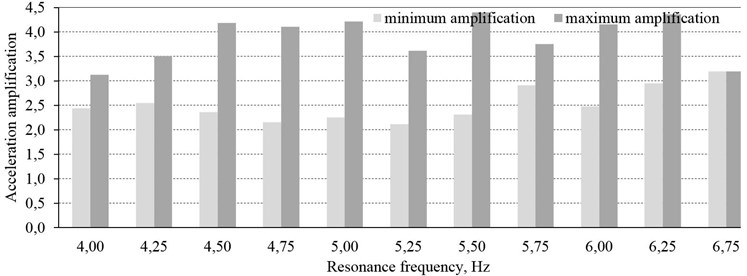
b) Chest over a frequency range 4-6,75 Hz
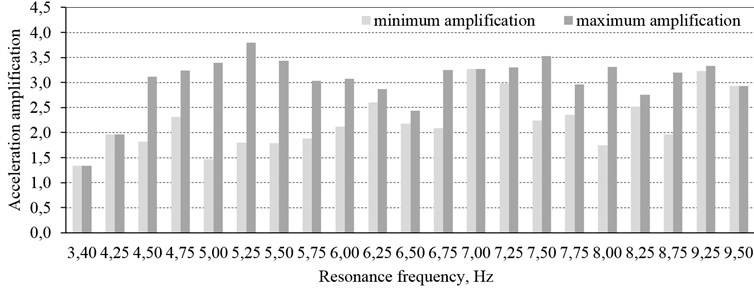
c) Belly over a frequency range 3,4-9,5 Hz
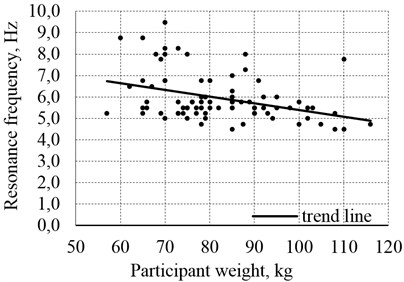
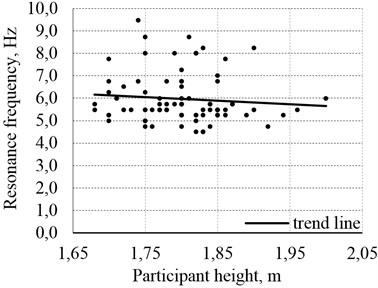
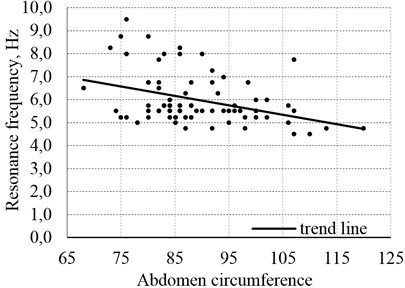
Each graph on Figs. 7-11 contains a trend line. In some graphs, the results are concentrated close to the trend line, whereas for others they are dispersed. With strong dispersion of the study results, determining a trend line is purely theoretical, as the dispersion does not allow to state that the trend line reflects relationship between the measured characteristics. To confirm which trend lines represent such relationship between the characteristics, the correlation coefficients have been determined for each pair of characteristics. The coefficient values are presented in Table 2. To simplify the analysis, the levels of correlations (low, moderate, etc.) have been marked with colors.
In all 24 analyzed instances (provided in Table 2) there was no very strong correlation and only one strong has been found. Similar occurrence has been found for the moderate and low correlations (7 and 8 instances respectively).
A third of the table comprises weak correlation, interpreted by I. P. Guiford [20] as nearly irrelevant.
Fig. 7Relationship between the chest acceleration amplification in the first resonance frequency fk01
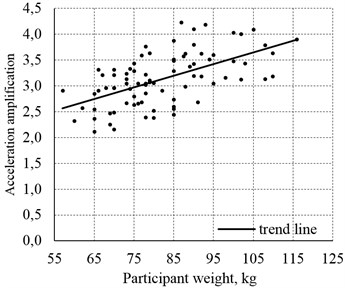
a) Participant weight
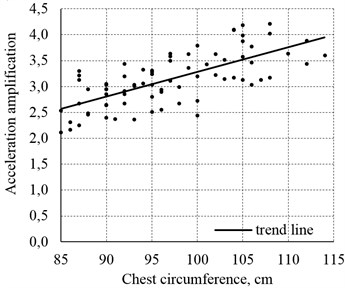
b) Participant chest circumference
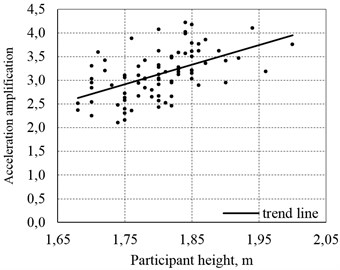
c) participant height
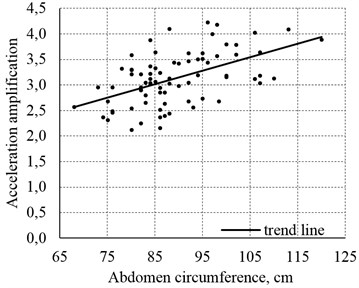
d) Participant abdomen circumference
Fig. 8Relationship between the abdomen acceleration amplification in the first resonance frequency fk01
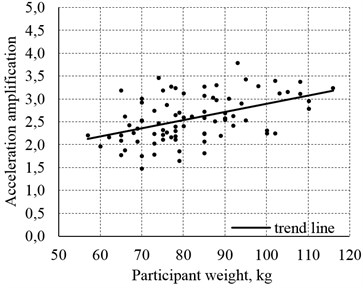
a) Participant weight
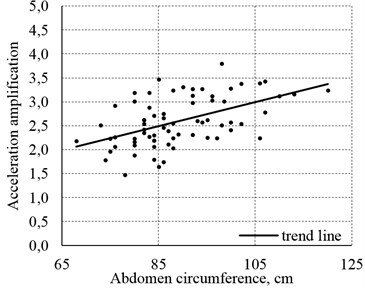
b) Participant abdomen circumference
In order to find well correlated characteristics, the correlations were sought between the same dynamic characteristics and coefficients that were specific transformation of essential anthropomorphic traits. The first such coefficient was the BMI (Body Mass Index), employed in medicine:
where: – body weight, kg; – body height, m.
Fig. 9Relationship between the first resonance acceleration of the head fg01
a) Participant weight
b) Participant chest circumference
c) Participant height
d) Participant abdomen circumference
Table 2Correlation between anthropometric human traits and quantities describing the spread of vibrations in human body
Anthropometric characteristics of participants | |||||
Body weight | Body height | Abdomen circumference | Chest circumference | ||
Acceleration amplification at the first resonance frequency | Head, | –0.02 | –0.01 | –0.004 | –0.08 |
Chest, | 0.58 | 0.53 | 0.53 | 0.7 (0.703) | |
Abdomen, | 0.47 | 0.14 | 0.52 | 0.38 | |
First resonance frequency | Head, | –0.41 | 0.11 | –0.34 | –0.28 |
Chest, | –0.32 | 0.17 | –0.33 | –0.24 | |
Abdomen, | –0.38 | –0.08 | –0.37 | –0.42 | |
Blue color – a correlation coefficient below 0.2 signifies weak correlation, and the dependence is irrelevant; Green color – a correlation coefficient 0.2 and 0.4 signifies low correlation, and the dependence clear but small; Yellow color – a correlation coefficient 0.4 and 0.7 signifies moderate correlation, and the dependence is substantial; Grey color – a correlation coefficient 0.7 and 0.9 signifies strong correlation, and the dependence is significant. | |||||
Next, the correlation with other coefficients, such as , , , , , , , was examined.
The positive results have been obtained only in , , .
The examples of relationship between the resonance frequency of the head and the BMI and the height/weight quotient are presented in Fig. 12, whereas the example relationship between amplification acceleration and the height/weight quotient as well as the weight squared are indicated in the Fig. 13.
Fig. 10Relationship between the first resonance frequency of the chest fk01
a) Participant weight
b) Participant chest circumference
c) Participant height
d) Participant abdomen circumference
Table 3Correlation between indexes that comprise the combination of various human anthropometric traits and the values representing the spread of vibrations in human body
Index | ||||
BMI | mass2 | height/masa | ||
First resonance frequency | Head, | –0.46 | –0.4 | 0.47 |
Chest, | –0.4 | 0.31 | 0.39 | |
Abdomen, | –0.35 | 0.37 | 0.39 | |
Acceleration amplification in first resonance frequency | Head, | –0.01 | 0.01 | 0.05 |
Chest, | 0.37 | 0.57 | –0.49 | |
Abdomen, | 0.43 | –0.47 | –0.45 | |
Blue color – a correlation coefficient below 0.2 signifies weak correlation, and the dependence is irrelevant; Green color – a correlation coefficient 0.2 and 0.4 signifies low correlation, and the dependence clear but small; Yellow color – a correlation coefficient 0.4 and 0.7 signifies moderate correlation, and the dependence is substantial; Grey color – a correlation coefficient 0.7 and 0.9 signifies strong correlation, and the dependence is significant. | ||||
Table 3 contains the values of the correlation coefficient for 18 pairs constituting a combination between the dynamic characteristics and the processed anthropometric index.
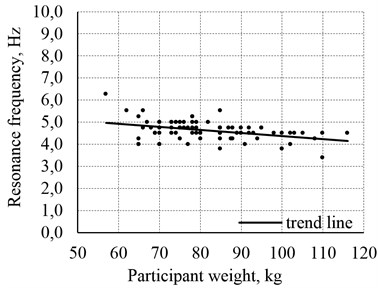
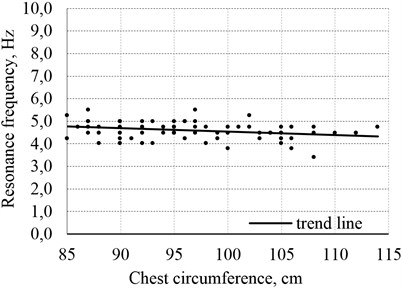
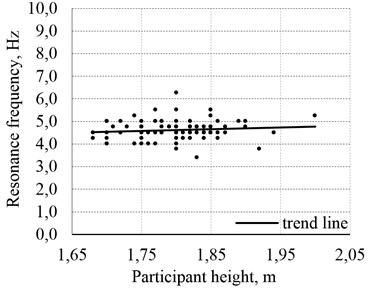
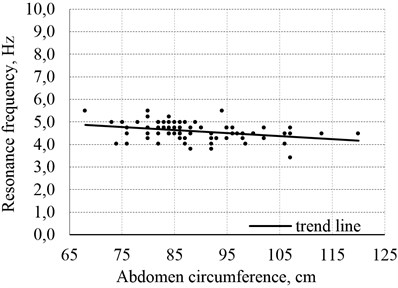
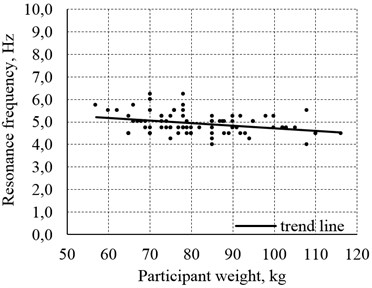
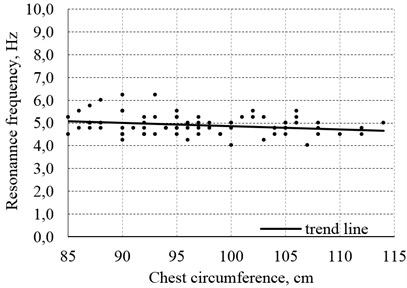
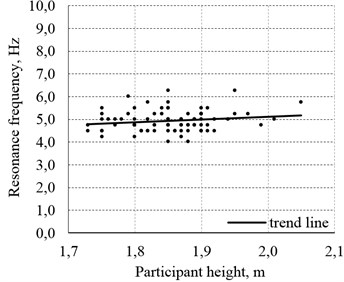
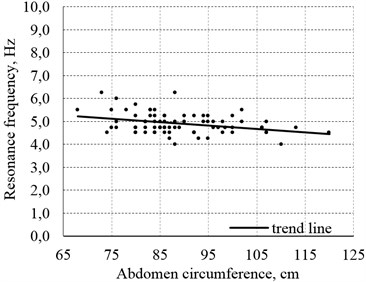
Fig. 11Relationship between the first resonance frequencies of the abdomen fb01
a) Participant weight

b) Participant chest circumference
c) Participant height
d) Participant abdomen circumference
Presented graphs (Figs. 7-13) and correlation assessment (Table 2, 3), it is possible to observe that:
1) Body weight:
– has a significant impact upon the first resonance frequency of the head and acceleration amplification in the resonance frequency of the abdomen and chest,
– has a clear but small influence on the first resonance frequency of chest and abdomen,
– has nearly irrelevant importance for acceleration amplification in the first resonance frequency of the head.
2) Body height:
– has a significant influence on the acceleration amplification in the first resonance frequency of the chest,
– has almost no impact upon the level of the first resonance frequency of all analyzed body parts as well as on the amplification in the first resonance frequency of the head and abdomen.
3) Abdomen circumference:
– has a strong influence upon the acceleration amplification in the first resonance frequency of the chest and abdomen,
– has a clear but small impact upon the first resonance frequency of all examined body parts,
– has almost no influence upon the amplification in the first resonance frequency of the head.
4) Chest circumference:
– has a strong influence upon the acceleration amplification in the first resonance frequency of the chest,
– has a strong influence upon the first resonance frequency of the abdomen,
– has a clear but small impact upon the first resonance frequency of the head, chest as well as upon the amplification in the first resonance frequency of the abdomen,
– has almost irrelevant influence upon the amplification in the first resonance frequency of the head.
5) BMI index:
– has a strong impact upon the first resonance frequency of the head as well as upon the acceleration amplification in the first resonance frequency of the abdomen,
– has a clear but small impact upon the first resonance frequency of the chest and abdomen, as well as amplification in the first resonance frequency of the chest,
– has almost no influence upon the amplification in the first resonance frequency of the head.
6) Weight squared:
– has a strong impact upon acceleration amplification in the first resonance frequency of the chest and abdomen,
– has a clear but small impact upon the first resonance frequency of all analyzed body parts,
– has almost no influence upon the amplification in the first resonance frequency of the head.
7) Height and weight quotient:
– has a strong influence upon the first resonance frequency of the head as well as upon the acceleration amplification in the first resonance frequency of the chest and abdomen,
– has a clear but small influence upon the first resonance frequency of the chest and abdomen,
– has almost no influence upon the amplification in the first resonance frequency of the head.
Fig. 12Relationship between the first resonance frequency of the head fg01
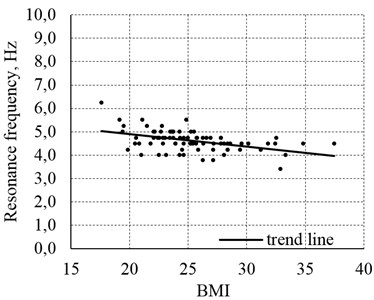
a) BMI
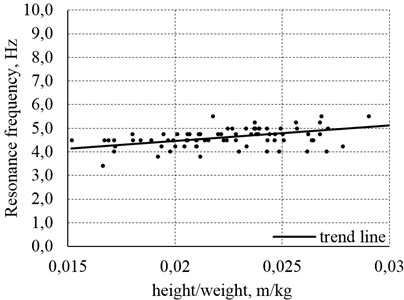
b)
Fig. 13Relationship between the acceleration amplification of the chest
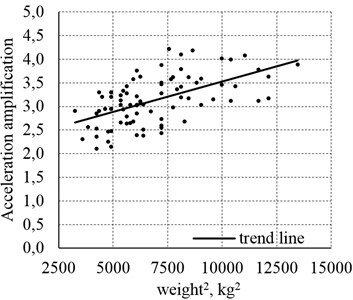
a) m2
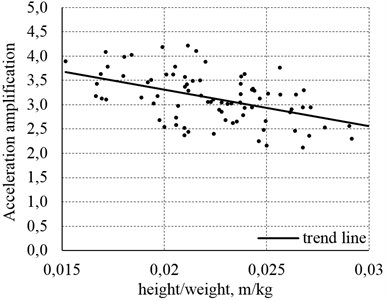
b)
4. Conclusions
The study confirmed the large diversity of human dynamic properties often found in literature. An argument has been coined that the anthropometric characteristics of the participants are one of the main reasons for this diversity.
Based on the correlation graphs and analysis it was concluded that:
1) The analyzed anthropometric characteristics did not appear to influence the amplitude of the first resonance frequency of the head.
2) Body weight and abdominal circumference, to varying degrees, both had a significant impact on the amplitude of the first resonance frequency of the abdomen.
3) Body weight, height, and abdominal circumference all had a significant impact on the amplitude of first resonance frequency of the chest.
4) The highest correlation of 0.7 was observed between chest circumference and the magnitude of the first resonance frequency of the chest.
No instances of very strong correlation have been found. However, introducing additional factors resulted in 15 new sets of parameters which characterize human body dynamic properties as well as the anthropomorphic traits or combinations thereof, which display a moderate correlation. It is interpreted as a relevant relationship. Thus, the coined argument has been partly confirmed, though it still fails to fully explain the reasons for such diversification of human body dynamic properties.
References
-
Osiecki J., Gromadowski T., Stępień B. Badania pojazdów samochodowych i ich zespołów na symulacyjnych stanowiskach badawczych (Testing Vehicles and Their Systems using Simulation Testing Stands). The Institute of Operating Technology, Radom, 2006.
-
Więckowski D. Ocena drgań pionowych samochodu oddziałujących na dzieci posadowione w fotelikach (Assessment of Vehicle Vertical Vibrations Affecting Children in Child Car Seats). PIMOT Scientific Publishing House, Warsaw, 2013.
-
Zuska A., Stańczyk T. L. Model antropodynamiczny siedzącego człowieka – propozycja nowej struktury modelu (Anthropodynamic Model of a Sitting person – a Proposition of a New Model Structure). Cracow University of Technology, Vehicle Testing, Krakow, 2014.
-
Książek M. Modelowanie i optymalizacja układu człowiek – wibroizolator – maszyna (Modelling and optimization of a human being – vobroisolator – machine system). Monograph, No. 244, Mechanics Series, Cracow University of Technology, Krakow, 1999.
-
Nader M., Korzeb J. Przegląd modeli biomechanicznych do oceny oddziaływania drgań na organizm ludzki (The Review of Biomechanical Models to Assess the Impact of Vibrations upon Human Organism). Materials of a 3rd National Symposium “Computer – Aided Systems for Engineering Works in Industry and Transportation”, University of Technology in Radom, Zakopane, 1999.
-
Zuska A. Modelowanie i analiza dynamiki układu fotel – kierowca (Modelling and analysis of Dynamics of the seat-driver system). Doctoral Thesis, Politechnika Świętokrzyska, Kielce, 2012.
-
Cullmann A., Wölfel H. P. Komfortbewertung und Sitzprüfung mittele des Schwingungsdummys MEMOSIK (Assessment of Vibrational Comfort and Control of Seats Using MEMOSIK Anthropodynamic Mannequin). Scientific Conference, House of Technology, Essen, 1998, (in German).
-
Fischer S. Dynamic dummy for the testing of drivers’sets. No. 0224, Focus on BGIA’s Work, Industry Health and Safety Institute – BGIA; at the Central Association of Industry Insurance Companies – HVBG, Augustin, Germany, 2005.
-
Knoblauch J., Wӧlfel H. P., Buck P. Ein Schwingungsdummy des sitzenden Menschen (Anthropodynamic Mannequin of a Human Body in a Sitting Position). ATZ 97, No. 10, 1995, (in German).
-
Knoblauch J. Entwicklung und Bau eines physikalischen Schwingungsmodells des sitzenden Menschen (Development and Construction of a Vibrational Model used for Assessing the Impact upon a Sitting Person). Doctor’s Thesis, Shaker Verlag, 1992, (in German).
-
Mansfield N. J., Griffin M. J. Vehicle seat dynamics measured with an anthropodynamic dummy and human subjects. Proceedings of Inter-noise, Vol. 96, Liverpool, UK, 1996.
-
Mozaffarin A., Pankoke S., Wölfel H.-P. MEMOSIK V – An active dummy for determining three-directional transfer functions of vehicle seats and vibration exposure ratings for the seated occupant. International Journal of Industrial Ergonomics, Vol. 38, 2008.
-
Nélisse H., Boileau P. É., Rakheja S., Patra S., Boutin J. Évaluation de mannequins anthropodynamiques destines aux essais de vibrations des sièges en laboratoires, Études et Recherches (Evaluation of Anthropodynamic Mannequins used for Laboratory Testing of Vibrational Seats. Studies and Researches). Report R479, 2006, (in German).
-
Richter B., Werdin S. Überarbeitung der Konstruktion und Bau von mechanischen Schwingungsmodellen des sitzenden Menschen (Modification of Structure and Construction of a Mechanical Vibrational Model used for Assessing the Impact of Vibrations upon a Sitting Person). Federal Institute for Occupational Safety and Health, Final Report F 1687, 1998, (in German).
-
Riedel S. Erprobung neuentwickelter Schwingungsmodelle des sitzenden Menschen mittels Round-Robin Test (Tests on Newly-Developed Vibrational Models used for Assessing the Impact of Vibrations upon a Sitting Person by means of a Round-Robin Test). Publications of the Federal Institute for Occupational Safety and Health, Tests, (in German).
-
Wölfel H. P. Numerical models and hardware dummies for simulating whole body vibration of human – an overview. Proceedings of the First American Conference on Human Vibration, West Virginia, U.S.A., 2006, p. 140.
-
ISO 5982:2001 Mechanical Vibration and Shock – Rane of Idealized Values to Characterize Seated – Body Biodynamic Response under Vertical Vibration.
-
Smith S. D., Smith J. A., Bowden D. R. Transmission characteristics of suspension seats in multi-axis vibration environments. International Journal of Industrial Ergonomics, Vol. 38, 2008.
-
Smith S. D. Resonance behavior of the human exposed to whole-body vibration. United Kingdom Group on Human Response to Vibration, Southampton, 1992.
-
Mończak K. Technika planowania eksperymentu (Experiment Planning Technique). WNT, Warsaw, 1976.
About this article
