Abstract
This paper presents a new method for the online modal analysis of heavy-duty dump truck frames in order to verify the true performance of the frame. Rather than commonly using raw response signals for covariance-driven stochastic subspace identification (Cov-SSI), it takes the average correlation signal of the raw signals as the input data of Cov-SSI for more efficient online modal identification. In this way, different data records can be combined coherently and the noise content and nonstationary phenomena are suppressed effectively, which allows the effective use of acceleration signals from the frame of the truck running under different road conditions and operating conditions for online modal analysis. It shows the theoretical basis of the proposed method and verifies its performance with both simulated and measured data sets. The results show that the proposed method yields a more accurate results compared with that of conventional Cov-SSI that uses raw signals as the input data. Therefore, the vibration behaviors of the frame obtained online are reliable, realistic and hence valuable for assessing the overall dynamic performance of the vehicle.
1. Introduction
Truck frames are a major structure in an automotive system. Along with sufficient strength to withstand complicated static forces, the frame should be sufficiently rigid to undertake dynamic shocks, twists and vibrations from different sources to meet not only the demands for lowering NVH but also improving handling and ride comfort characteristics. It means that the identification of dynamic properties of the frame is of great significance in order to minimize the influence of occurrences operating with resonances which may cause excessive dynamic stresses and result in structure failures, poor handing performance and high noise and vibration. In addition, accurate prediction of these dynamic properties is also critical for designing lightweight frame structures which are being paid more attention in recent years for improving fuel efficiency and reducing emissions.
Currently, the dynamic properties including modal parameters, natural frequencies, damping ratios, mode shape vectors are usually determined offline through finite element (FE) analysis and experimental verification [1-3]. During the experimental verification, the frame alone, without integration of other parts, is excited by controlled or known inputs such as impulsive forces by an impact hammer. Then both the input excitation and output responses are measured to estimate the modal parameters. These properties obtained offline in such ways can be an important reference for predicting the dynamics of overall system in a vehicle design process. However, in applications, the frame is assembled with all different systems and can behave very differently because of the effect of different nonstandard constraints which are difficult to be modelled in FE calculation and measured through conventional controlled excitations. Therefore, an online identification is necessary in order to obtain the real dynamic behaviors of the frame and to verify it to operate with minimized resonant conditions, which will provide reliable supports for final development and refinement of a vehicle.
Amongst many different techniques, the operational modal analysis (OMA) is the most potential one for online applications because it needs only output data which is easier to be obtained. Therefore, it has been used widely for the analysis of different civil structures [4-6]. Furthermore, many variants of OMA can be potentially useful for online dynamics analysis of the frame, in comparative studies in [7-8], the reference-based stochastic subspace identification (SSI/ref) [7] method was deemed to be more accurate, robust and efficient identification for OMA [9] and have been intensively explored recently in the field of ambient vibration data based modal identification. Moreover, by considering the road excitations as random inputs, subspace identification methods were investigated tried to estimate the vehicle handling dynamic model and predict the vehicle handling performances [10-11] using data from road tests. Therefore, this study is also based on this approach to implement the online analysis of frame dynamic responses.
However, the vibration responses measured on the frame during road tests are very noisy and exhibits strong nonstationary characteristics due to a number of complicated mechanisms of excitations including not only the stationary excitations of standard roads, but also random high-amplitude shocks of various nonstandard roads such as construction and mining sites. In addition, many secondary excitations including vibrations from the engine and its associated power train may also contribute significant content to the vibration. It means that the process does not fully meet the white-noise assumption underneath the theoretical derivation of SSI. It has found the direct use of measured signals including their covariances as the input for SSI/ref algorithms lead to the numerous deceptive modes and difficult to obtain a consistent result for the frame dynamics analysis. It means that a noise suppression method is required to pre-process the measured signals to improve the signal to noise ratio (SNR) significantly for effective use of SSI/ref methods.
On the other hand, the so-called Natural Excitation Technique (NExT) uses the correlation technique for modal identification. It was shown that the cross-correlation signals between two responses to white-noise inputs are of the same form as free vibration decay or impulse responses. In studies of [12] and [13] the use of cross-correlation functions between response channels were proposed and shown effectiveness for both stationary and non-stationary white noise ambient excitation signals for modal parameters identification. Based on these studies including the super performance of correlation function in extracting periodic signals in strong noisy data, an average correlation signal based SSI/ref is therefore proposed to suppress the noise and nonstationary responses measured on the frame the for identifying its dynamic properties.
The rest of the paper has four more sections. Section 2 outlines the theoretical basis of the proposed method. Section 3 verifies the performance of the method by using simulated signals. Section 4 presents the results and discussion for the modal parameters obtained through online identification. Finally, the conclusions are given in Section 5.
2. Reference based covariance-driven stochastic subspace identification using average correlation signals
2.1. State-space reorientation of vibration systems
For a degrees of freedom (DOF) vibration system its vibration responses including displacements , velocities and accelerations are usually expressed by a matrix form as [14]:
where , and denote the mass, stiffness and damping matrices, respectively; , and are the acceleration vector, the velocity vector and displacement vector at continuous time respectively, and is the exciting force vector.
To utilize the more efficient approaches in control engineering for system identification, SSI based paradigm reformulate Eq. (1) into a state-space format as:
where the state-space-vector includes both the displacement vector and the velocity vector of the vibration system, and is called as the system matrix to denote the system characteristics concisely by integrating all parameters together. For computational practices, Eq. (2) is usually be discretized with a time interval at time instant with the following two expressions:
where the discrete system matrix is and is the output allocation matrix to express the state-space variable when using sensors. Moreover, Eq. (3) takes into account noise contents involved inevitably in a system by introducing the process noise vector to the state-space equation and the measurement noise vector to the output equation with output vector . The process noise can be any disturbances and modeling errors whereas the measurement noise represents the inaccuracy of sensors and instruments. Both of them are inevitable in practice. Therefore, the inclusion of them would allow the more accurate investigations and achieving more agreeable results.
However, it is usually difficult to define these two noises in practical applications. For convenience, they are usually approximated as zero-mean white noise contents and hence elegant SSI paradigms are developed for effective estimation of the system characteristics.
2.2. Reference based covariance driven stochastic subspace identification
For stochastic subspace based system identification, the output measurements with time length (assumed to be infinitive) from sensors are organized into a Hankel matrix with block rows and columns according to the reference based SSI scheme in [7]:
Using the past reference sub-matrix from () channels and future sub-matrix , a covariance matrix between all outputs and the reference channels can be calculated and gathered in a block Toeplitz matrix as:
It can be shown that this Toeplitz matrix decomposes as:
Therefore, the Toeplitz matrix can be based on to estimate the observability and reference-reserved controllability matrix by applying the singular decomposition to it:
In which only the significant non-zero singular values are reserved and those close to zeros due to noise influences are ignored, leading to:
Based on Eq. (8) and (9), the system matrix can be constructed to be the first rows of and is the last columns of . Consequently, the system matrix can be found by using another shifted block Toeplitz matrix through:
which is due to the relationship of . This means that the system matrices , in Eq. (6) can be recovered using the output covariance data matrices. However, in practice, the data length is limited and therefore, the covariance expressed in Eq. (5) are just estimates. It means that these estimates may vary from measurements to measurements when data contains inevitable nonstationary effects, which will results in uncertainties in identification results. Moreover, when the SNR of measurements is low, the identification results may not be convergent.
In addition, because of the influences of different noises, the higher singular values in Eq. (7) are not zeros, which makes it difficult to identify the system order . Therefore, it is often to use a stabilization diagram to determine and corresponding model parameters.
Usually, the stabilization diagram is constructed conventionally by the increments of system order at a fixed row number. However, recent studies show [10, 15, 16] that the efficiency and accuracy of identification also depends on the variation of the row number the Hankel matrix and lead to an alternative stabilization diagram that is formed by consecutive increments of the row number at a fixed order and show more effectiveness, compared with conventional one. However, it needs to specify first which is usually unknown for most applications. To overcome this shortage, this study constructs the alternative stabilization diagram by varying the order simultaneously at each increment . This then ensures that significant modes can be selected automatically without the need to specify the in advance. The implementation of this new scheme will be depicted in Section 4.
2.3. Average correlation signal based covariance driven stochastic subspace identification (Acs-Cov-SSI)
To reduce the deficiency of in implementing Cov-SSI/ref, the correlation signals between sensors are taken as the input. Moreover, the correlation signal can be considered as the free-vibration decay or the impulse responses of a dynamic system [12], and has been used in various time domain based identification methods.
As the correlation signals are equivalent to the impulse responses, thus they can be taken unsurprisingly to be the outputs of state-space equation. Without double, a Hankel data matrix the same as Eq. (4) can be constructed using the correlation signals. In the same way, their covariance data matrixes of correlation signals also have the form as Eq. (6). Therefore, a correlation signal based Cov-SSI/ref can be implemented for SSI.
Furthermore, the correlation analysis using one data record is often not sufficiently effective to suppress the noise influence when the noise contents are very high such as that of the vibration responses of the truck fame. Usually there are multiple data records available which may be collected under similar or different operating conditions. Thus it is regular to have a scheme to combine these records together for a more reliable identification result. As correlation signals can be calculated using a specified reference sensor for all different records, the phase information between different records can be preserved by this reference-based correlation signals and hence an average of the correlation signals can be performed between different data recodes. It will enhance the contents with regular or periodic components by suppressing the irregular random contents in different data records. Particularly, the component that associates with one of system modes is often the more significant one. Moreover, its auto-correlation signal of the reference sensor always has zero-phase in different data records. Therefore, the average of the auto-correlation signals from different records effectively improves the SNR of the resultant correlation signals. Simultaneously, as cross-correlation signals maintain the relative phase connections to the reference signals, the average also enhance the desired regular components and suppress the noise contents. Specifically, the average correlation signals can be obtained by following steps:
1) Obtain numbers of data segments from channels measurements either by using multiple measurement records or segregating a very long record into small ones.
2) Select a reference channel such as which may have better SNR through a spectrum analysis and an analytic analysis to estimate which of the sensors is also less influenced by interferences such as the engine and power train in this study of the frame responses.
3) Calculate the auto and cross correlation signals of each segment with samples for different channels when taking the channel as the reference channel:
which can be calculated using the fast Fourier transform (FFT) algorithm to improve overall identification efficiency.
4) Average the correlation signals from different segments to obtain the average correlation signals for corresponding channels:
It will show that using the correlation signal and its average will significantly improve the SNR of input data and result in more accurate, robust and efficient identification.
3. Performance verification of the average correlation signal based SSI
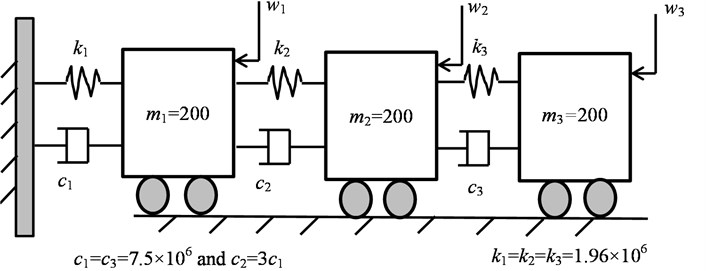
To verify the performance of suggested method, simulation studies were carried out based on a classic 3-DOF system. As shown in Fig. 1 the system is mainly excited by the random noise with different levels for producing corresponding output signals. The random input of the system have three the independent random excitations consisting of both a stationary white noise and multiple random impulsive impacts which are applied to , and respectively. This attempts to mimic the road excitations for both the random profiles with small amplitudes and occasional impacts with large amplitudes for nonstandard roads. In addition, the measurement noise are also added to the noise-free outputs to form the noise contaminated signal by:
where is a band-pass white noise with and the noise amplitude factor is defined to be:
which allows the performance of noise suppression using the average correlation signal to be evaluated under different values.
Fig. 13-DOF model under the random excitation
3.1. Modal identification using correlation signals
Fig. 2 shows three typical acceleration responses at , and respectively when the system under the noise excitation. The length is 50 second length with a sampling interval 0.001 s. In addition, the responses are adduced with Gaussian noise for . i.e. the measured signal has 50 % content of noise. Compared with the levels of noise addition in previous studies such as that in [16], this 50 % is significantly higher under a damping ratio more than 10 % which is also common in real applications including current study and many other ambient vibration responses based identification. Therefore, the signal looks very noisy, showing little phenomena of periodicity relating to the responses corresponding to the three vibration modes of the system. However, distinctive transient responses with high amplitudes can be seen from time to time in the three responses, showing the nonstationary characteristics due to the effect of the high amplitude random impacts.
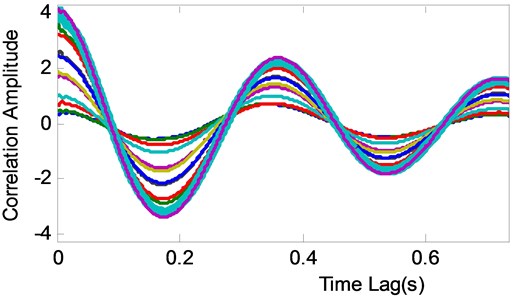
In contrast, the auto and cross correlation signals from these signals in Fig. 2 exhibit little noise influence but clear periodic contents relating to the free vibrations responses of the three modes. This verifies the high effectiveness of noise suppression by the correlation analysis. Therefore, it is expected that these correlation signals will give better identification results.
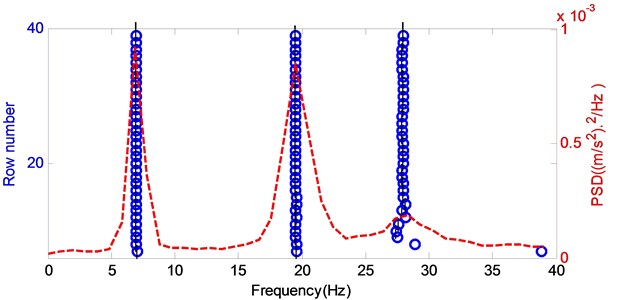
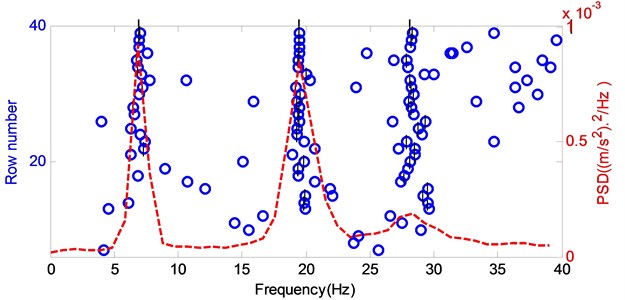
A comparison of system identification using these two types of signals is presented with a new form of stabilization diagrams as shown in Fig. 3(a) and (b). Similar to that in references [10, 15, 17], these stabilization diagrams are obtained by varying the row numbers of the Hankel matrix rather than increasing model orders which may leads to more spurious modes and cause more difficulties for modal parameter determination. However, at each row increment the model order is also updated automatically by using a singular value difference spectrum method [17, 18] in order to ensure new significant modes to be included when they becomes more potential as the noise influence is smaller with different lengths of columns . From these stabilization diagrams, the three modes can be identified based on three clusters of modes formalized with row number increments. However, the correlation signal based Cov-SSI allows a much faster convergent to the theoretical results with only a few of spurious modes. In contract, the raw signal based Cov-SSI exhibits highly unstable characteristics for each frequency cluster and produces many spurious modes that are caused by noise content. It will causes more difficulties in extracting the modes reliably.
Fig. 2Raw acceleration signals and their correlation signals
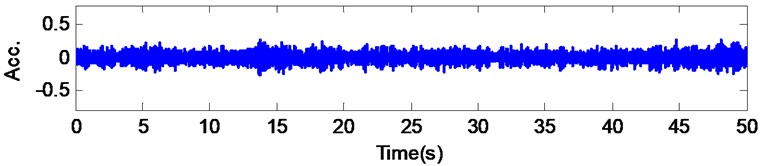
a) Acc. at
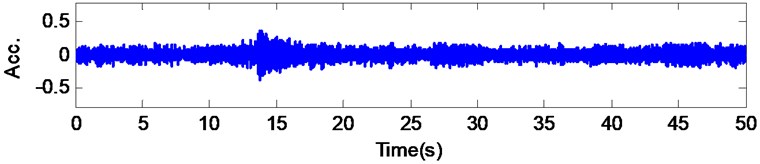
b) Acc. at
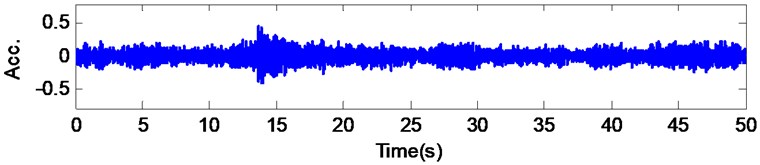
c) Acc. at
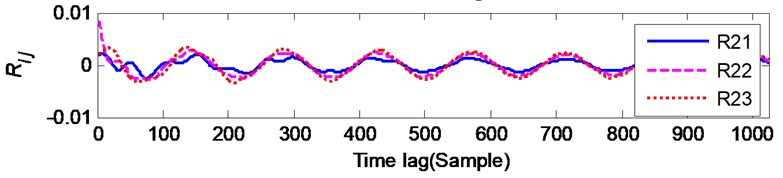
d) Correlation signal
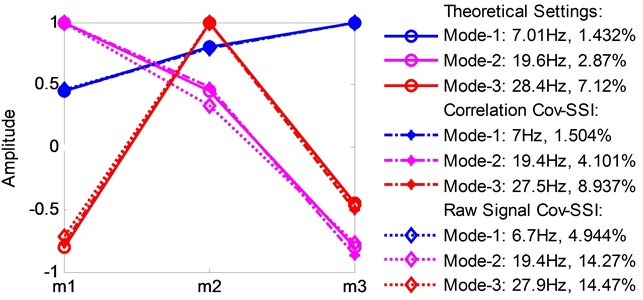
As shown in Fig. 3(b), the occurrence of modes is still around the theoretical frequencies in spite of noise influences. For more accurate comparison, the modal parameters are determined by extracting stable modes across different rows within which the scatter of modes from the frequency centers are relatively small. Firstly the modes at the potential frequency band are selected to be candidate ones when the occurrence rate across the last 25 rows is more than 70 %. Then these candidates are further refined by keeping only those of their modal assurance criterion (MAC) [19] and damping ratio values within 0.2. Finally the mean value of frequency, damping ratio and modal shape from the selected modes is taken as the final identification results. As shown in Fig. 3(c), both methods can produce an accurate estimation for the modal frequencies. However, the modal shapes and damping ratios obtained by using raw signals have larger differences from the theoretical ones. On the other hand the correlation signal based estimation produce much better estimates for both the modal shapes and damping values. This demonstrates the clear advantage of using correlation signals.
Fig. 3Comparison of stabilization diagrams between correlation signal and raw signal
a)
b)
c)
In addition, the computational demands and memory usage for obtaining the stabilization diagram is much less for implementing the correlation signal based SSI because the size of Hankel matrix from correlation signals is only about 2 % of that of the corresponding raw signals.
Fig. 4The performance of average correlation signals based Cov-SSI
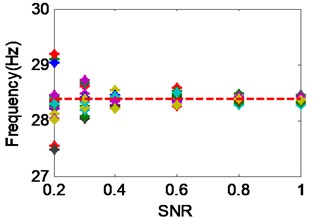
a) Variation of frequency vs SNR
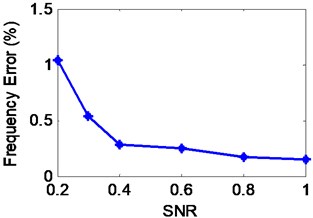
b) Avarage error of frequency
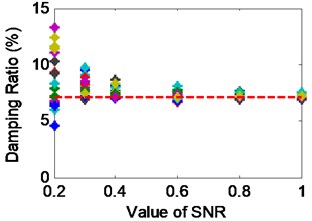
c) Variation of damping ratio vs SNR
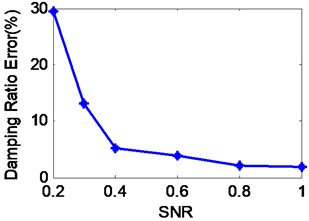
d) Avarage error of damping ratio
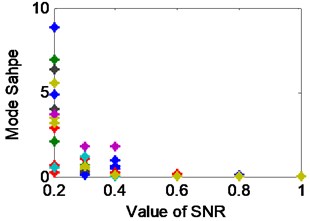
e) Variation of modal shapes
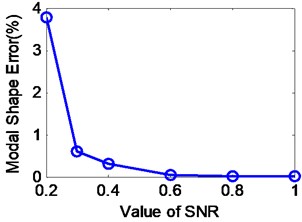
f) Avarage error of modal shapes
3.2. Modal identification using average correlation signals
To examine the full capability of noise suppression using average correlation signals, Monti Carlo experiments were conducted under different SNR values. Firstly, it is identified that more than 80 averages of correlation signals according to Eq. (22) allow a stable results to be obtained which have acceptable estimation errors. Then, the noise suppression experiments were carried out with the 80 average of the correlation signals but with varying SNR values. However, the raw signals based Cov-SSI is unable to obtain a convergent result when SNR is lower than 0.5, their results cannot be compared to that of the correlation signal based SSI. In addition, as shown in Fig. 4, the signal content relating to the third mode has lower SNR due to its higher damping ratio, the performance study is thus focused on the identification of this particular mode which is difficult to be extracted so as to highlight the effect of the average correlation signals on noise suppression.
The results in Fig. 4 are from 20 Monti Carlo tests. They show that a consistent result can be obtained even if SNR is as low as 0.2 at which each test is able to produce clear stable modes in the stabilization diagram based on which the modal parameters can be extracted reliably using the aforementioned extraction procedure. Moreover, the average errors for frequency and modal shape estimation are still acceptable for engineering applications. However, the error for damping ratio is relatively high which is the common problem reported in previous studies.
The results also show that as the SNR becomes higher, the variations and average errors between different tests become smaller, showing that less variation between different identifications. Therefore, it can give an assessment of identification accuracy for real applications when the SNR is unknown. This can be achieved by observing the variation ranges between several times of trail identifications.
In general, this confirms the effectiveness of the average scheme in suppressing noises which come from different measurements. Especially, they are from different excitation conditions including the nonstationary ones existing with high impact amplitudes. Therefore, the proposed method is reliable and robust to be applied to test data sets from different road profiles and different operating conditions for identifying possible modes of the truck frame.
4. Online modal analysis of heavy duty truck frames
The primary vibration source of a truck frame is the road-tire interactions. However, the characteristics of the road randomness are filtered by the vibration system constituted by the tire and the suspension system. It means that the frame will subject to an excitation whose frequency content is narrowly banded and thus the implementation of SSI with the measured signals means a severe deviation from the white-noise assumption underneath the theoretical derivation of SSI and results in incomplete identification results. However, vehicles usually operate a relatively wide speed ranges and on a different road conditions. Therefore, the frequency band of excitations can be sufficiently wide to activate the vibrations of interest for the fame dynamic analysis when different measurements are combined through the average correlations methods and approximate the SSI based theoretical.
In the meantime, the frame may be also excited by the engine and its associated power train. It means that the responses may contain deterministic components of the working frequencies relating to the engine and power transmission. However, the inevitable variation of operating speeds due to varying severe road conditions, the deterministic components will spread in a certain frequency range. Moreover, the centers of the spread are different from operating conditions and the average will be also effective in suppressing these influences. Nevertheless, because of the soft connection of these components to the frame, their contribution to the overall vibration responses are much smaller compared with that of road roughness excitation.
4.1. Raw vibration signals
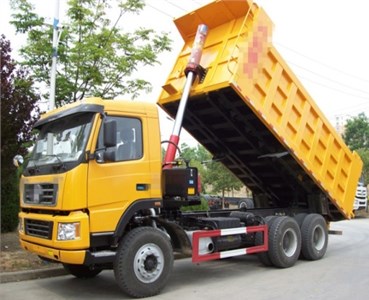
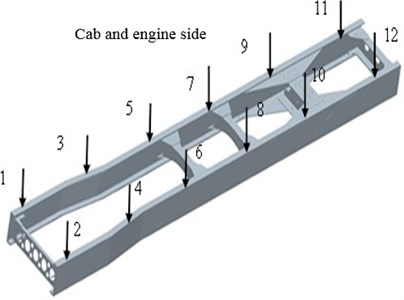
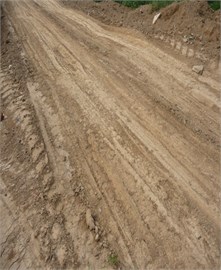
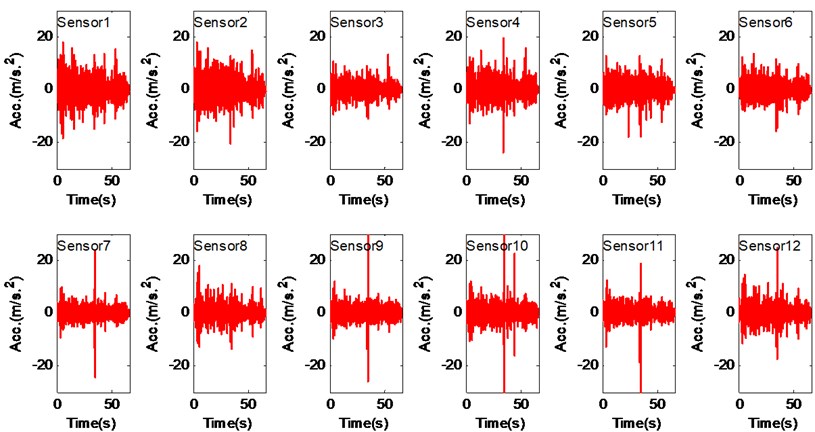
Fig. 6 shows typical segments in a vibration record from 12 accelerometers uniformly mounted on the frame in vertical direction, as illustrated in Fig. 5. The frame is used for a 25 ton heavy duty dump truck shown in Fig. 5. Its structure of the frame has been newly optimized for better strength, handling stability and lightweight performance. By offline FE analysis and hammer based modal test evaluation, the new frame was confirmed to have a frequency increase about 5 Hz for the first 11 modes but its weight is 4.3 % less than the original one. Therefore, it is expected to the new frame should produce a significant impact on the strength, handing and NVH performance of the vehicle. However, it is difficult to evaluate through FE method and conventional tests. Therefore, an online modal analysis was conducted to check and evaluate if any significant vibration modes occurs when the vehicle operates under real operation road conditions.
As the vehicle is designed to operate mainly in construction fields and mining sites where the road condition is usually poor such as typical site were used for the online tests. Fig. 5 shows two examples of this road. It exhibits very oscillating profiles which have many large valleys and sharp summits which cause high vibrations and lead to severe dynamic loads and high vibrations to the frame. During tests, the vehicle operated between 10 km/h to 30 km/h for both loaded and unloaded cases, which are typical operating modes for such vehicles as they repeat the same trips for transporting materials during most time of its services.
For each vehicle load case, more than 10 data records with a sampling rate of 1000 Hz were obtained. Each record lasts about 6 minutes or 360,000 samples, yielding a sufficient data length of (18,000) for correlation signal calculation when segregating each record into 20 short segments. Consequently, the number of average can be more than 100 times in order to suppress noise influences and extract vibration components relating to frame modes.
Fig. 5The operation modal test of heavy duty truck and the surface of test road
a)
b)
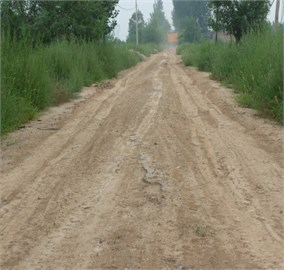
c)
d)
Fig. 6 shows representative signals when the vehicle was at about 30 km with load. It shows that the signals are nonstationary with local large responses. Their spectra show that the signal energy is mainly below 10 Hz and regarded due to the responses of suspension system effects. However, the frequency range from 10 Hz to 100 Hz, which is of interest for the frame dynamic analysis, show much lower amplitudes and wide spread patterns. It means that this vibration content is very noise and difficult to find frequency components which appear in all channels to be taken as potential mode. In general, the signal content is very noisy and it is impossible to use it directly for SSI algorithms.
However, the average correlation signals in Fig. 7(a), which has 1024 lags and obtained from all 20 segments of 6 data records and tests, show smooth free decay patter with a clear periodic component across all channels. As the component is in low frequency range, it allows the confirmation that these responses are mainly due to the resonances of the suspension system. Moreover, many small regular periodic components can be observed in the average correlation signals. Although they are small in amplitude, they may indicate the existence of high frequency modes which may come from the frame responses.
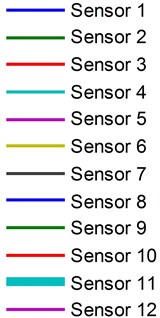
On the other hand, a typical set of raw correlation signals shown in Fig. 7(b), i.e. without average processing, show many irregular oscillations, indicating that the presence of noise influences is still high. Therefore, the average of raw correlation signals is effective to suppress noise and any random disturbances for more reliable identification.
Fig. 6Raw vibration signals and their spectra
4.2. Vibration characteristics for unload operation
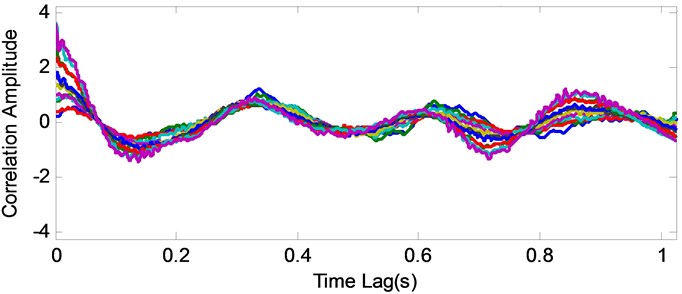
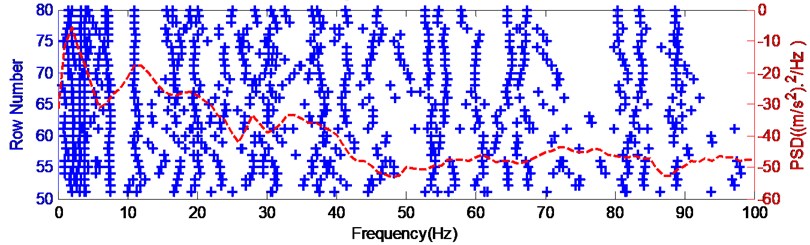
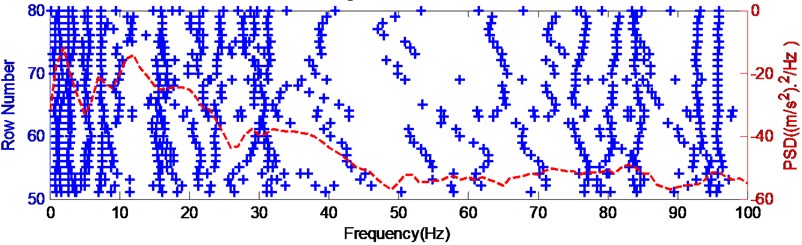
Using the average signals as the input data to Cov-SSI and setting the threshold of singular value differential spectrum to be 3×10⁹ for selecting system orders at each row number increment. It has found that the value of in Eq. (7) varies between 50 to 60 for the state-space model, equivalent to about 25 to 30 orders of the vibration system, which is nearly the double of the order number predicted by offline FE calculation. This higher value ensures the selection of modes which have mall energy and masked by noise and which may be induced more when the frame structure becomes more complicated when it is mounted with more devices such as the loading, cab, system and container etc. Simultaneously, the increment of row number is also 40 at which most modes with low level energy start appear in the stabilization diagram, whereas the maximum row number is set to 80 beyond which too many spurious modes have been relating to computational errors.
Fig. 8 shows the alternative stabilization diagram in the frequency range from 0 to 100 Hz for the unloaded case. It can be seen there are a number of stable modal frequencies below 10 Hz, which are due to the effect of suspension systems. However, apart from the model around 11 Hz, many other potential high frequency modes exhibit less stable behavior because of the influences heavy noise including the secondary random excitation from the hydraulic loading system and container. Nevertheless, these potential modes such as around 38 Hz, 55 Hz, 81 Hz and 89 Hz show very high appearance rates and show high chances of frame resonances.
Fig. 7Average correlation signals and raw correlation signals
a)
b)
To confirm these modes, three steps are adopted to extract modal parameters based on the modes occurrence rate in the stabilization diagram. Firstly the modes at the potential frequency band are selected to be candidate ones when the occurrence rate across 30 rows is more than 60 %. Then these candidates are further refined by keeping only those of MAC and damping ratio values within 0.2. Finally the mean value of frequency, damping ratio and modal shape from the selected modes is taken as the final identification results. In this way, irregular modes due to noise, secondary excitations and computational effect are excluded and leave those of exhibiting high appearance rate to be the modal parameters.
As shown in Fig. 8(b), there are 8 stable modes extracted from the stabilization diagram by the extraction procedure. Obviously, the first four of them are rigid body motions and regarded as to be mainly due to the suspension vibration system. In particular, the first and the second one exhibit clear motion features of pitch and bounce modes respectively. However, due to the effects of non-uniformity and nonlinear behaviors of the suspension system, the third and fourth one only small rolling motion but have large pitch motions in the rear portion of the frame because it is easier to cause such motions when the container is empty. Obviously, these modes will influence the ride comfort and handling stability, it is advised to operates at lower speeds under this poor road conditions to ensure comfort and safety operation. As these results including the amplitudes of corresponding damping agree very well the general dynamics of the suspension system, it is ensured that the proposed method including the use of average correlation signals and mode selection scheme are reliable.
Fig. 8Modal analysis results for unloaded case
a) Stabilization diagram for 10-30 km/h without load
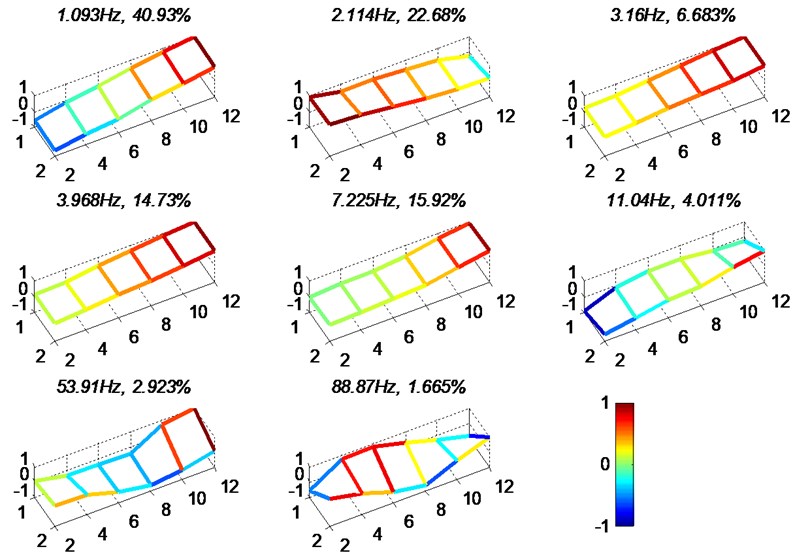
b)
However, in the low frequency bands, a significant mode at 7.225 Hz should be regarded as to be more relating to the frame as its modal shape shows clear bending profile. Similarly, the mode at 11.04 Hz with the localized bending and twisting profiles is also associated with the frame responses. Especially, both of them have relatively high energy and may cause additional stresses to the frame. However, as these high oscillations occur at the two ends of the frame, they indicate additional dynamic loads may cause high stress at the positions close to each ends. On the other hand, the much lower stress may be induced to the middle part of the frame where withstands high static stress due to accessories. It means that the stress distribution is relatively balanced and therefore the new design of the frame is rational the unload operation.
In the high frequency the two modes at 53.91 Hz and 88.87 Hz exhibit large bending profile at the position close to the rear suspension and high twist across the whole frame. As they have very low vibration energy their effects on dynamic forces can be ignored but they may cause high noise and vibration which pollute the driver and operation sites.
Fig. 9Modal analysis results for loaded case
a) Stabilization diagram for 10-30 km/h without load
b)
4.3. Vibrations characteristics for loaded operation
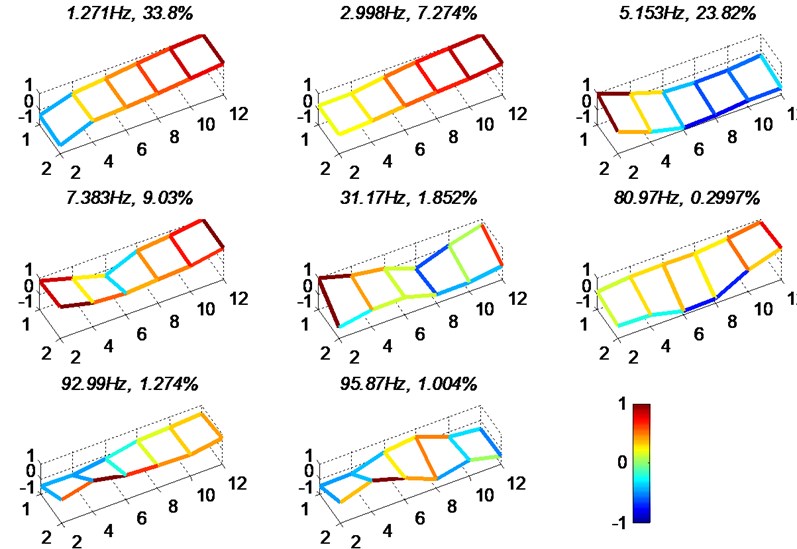
In the same way as the unloaded case, the stabilization diagram for the loaded operation is obtained. As shown in Fig. 9(a), the spread of modes is different from the unloaded one due to the combined effects of the increased mass and stiffness of the nonlinear plate spring. In particular, as the vehicle moves relatively smoother, noise influences including secondary excitations from joints for the container and loading systems and contact surfaces are less and therefore spurious modes are less and stable modes are more distinctive. In addition, most modes appear in the frequency range lower than 30 Hz and higher than 70 Hz approximately.
As shown in Fig. 9(b), there are only two modes relating to suspension system. One is the pitch modes the other is the bounce one. Their corresponding frequencies are higher compared with the unloaded case because the nonlinear effect of the plate spring units is more than the mass increase when the vehicle is loaded with materials. In the meantime, as the vehicle moves smoother with load, the other two higher frequency modes are insignificant.
The modal shapes at frequencies 5.153 Hz and 7.383 Hz are thought to be due to the frame as they exhibit localized profiles. Because of the effect of larger mass due to the load, the first bending mode occurs at lower frequencies compared with that of unloaded case. Especially, these two modes all show that the bending deformation is around the position close to Sensor 6, which indicates that there are high dynamic stress close to this position and the frame may needs to be improved to increase stiffness at this position.
Furthermore, with increased mass, more high frequency modes become significant in the high frequency range from 30 Hz to 100 Hz. This mainly due to that noise from secondary vibration excitations such as interactions between different joints become less. In addition, modal frequencies and associated shapes also show clear differences from that of the unloaded case. Nevertheless, these high frequency vibrations have much lower energy and may cause insignificant dynamic loads to the frame. However, they will affect the NVH performance of the vehicle.
Attention on stable modes in association with FE results and offline results and their influences on strength, handling and ride comfort performance.
5. Conclusions
To verify the true dynamic performance of the chassis frame for a heavy-duty dump truck, a new method is proposed in this paper to obtain online modal parameters while the vehicle is operating in real operation conditions. Based on the conversional Cov-SSI/ref algorithm, the new method takes the average correlation signals of the raw signals as the input data to the algorithm. The theoretical basis of this method is outlined and its performance is verified by simulation studies when the data contains not only stationary characteristics but also considerable nonstationary phenomena which are typical road conditions where the vehicle operates on. It confirms that the method can produce reliable results when the SNR is as low as 0.2 when the damping ratio as high as 0.1. However, it is impossible for the conventional raw signal and data covariance based SSI to have a convergent result for this more extreme conditions.
Moreover, the online test carried out when the vehicle operated in a real construction site where the road condition is nonstandard but many large valleys and sharp summits further proves the feasibility of the method. It not only reliably identifies the modes associated with the suspension system which higher vibration energy and better SNR but also is managed to result in several low frequency modes (5 Hz to 30 Hz) relating to the frame when the SNR is very low. In general the online results show less modes compared with that offline results. However, the presence of these low frequency modes under loaded condition suggests that the structure of the frame may need to be improved further to avoid the high stress induced by these resonances. In the meantime, the presence of occurrence of high frequency modes in the high frequency range (30 Hz to 100 Hz) is also need to be reduced to minimize NVH associated vibrations. In addition, the calculated modes in the stabilization diagram for the unloaded case spread widely in the low frequency range associating with the frame, showing that vibration components scatter more uniformly in wide frequency rang or without distinctive modes that may cause high dynamic loads. In this sense, the feature of wide mode spread may be a useful reference when further improving of the frame structure for the loaded case, which will be one of research interests in developing modal property based structure optimization methods.
References
-
Mi C., Gu Z., Yang Q., Nie D. Frame fatigue life assessment of a mining dump truck based on finite element method and multibody dynamic analysis. Engineering Failure Analysis, Vol. 23, Issue 6, 2012, p. 18-25.
-
Yilmazçoban I. Kutay, Kahraman Yaşar Truck chassis structural thickness optimization with the help of finite element technique. The Online Journal of Science and Technology, Vol. 1, Issue 3, 2011, p. 22-29.
-
Chen Z., Wang T., Zhao Z., Shen J., Zhen D., Gu F. The lightweight design of a dump truck frame based on dynamic responses. 18th International Conference on Automation and Computing, Manchester, 2012, p. 7-8.
-
Peeters B., Roeck G. D. Stochastic system identification for operational modal analysis: a review. Journal of Dynamic Systems, Measurement and Control, Vol. 123, Issue 4, 2001, p. 659-667.
-
Ventura C. E., Katherine M. T. Dynamic properties of a 32-storey building determined from different analysis methods of ambient vibration test data. In Proceedings of the Second International Operational Modal Analysis Conference, Copenhagen, Denmark, 2007.
-
Magalhaes F., Cunha A., Caetano E. Online automatic identification of the modal parameters of a long span arch bridge. Mechanical Systems and Signal Processing, Vol. 23, Issue 2, 2009, p. 316-329.
-
Peeters B., Roeck G. D. Reference-based stochastic subspace identification for output-only modal analysis. Mechanical Systems and Signal Processing, Vol. 13, Issue 6, 1999, p. 855-878.
-
Parloo E., Verboven P., Guillaume P., van Overmeire M. Sensitivity-based operational mode shape normalization. Mechanical Systems and Signal Processing, Vol. 16, Issue 5, 2002, p. 757-767.
-
Reynders E., Roeck G. D. Reference-based combined deterministic-stochastic subspace identification for experimental and operational modal analysis. Mechanical Systems and Signal Processing, Vol. 22, Issue 3, 2008, p. 617-637.
-
Dong G. M., Chen J., Zhang N. Investigation into on-road vehicle parameter identification based on subspace methods. Journal of Sound and Vibration, Vol. 333, Issue 24, 2014, p. 6760-6779.
-
Guan X. Q., Yuan M., Zhang J. W. Application of subspace-based method in vehicle handling dynamic model identification and properties estimation. International Journal of Vehicle Design, Vol. 56, Issue 1, 2011, p. 125-145.
-
Chiang D. Y., Lin C. S., Su F. H. Identification of modal parameters from ambient vibration data by modified eigensystem realization algorithm. Journal of Aeronautics, Astronautics and Aviation Series A, Vol. 42, Issue 2, 2010, p. 79-85.
-
Chang M., Pakzad S. N. Modified natural excitation technique for stochastic modal identification. Journal of Structural Engineering, Vol. 139, Issue 10, 2012, p. 1753-1762.
-
Juang J.-N. Applied System Identification, 1st Edition. Englewood Cliffs, Prentice Hall, NJ, 1993.
-
Zhang Y., Zhang Z., Xu X., Hua H. Modal parameter identification using response data only. Journal of Sound and Vibration, Vol. 282, Issue 1, 2005, p. 367-380.
-
Reynders E., Pintelon R., Roeck G. D. Uncertainty bounds on modal parameters obtained from stochastic subspace identification. Mechanical Systems and Signal Processing, Vol. 22, Issue 4, 2008, p. 948-969.
-
Wu W. H., Chen C. C., Wang S. W., Gwolong L. Modal parameter determination of stay cable with an improved algorithm based on stochastic subspace identification. Proceedings of 7th European Workshop on Structural Health Monitoring, Nantes, France, 2014.
-
Zhao X., Ye B. Selection of effective singular values using difference spectrum and its application to fault diagnosis of headstock. Mechanical Systems and Signal Processing, Vol. 25, Issue 5, 2011, p. 1617-1631.
-
Allemang R. J. The modal assurance criterion – twenty years of use and abuse. Sound and Vibration, Vol. 37, Issue 8, 2003, p. 14-23.
About this article
Research supported by the graduate Excellent Innovation Project of Shanxi Province of China Project No. 2012-302 and the High Technology Industrialization Project of Shanxi Province of China Project No. 2011-2368.
